Clinical Trial
. 2021 Feb 4;184(3):775-791.e14.
doi: 10.1016/j.cell.2021.01.004. Epub 2021 Jan 9.

Multi-organ proteomic landscape of COVID-19 autopsies

Affiliations
Clinical Trial

Multi-organ proteomic landscape of COVID-19 autopsies

Xiu Nie et al. Cell. .

Abstract

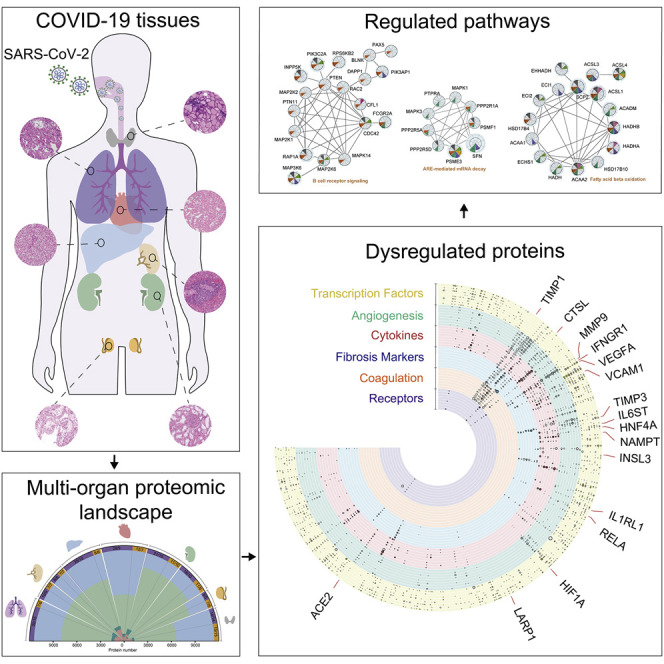
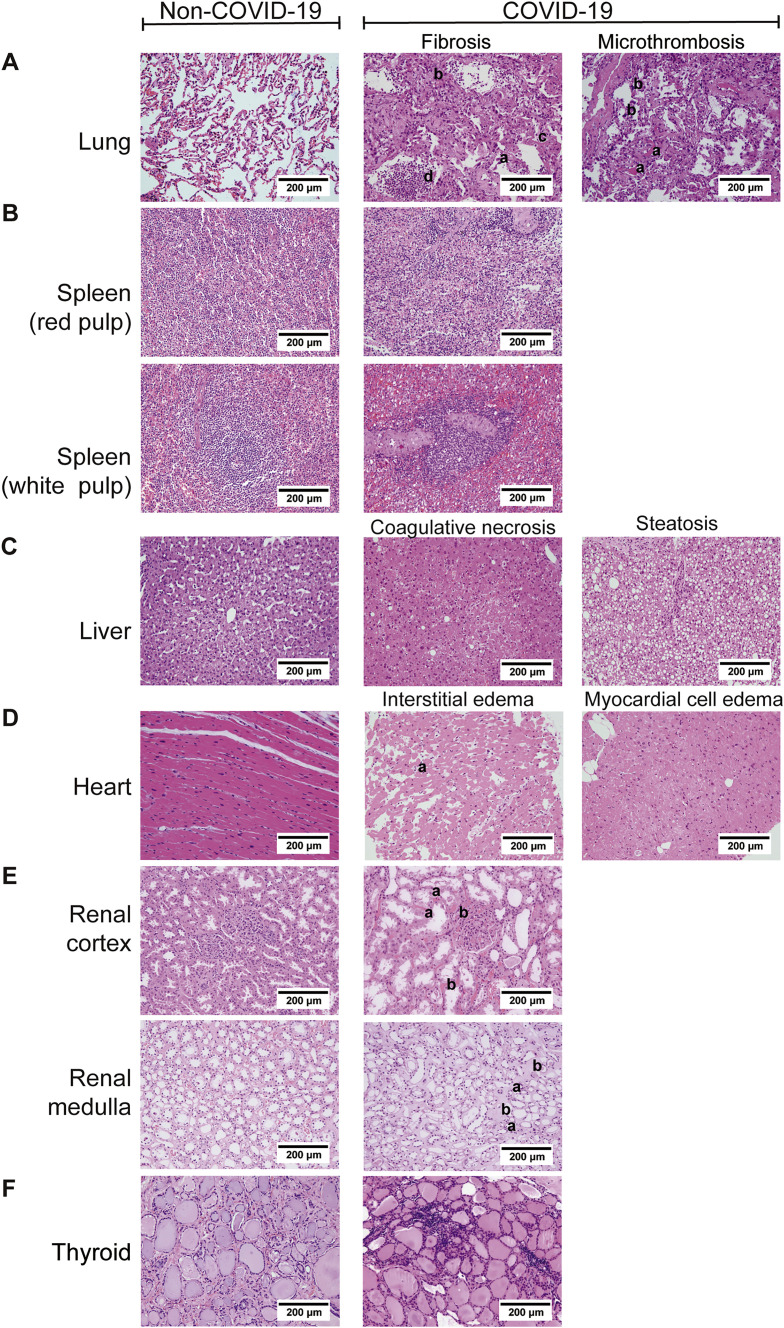
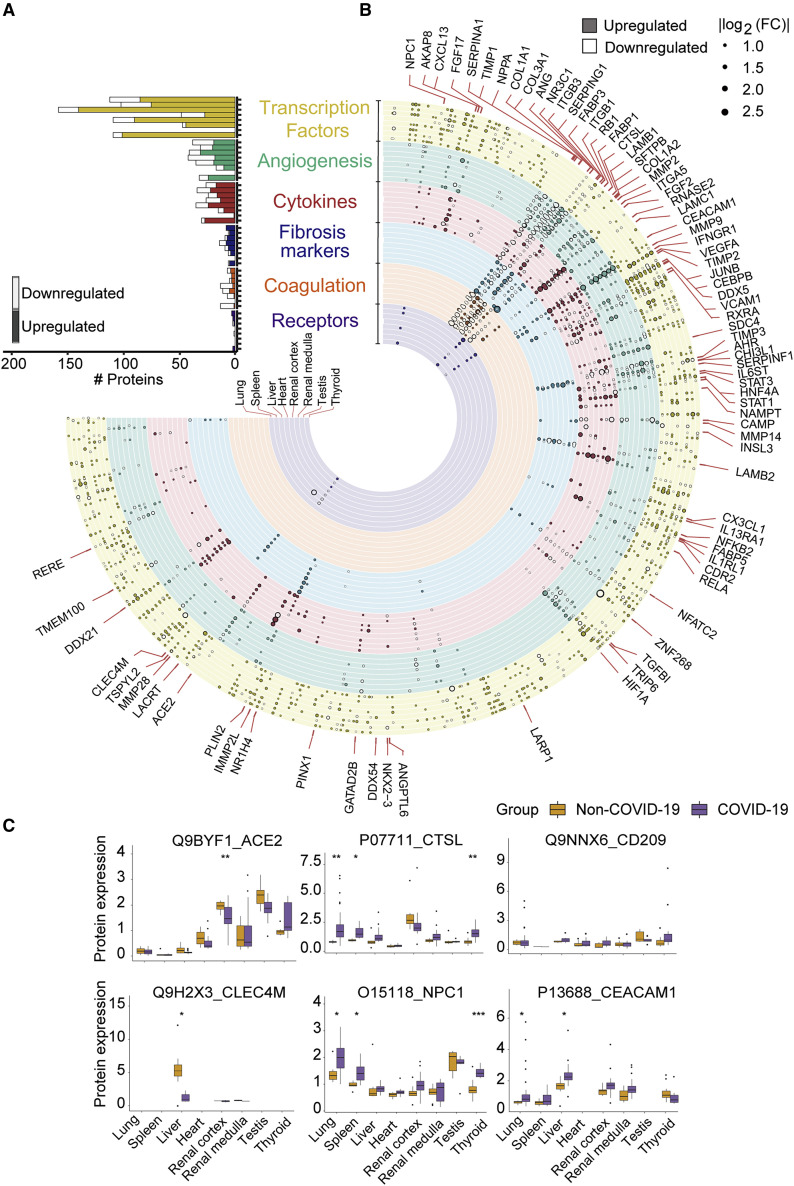
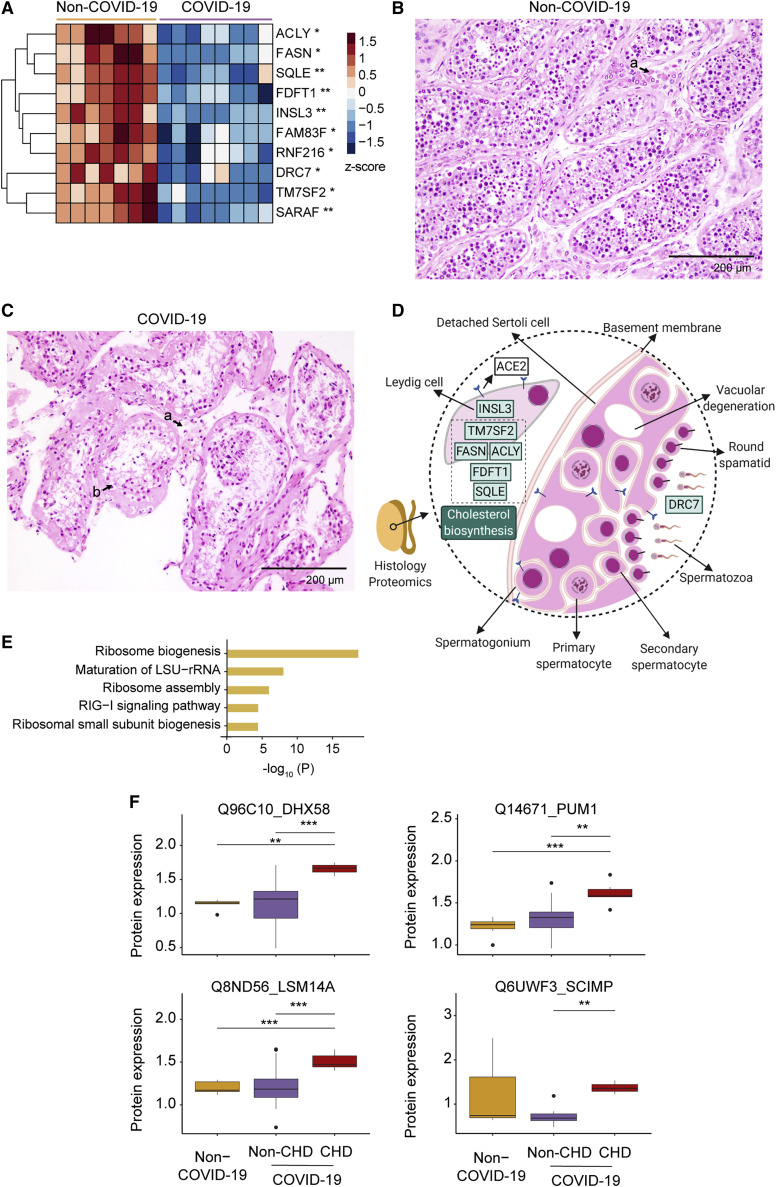
The molecular pathology of multi-organ injuries in COVID-19 patients remains unclear, preventing effective therapeutics development. Here, we report a proteomic analysis of 144 autopsy samples from seven organs in 19 COVID-19 patients. We quantified 11,394 proteins in these samples, in which 5,336 were perturbed in the COVID-19 patients compared to controls. Our data showed that cathepsin L1, rather than ACE2, was significantly upregulated in the lung from the COVID-19 patients. Systemic hyperinflammation and dysregulation of glucose and fatty acid metabolism were detected in multiple organs. We also observed dysregulation of key factors involved in hypoxia, angiogenesis, blood coagulation, and fibrosis in multiple organs from the COVID-19 patients. Evidence for testicular injuries includes reduced Leydig cells, suppressed cholesterol biosynthesis, and sperm mobility. In summary, this study depicts a multi-organ proteomic landscape of COVID-19 autopsies that furthers our understanding of the biological basis of COVID-19 pathology.

Keywords: COVID-19; angiogenesis; autopsy; cathepsin; coagulation; fibrosis; hyperinflammation; pathology; proteome; tissue.


Conflict of interest statement

Declaration of interests T.G. is a shareholder of Westlake Omics Inc. Q.Z., W.G., and H.C. are employees of Westlake Omics Inc. The remaining authors declare no competing interests.

Figures

None
Graphical abstract
Figure 1
Figure 1
Multi-organ proteomic landscape of COVID-19 autopsies (A) The quantified and dysregulated proteins across multiple organs. The outermost (first) ring represents the type of samples. The number of samples and patients (n/N) is labeled respectively. The second ring (in blue) refers to the missing/undetected proteins for each organ. The numbers in black represent the quantified proteins in the specific organ. The third ring (in light green) refers to unregulated proteins. The numbers in white represent the significantly dysregulated proteins in specific organ type (B-H adjusted p value <0.05; |log2[fold change of COVID-19 versus non-COVID-19]| >log2[1.2]). The innermost ring refers to the number of significantly dysregulated proteins for each organ (pink, upregulated; dark green, downregulated). (B) Protein expression of CRP and CD163 across six organs (except testis). The y axis stands for the protein expression ratio by TMT-based quantitative proteomics. Pairwise comparison of each protein between COVID-19 and non-COVID-19 groups was performed with Student’s t test. The cutoff of dysregulated proteins has been set at B-H adjusted p value <0.05 and |log2(FC)| >log2(1.2). B-H adjusted p value: p < 0.05; ∗∗p < 0.01; ∗∗∗p < 0.001. See also Figure S1, Figure S2, and S3 and Tables S1, S2, S3, and S4
Figure S1
Figure S1
Comparison of histopathological features of organs between COVID-19 and non-COVID-19 patients (H&E ×200), related to Figure 1 The left column shows the results of the non-COVID-19 patients and the right part shows the results of the COVID-19 patients. A. Pathological features of lungs from the COVID-19 patients. (i) The lung showed diffuse alveolar damage, with the alveolar epithelia replaced by hyperplastic type II alveolar epithelia and falling of type II alveolar epithelia (a). Alveolar septa were thickened with the proliferation of fibroblasts/myofibroblasts and fibrosis (b). Fibrinous exudation and hyaline membrane formation (c) were observed, with neutrophils aggregation in the alveolar cavity (d). (ii) There were some microthrombus in small vessels of the lung (a), and megakaryocytes in the alveolar septal capillaries (b). B. Pathological findings of the spleen from COVID-19 patients. (i) The red pulp of the spleen expanded, and splenic sinus extended with hyperemia accompanying with macrophage proliferation. (ii) The white pulp of spleen exhibited atrophy with significantly reduced lymphocytes. C. Pathological findings of the liver from COVID-19 patients. (i) Coagulative necrosis of hepatocytes was observed in zone III. (ii) The hepatocytes exhibited prominent steatosis. D. Pathological findings of the heart from COVID-19 patients. (i) Atrophic myocardia and scant lymphocytes (a) were present in the edematous cardiac interstitium. (ii) The myocardium showed hydropic degenerative change. E. Pathological findings of the kidney from the COVID-19 patients. (i) In the renal cortex, the proximal tubules showed prominent acute tubule injury manifested as the loss of brush border and epithelial cells necrosis in the tubular lumens (a). Microthrombi in peritubular capillaries and glomeruli (b) were frequently observed. (ii) In the renal medulla, the collecting ducts showed occasional cellular swelling and atrophy (a), and edema without significant inflammation (b). F. Pathological findings of the thyroid from the COVID-19 patients. Lymphoid infiltration was found in some of interfollicular region. Neither neutrophilic infiltration nor necrosis was present.
Figure S2
Figure S2
Laboratory characteristics of multi-organ dysfunction and infection indicators with COVID-19, related to Figure 1 Boxplots display the blood biochemistry tests based on samples collected from the COVID-19 patients on the day of admission (red) and death (green). The dash line represents the normal range of laboratory characteristic. BNP, brain natriuretic peptide; CK-MB, creatine kinase-MB; ALB, albumin; ALT, alanine aminotransferase; AST, aspartate aminotransferase; LDH, lactate dehydrogenase; TBIL, total bilirubin; ALP, alkaline phosphatase; GGT, gamma-glutamyl transferase; WBC, white blood cells; PLT, platelets; RBC, red blood cells; BUN, blood urea nitrogen; PT, prothrombin time; APTT, activated partial thromboplastin time; INR, international normalized ratio; FIB, fibrinogen; TT, thrombin time; CRP, C-reactive protein; IL-6, interleukin-6.
Figure S3
Figure S3
Proteomic workflow and quality control of proteome data analysis, related to Figure 1 and STAR methods A. The workflow of TMT-labeling based quantitative proteomic analysis employed in our study. 288 peptide samples containing 37 technique replicates, 16 common pooled controls and 17 tissue specific pooled controls were distributed into 18 batches and analyzed by TMT 16-plex labeling based proteomics. FFPE, formalin-fixed and paraffin-embedded; PCT, pressure cycling technology; RP-LC, reversed phase liquid chromatography; LC-MS, liquid chromatography-mass spectrometry. B. The median CV of the proteomics data is calculated by the log2(abundance) of quantified proteins in the pooled controls of each organ. C. The median CV of the proteomics data is calculated by expression ratio of quantified proteins in the technique replicates of each organ. D. Heatmap of dysregulated proteins for lung (37 samples 1606 proteins), spleen (17 samples 1726 proteins), liver (36 samples 1969 proteins), heart (40 samples 919 proteins), renal cortex (32 samples 1585 proteins), renal medulla (29 samples 642 proteins) and thyroid (29 samples 1297 proteins) between the COVID-19 patients and non-COVID-19 groups were shown. E. The t-distributed stochastic neighbor embedding (t-SNE) visualization of significantly dysregulated proteins in multiorgan proteomes of the COVID-19 (triangle) and the non-COVID-19 (circle) patients. The color of triangle or circle represents the organ type. Note: The cutoff of dysregulated proteins has been set at B-H adjusted p value < 0.05 and |log2(FC)| > log2(1.2).
Figure 2
Figure 2
Six functional clusters of dysregulated proteins from seven organs between COVID-19 and non-COVID-19 patients (A) Counts of dysregulated proteins in six clusters of molecules, including potential virus receptors and proteases, fibrosis markers, cytokines (and their receptors), transcription factors (TFs), coagulation system, and angiogenesis-associated proteins are shown in a bar chart. Each column along y axis represents a type of organ. The number of proteins is shown in x axis. (B) Landscape of 5336 significantly dysregulated proteins in seven organs. The dysregulated proteins in the six clusters are labeled as circles (solid, upregulated proteins; hollow, downregulated proteins). The size of circle indicates |log2(FC)|. (C) Protein expression of potential virus receptors across multiple organs. The y axis stands for the protein expression ratio by TMT-based quantitative proteomics. Pairwise comparison of each protein between COVID-19 and non-COVID-19 groups was performed using Student’s t test. The cutoff of dysregulated proteins has been set at B-H adjusted p value <0.05 and |log2(FC)| >log2(1.2). B-H adjusted p value: p < 0.05; ∗∗p < 0.01; ∗∗∗p < 0.001. See also Figures S4 and S5 and Table S5.
Figure S4
Figure S4
Transcription factors and cytokines dysregulated in multiple organs, related to Figure 2 A. Circular heatmap of dysregulated transcription factors. The selected transcription factors with |log2(FC)| larger than |log2(1.5)| from dysregulated proteins are shown. Some of the transcription factors in specific tissue with the same trend of changes, and distinguished out by upstream analysis are highlighted in red frame with red and bold font. B. Pathway enrichment analysis of dysregulated transcription factors between the COVID-19 and non-COVID-19 groups. Reactome pathways were enriched by String. FDR: false discovery rate. C. The chord diagram shows the shared cytokines (and their receptors) dysregulated between COVID-19 and non-COVID-19 groups across multiple organs. The cutoff of dysregulated proteins has been set at B-H adjusted p value < 0.05 and |log2(FC)| > log2(1.2). The color of proteins represents the upregulation or downregulation pattern. The length of the brick for each protein corresponds to the sum of |log2(FC)| in multiple organs. The length of the brick for each organ corresponds to the sum of |log2(FC)| in one or more proteins. D. Pathway enrichment analysis of dysregulated cytokines. Gene ontology (GO) pathways were enriched by Metascape.
Figure 3
Figure 3
Coagulation, angiogenesis-associated proteins, and fibrosis markers regulated in multiple organs (A–C) Chord diagrams show dysregulated and multi-organ shared proteins in coagulation system (A), angiogenesis associated proteins (B), and potential fibrosis markers (C) between COVID-19 and non-COVID-19 patients across multiple organs. The cutoff of dysregulated proteins has been set at B-H adjusted p value <0.05 and |log2(FC)| >log2(1.2). The length of the brick for each protein corresponds to the sum of |log2(FC)| in multiple organs. The length of the brick for each organ corresponds to the sum of |log2(FC)| in one or more proteins. See also Figure S5.
Figure S5
Figure S5
The network of fibrosis associated proteins over four fibrosis stages in multiple organs, related to Figures 2 and 3 The network shows the interactions among 179 stage-specific dysregulated proteins between COVID-19 and non-COVID-19 groups in each organ over the four fibrosis stages: initiation (green), inflammation (blue), proliferation (orange), and modification (red). The network analysis was performed using String and Cytoscape. The size of the dot represents the value of |log2(FC)|. Note: The cutoff of dysregulated proteins has been set at B-H adjusted p value < 0.05 and |log2(FC)| > log2(1.2).
Figure 4
Figure 4
Dysregulated pathways in multiple organs (A) The top pathways dysregulated across multiple organs. Pathway analysis was performed using all dysregulated proteins in the specific organ using IPA. The size of circle represents the -log10(p value) and the color represents the Z score by IPA. (B) The pathways enriched by Metascape for translation initiation relating proteins that are differentially expressed only in lung or liver, respectively. (C) Translation-associated pathway comparison across multiple organs. The size of circle represents the -log10(P) and the color represents the Z score by IPA. (D) Heatmap of SARS-CoV-2 interacting proteins dysregulated in the lung. The significance (“Sig.” as the short term in figures) was calculated using Student’s t test. B-H adjusted p value: p < 0.05; ∗∗p < 0.01; ∗∗∗p < 0.001. The cutoff of dysregulated proteins has been set at B-H adjusted p value <0.05 and |log2(FC)| >log2(1.2). See also Figure S7 and Table S6.
Figure 6
Figure 6
Dysregulated proteins and networks in six organs (A) Significantly enriched networks from the dysregulated proteins in the six organs. Each protein is depicted with radar chart for the six organs. Different organs are labeled with different colors. The shadow area covering the circles indicates the FC values for each protein. (B) A hypothetical systems view of the multiple organs’ responses to SARS-CoV-2 infection. In the lung, the virus and its released RNA could induce immune response and hijack the host translation mechanism. The innate and adaptive immune cells in the spleen and the cytokine induce acute phase proteins secreted by hepatic cells in response to antiviral defense. Such hyperinflammatory status across the whole body through circulatory system leads to multi-organ injuries. Red boxes, upregulated proteins/pathways; green boxes, downregulated proteins/pathways; blue boxes, pathological processes. See also Figures S6 and S7.
Figure 5
Figure 5
The heatmap of key dysregulated proteins in the lung, spleen, and liver, respectively (A) The heatmap of key proteins in associated pathways in the lung and spleen. (B) The heatmap of key proteins in associated pathways in the liver. The significance (Sig.) of them in lung, spleen, and liver was calculated using Student’s t test. B-H adjusted p value: p < 0.05; ∗∗p < 0.01; ∗∗∗p < 0.001. See also Figure S6.
Figure S6
Figure S6
Representative images of immunohistochemical staining for immune cells in the spleen of COVID-19 and non-COVID-19 patients, related to Figures 5 and 6 White pulp and red pulp samples were from patient P1 (COVID-19) and patient C57 (non-COVID-19), respectively. The multiple markers for various immune cells in the spleen samples using IHC including CD3 for total T cell, CD4 for CD4 positive T cell, CD8 for CD8 positive T cell, CD20 for B cell, CD68 for macrophage and CD163 for M2 macrophage were shown.
Figure S7
Figure S7
The key dysregulated proteins in the heart, renal cortex, renal medulla, and thyroid associated with the enriched pathways by IPA, related to Figures 4 and 6 The heatmap of key proteins in associated pathways in the heart (A), renal cortex (B), renal medulla (B), and thyroid (C). The significance (Sig.) of them in each type of organ was calculated using Student’s t test (B-H adjusted p value: , < 0.05; ∗∗, < 0.01; ∗∗∗ < 0.001).
Figure 7
Figure 7
Proteomic and histopathological characterization of COVID-19 testes and dysregulated proteins in the COVID-19 patients with CHD (A) The heatmap of ten dysregulated proteins between COVID-19 and control testes. Pairwise comparison of each protein between COVID-19 and non-COVID-19 groups was performed with Student’s t test. B-H adjusted p value: p < 0.05; ∗∗p < 0.01. (B) The H&E staining of testis from a non-COVID-19 patient. Seminiferous tubules at high power (×200) showed normal spermatogenesis. Clusters of Leydig cells were seen in the interstitium (a). (C) The H&E staining of testis from a COVID-19 patient. In the COVID-19 testes, seminiferous tubules at high power (×200) showed decreased number of Leydig cells in the interstitium (a) and sparse intratubular cells with swollen and vacuolated Sertoli cells (b). (D) Diagram of the pathology in the COVID-19 testis with seven dysregulated proteins. The green boxes with black text font inside show the downregulated proteins. The downregulation pathway is in the green box with white text font. (E) The top enriched pathways by upregulated proteins in the lung of COVID-19 patients with CHD. (F) Dysregulated proteins in RIG-I signaling pathway in the lung. The y axis stands for the protein expression ratio by TMT-based quantitative proteomics. Pairwise comparison of each protein among the non-COVID-19, COVID-19 patients with CHD, and without CHD groups was performed using Student’s t test. The cutoff of dysregulated proteins has been set at B-H adjusted p value <0.05 and |log2(FC)| > log2(1.2). p < 0.05; ∗∗p < 0.01; ∗∗∗p < 0.001. See also Table S6.

References

    1. Ackermann M., Verleden S.E., Kuehnel M., Haverich A., Welte T., Laenger F., Vanstapel A., Werlein C., Stark H., Tzankov A., et al. Pulmonary Vascular Endothelialitis, Thrombosis, and Angiogenesis in Covid-19. N. Engl. J. Med. 2020;383:120–128. - PMC - PubMed
    1. Adams J.C., Lawler J. The thrombospondins. Cold Spring Harb. Perspect. Biol. 2011;3:a009712. - PMC - PubMed
    1. Alonzi T., Maritano D., Gorgoni B., Rizzuto G., Libert C., Poli V. Essential role of STAT3 in the control of the acute-phase response as revealed by inducible gene inactivation [correction of activation] in the liver. Mol. Cell. Biol. 2001;21:1621–1632. - PMC - PubMed
    1. Babeu J.P., Boudreau F. Hepatocyte nuclear factor 4-alpha involvement in liver and intestinal inflammatory networks. World J. Gastroenterol. 2014;20:22–30. - PMC - PubMed
    1. Bao L., Deng W., Huang B., Gao H., Liu J., Ren L., Wei Q., Yu P., Xu Y., Qi F., et al. The pathogenicity of SARS-CoV-2 in hACE2 transgenic mice. Nature. 2020;583:830–833. - PubMed

Publication types