Review
. 2021 Jan 25;22(3):1151.
doi: 10.3390/ijms22031151.

Contributions of Flow Cytometry to the Molecular Study of Spermatogenesis in Mammals

Affiliations
Review

Contributions of Flow Cytometry to the Molecular Study of Spermatogenesis in Mammals

Rosana Rodríguez-Casuriaga et al. Int J Mol Sci. .

Abstract

Mammalian testes are very heterogeneous organs, with a high number of different cell types. Testicular heterogeneity, together with the lack of reliable in vitro culture systems of spermatogenic cells, have been an obstacle for the characterization of the molecular bases of the unique events that take place along the different spermatogenic stages. In this context, flow cytometry has become an invaluable tool for the analysis of testicular heterogeneity, and for the purification of stage-specific spermatogenic cell populations, both for basic research and for clinical applications. In this review, we highlight the importance of flow cytometry for the advances on the knowledge of the molecular groundwork of spermatogenesis in mammals. Moreover, we provide examples of different approaches to the study of spermatogenesis that have benefited from flow cytometry, including the characterization of mutant phenotypes, transcriptomics, epigenetic and genome-wide chromatin studies, and the attempts to establish cell culture systems for research and/or clinical aims such as infertility treatment.

Keywords: FACS; flow cytometry; male infertility; spermatogenesis.


Conflict of interest statement

The authors declare no conflict of interest.

Figures

Figure 1
Figure 1
Schematic representation of the different germ cell stages along spermatogenesis of the rat. The three main phases of the spermatogenic process are indicated. Asingle, A single spermatogonium; Apr, A paired spermatogonia; Aal, A aligned spermatogonia; A1–A4, type A spermatogonia 1–4; Ain, intermediate spermatogonia; B, type B spermatogonia; PL, pre-leptotene spermatocytes; L, leptotene spermatocyte; Z, zygotene spermatocyte; eP, early pachytene spermatocyte; mP, medium pachytene spermatocyte; lP, late pachytene spermatocyte; D, diplotene spermatocyte; II, secondary spermatocyte; rST, round spermatids; eST, elongating spermatids; RB, residual body. In the proliferative phase, the numbers of spermatogonia derived from an A single are indicated in parenthesis.
Figure 2
Figure 2
FCM analysis of mouse testicular cell suspensions employing two different DNA dyes. (A) Representative Hoechst 33342 (Ho342) FCM profile obtained from the analysis of adult mouse testis, based on emitted blue and red fluorescence. The various spermatogenic cell populations that can be distinguished, and are indicated, are: spermatogonia (Sp), pre-leptotene (pL), leptotene–zygotene (L/Z), pachytene (P), diplotene (D), and round spermatids (RS). This image is reproduced from reference [51] with permission of J. Vis. Exp. (B) Representative FCM profiles from the analysis of a 22-day-old mouse testicular cell suspension stained with Vybrant DyeCycle Green (VDG). A Forward Scatter vs. FL1-Area (VDG fluorescence intensity) dot plot and its corresponding histogram are shown. Histogram peaks corresponding to C, 2C and 4C cell populations, and sorting gates within the 4C population (delimited in red) in the dot plot, are indicated. Note the absence of the apparently sub-haploid peak in the histogram, as the profile is from a juvenile animal. Examples of immunolocalizations of SYCP3 (synaptonemal complex (SC) protein 3, a lateral-element–SC component) on cellular spreads from sorted cells, in order to confirm the purity of the sorted fractions, are shown below. As can be seen, cells coming from the selected gates correspond to different stages of the first meiotic prophase: L/Z, in which simple axes (L) and short stretches of SCs (Z) are present; or P/D with completely assembled (P), or disassembling (D) SCs. Bars correspond to 10 µm.
Figure 3
Figure 3
Spermatogenesis advance during postnatal testis development in guinea pig, followed through FCM. Representative profiles for selected ages indicated as days postpartum (dpp) are shown. Histograms correspond to propidium iodide (PI) fluorescence intensity, and dot plots depict 90-degree scatter (side scatter) vs. PI fluorescence intensity. Spermatogenesis progress in maturing specimens is visualized through variations in the cell populations, according to their DNA content. Note the increased frequency of 4C cells as meiosis progresses (6–32 dpp). Similarly, at 32 days after birth, the initiation of spermiogenesis is evidenced through the appearance of the first cells with C DNA content (arrowheads). Note the presence of an apparently sub-haploid peak (asterisk) at 45 dpp, corresponding to advanced elongated spermatids and sperm. This figure is reproduced from reference [21] with permission of John Wiley & Sons; permission conveyed through Copyright Clearance Center, Inc.; license number 4963790779747.
Figure 4
Figure 4
Representative FCM profiles of testicular biopsy samples from control and azoospermic patients. The testicular tissue samples were digested with collagenase and the resulting cell suspensions were fixed with 70% ethanol, stained with PI, and analyzed by FCM [64]. Obstructive azoospermia patients rendered FCM histograms undistinguishable from those of healthy control individuals, exhibiting C, 2C and 4C populations, as well as the typical apparently sub-haploid peak (asterisk) that would correspond to sperm. Non-obstructive azoospermia (NOA) patients exhibited profoundly altered FCM profiles, evidencing incomplete spermatogenesis. These analyses were also informative on the stage when the detention occurred, as NOA samples with meiotic arrest lacked the C population but presented the 2C and 4C populations, while NOA patients with pre-meiotic arrest only exhibited the 2C population. In the latter, a minimal 4C peak that would correspond to G2 stage spermatogonia could be also observed (arrowhead). The figure is reproduced from [64], under the Creative Commons Attribution License.
Figure 5
Figure 5
Sperm DNA integrity assessment by terminal deoxynucleotidyl transferase (TdT) mediated dUTP nick end labeling (TUNEL). (A) Diagram showing staining of sperm DNA for detection of DNA breaks employing the TUNEL assay. This figure is reproduced from reference [70], under the Creative Commons Attribution License. (B) TUNEL assay of spermatozoa analyzed by FCM. Forward light scattering (FSC) vs. SSC dot plots are represented in the top. The gates indicate the selected events for subsequent fluorescein isothiocyanate (FITC) analysis. In the bottom, frequency distribution histograms (number of events vs. FITC fluorescence intensity) of spermatozoa stained with TUNEL are shown. Negative (omitting the TdT enzyme) and positive (spermatozoa treated with DNAse I) controls were employed. The horizontal line (M1) indicates spermatozoa that are positive for the TUNEL technique, and it was adjusted arbitrarily to obtain about 1% TUNEL-positive events in the negative control. The positive control presented 98.48% TUNEL-positive sperm. Two examples of patient samples are shown. Sample from patient 1 presented a high level of TUNEL-positive cells (40.99%), while patient 2 sample exhibited a low proportion of TUNEL-positive cells (9.86%). (This figure is republished with permission of John Wiley and Sons from reference [67]; permission conveyed through Copyright Clearance Center, Inc.; license number 4977690417168).
Figure 6
Figure 6
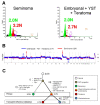
FCM profiling of testicular germ cell tumors. (A) DNA content FCM analysis and sorting of aneuploid (3.2N, 2.7N) and diploid (2.0N) populations from primary formalin-fixed paraffin-embedded tissues of a single patient. The histology of each biopsy is specified. Sorted cell populations were subsequently employed in whole genome copy number studies as exemplified in (B), and in whole exome sequencing for mutation analyses. Copy number aberrations: gains (+) and deletions (–), are indicated by arrows. (C) Establishment of cell lineage of metastatic testicular germ cell tumor (TGCT) through the identified genomic aberrations within primary and refractory metastatic TGCT. This figure is reproduced from reference [78], under the Creative Commons Attribution License.
Figure 7
Figure 7
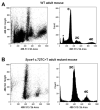
FCM analysis of VDG-stained testicular cell suspensions from adult WT and Syce1 c.727C > T mutant mice. FCM profiles obtained for testis from WT mice (A) and mutant littermates (B) are shown. Peaks pertaining to C, 2C and 4C cell populations, as well as the apparently sub-haploid peak corresponding to sperm (asterisk), are indicated. Note the absence of cells with C DNA content and the poorly populated 4C cell population in the mutant profiles, indicating an arrest of the spermatogenic process at early stages of first meiotic prophase, in accordance with the characterization of this mutant phenotype as recently reported [81].
Figure 8
Figure 8
Pioneer study of massive gene expression along mouse spermatogenesis employing flow-sorted populations and microarrays. The authors [37] focused on the dynamics of gene expression along meiosis by purifying and profiling different stages of primary spermatocytes, as well as premeiotic cells and postmeiotic round spermatids. (A) FCM analyses and sorting were performed on Ho342-stained testicular cell suspensions based on their blue/red differential fluorescence, as shown in the dot plot. Sp, spermatogonia; pL, pre-leptotene spermatocytes; L/Z, leptotene/zygotene spermatocytes; eP, early pachytene spermatocytes; mP, medium pachytene spermatocytes; lP, late pachytene spermatocytes; D, diplotene spermatocytes; RS, round spermatids. (B) Heatmap representing expression levels of different gene sets along spermatogenesis. Each horizontal line corresponds to a probe set with yellow and blue indicating normalized high and low expression, respectively. The probe sets employed in this study are indicated on the right. The image is reproduced from reference [37], under the Creative Commons Attribution License.
Figure 9
Figure 9
Combination of fluorescence activated cell sorting (FACS) with antibody labeling for the isolation of cell types not distinguishable in FCM profiles by sole multi-parametric analysis. Two examples are shown. (A) Isolation of undifferentiated germ cells from neonatal mouse testes, employing Oct4-Gfp transgenic mice and antibody labeling against KIT. A sorting strategy for undifferentiated germ cells (Oct4-GFP+/KIT-) by serial gating is shown. This figure is republished with permission of The Company of Biologists Ltd. from reference [113]; permission conveyed through Copyright Clearance Center, Inc.; license ID 1079949-1. (B) Purification of spermatogonia from adult human testes, employing FCM and antibody labeling. Sorting strategy for cells with the phenotype HLA-ABC-/CD49e-/THY1dim/ITGA6+/EpCAMdim that corresponds to undifferentiated spermatogonia, is shown. Republished with permission of Elsevier from reference [105]; permission conveyed through Copyright Clearance Center, Inc.; license number 4964010165763. In both examples (A,B), the isolated cells were subsequently employed for single-cell RNAseq (scRNAseq).
Figure 10
Figure 10
Example of employment of FACS-purified mouse spermatogenic stages in chromatin conformation studies. (A) Gating strategy applied to obtain L/Z (DMC1+/SYCP3+) and P/D (DMC1-/SYCP3+) stages with no cross contamination, based on re-gating the 4C population, and specific antibody labeling. The DMC1-/SYCP3- population would represent non-meiotic cells with 4C DNA content (i.e., mainly G2 phase spermatogonia). The third and fourth graphs show the gating strategy utilized to obtain separate populations of round spermatids and spermatozoa, based on re-gating the C population, and observing the FSC and SSC parameters. (B) Dot plot showing the purified populations that were employed in downstream chromatin conformation studies. Spg, spermatogonia; L/Z, leptotene/zygotene spermatocytes; P/D, pachytene/diplotene spermatocytes; RS, round spermatids. (C) Identity confirmation of the classified cells by cytomorphological analyses and/or immunolabeling. Fibroblasts and Spg have DAPI-stained DNA shown in gray. For L/Z and P/D, DAPI is shown in blue, SYCP3 in green, and γH2AX in red. In RSs, DAPI is shown in blue, and H3K9me3 (marker for the constitutive heterochromatin at centromeres–chromocenters) is red. Scale bars represent 10 µm. (D) Hi-C matrices for chromosome 15 at a 50-kbp resolution for the cell types analyzed. A mouse primary fibroblast cell line was employed as somatic cell control. Deep blue lines indicate non-mapped bins. The differences in the resulting Hi-C matrices evidence genome organization changes during spermatogenesis. This figure is modified from reference [44], under the Creative Commons Attribution License.
Figure 11
Figure 11
Comparison of FCM profiles for unsynchronized and synchronized mouse testes. (A) FCM Ho342 profile for normal, unsynchronized mouse spermatogenesis. SP: spermatogonia; 4C: primary spermatocytes; 1C: spermatids. (B) FCM profiles for mouse testes synchronized by the WIN18,446/RA method. Analyses performed at 25 and 30 days post-RA-injection (dpi) are shown. Note the well separated and densely populated 4C regions, compared to the unsynchronized testis. (C) Samples of FACS-sorted cells were employed for immunolocalizations on chromosome spreads, employing antibodies against SYCP3 and H1T (an H1 histone isoform present in P spermatocytes) for stage assessment. Scale bars correspond to 10 µm. Cells coming from the indicated regions were purified by FACS for downstream studies on chromatin organization dynamics during meiosis (Reprinted with permission from Springer Nature from reference [134]; license number: 4964911245305).
Figure 12
Figure 12
Leukemia incidence assessment after transplantation of SSC to mice with azoospermia. The authors [156] established a B cell acute lymphocytic testicular leukemia (BALL) model in mice by injection of human BALL cells. Three SSC purification groups were compared, consisting of SSCs that had been isolated and purified from the BALL model mice through either: density gradient centrifugation (DGU), flow cytometry sorting (FCMS), or immunomagnetic bead-based (MACS) sorting. In the DGU group, a large number of BALL cells (CD20+) could be detected in the blood of recipient busulfan-treated azoospermic mice 2–3 weeks after transplantation (arrowhead). Quite differently, transplantation of SSCs purified by FCMS or MACS successfully restored spermatogenesis with no incidence of leukemia after 16 weeks of observation (no BALL cells were detected in the blood of recipient mice by FCM), indicating that these two methods of purifying SSCs from the testicular tissue of the testicular leukemia mouse model could be safely applied to the SSC transplantation technology, without concomitant tumor implantation. This figure is reproduced from reference [156], under the Creative Commons Attribution License.

Similar articles

Cited by

References

    1. Hess R.A., de Franca L.R. Spermatogenesis and cycle of the seminiferous epithelium. Adv. Exp. Med. Biol. 2008;636:1–15. doi: 10.1007/978-0-387-09597-4_1. - DOI - PubMed
    1. De Rooij D.G., Griswold D.K.M. Questions about spermatogonia posed and answered since 2000. J. Androl. 2012;33:1085–1995. doi: 10.2164/jandrol.112.016832. - DOI - PubMed
    1. Fraune J., Schramm S., Alsheimer M., Benavente R. The mammalian synaptonemal complex: Protein components, assembly and role in meiotic recombination. Exp. Cell Res. 2012;318:1340–1346. doi: 10.1016/j.yexcr.2012.02.018. - DOI - PubMed
    1. Bolcun-Filas E., Ann Handel M. Meiosis: The chromosomal foundation of reproduction. Biol. Reprod. 2018;99:112–126. doi: 10.1093/biolre/ioy021. - DOI - PubMed
    1. Cobb J., Handel M.A. Dynamics of meiotic prophase I during spermatogenesis: From pairing to division. Semin. Cell Dev. Biol. 1998;9:445–450. doi: 10.1006/scdb.1998.0202. - DOI - PubMed

LinkOut - more resources