. 2021 Jan 25;22(3):1153.
doi: 10.3390/ijms22031153.

Estrogen Receptor Signaling Pathways Involved in Invasion and Colony Formation of Androgen-Independent Prostate Cancer Cells PC-3

Affiliations

Estrogen Receptor Signaling Pathways Involved in Invasion and Colony Formation of Androgen-Independent Prostate Cancer Cells PC-3

Ana Paola G Lombardi et al. Int J Mol Sci. .

Abstract

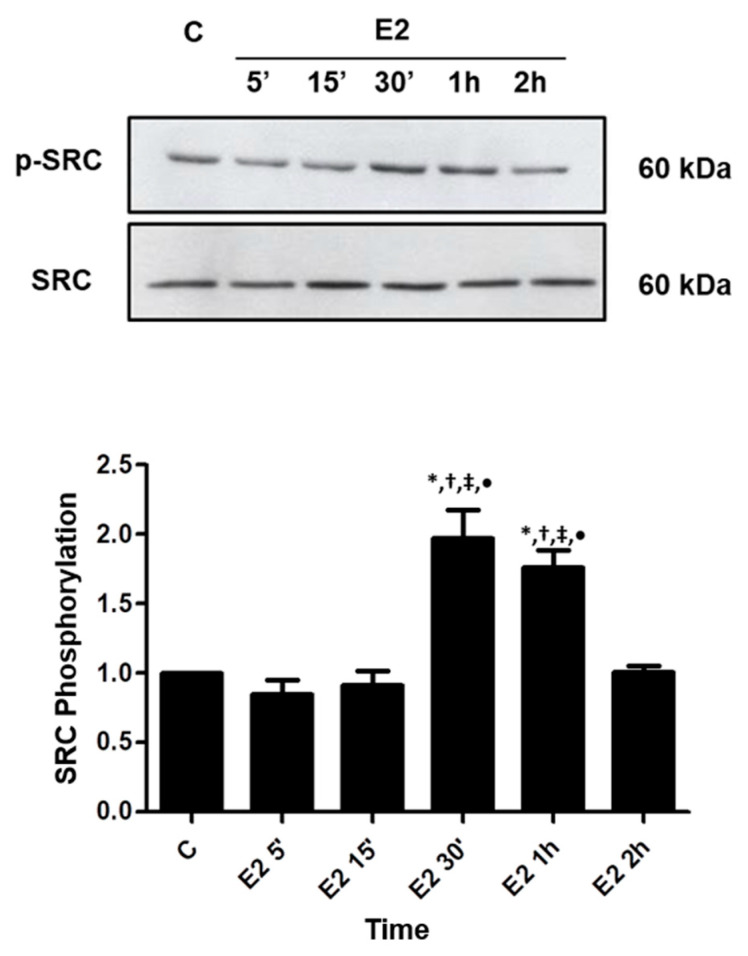
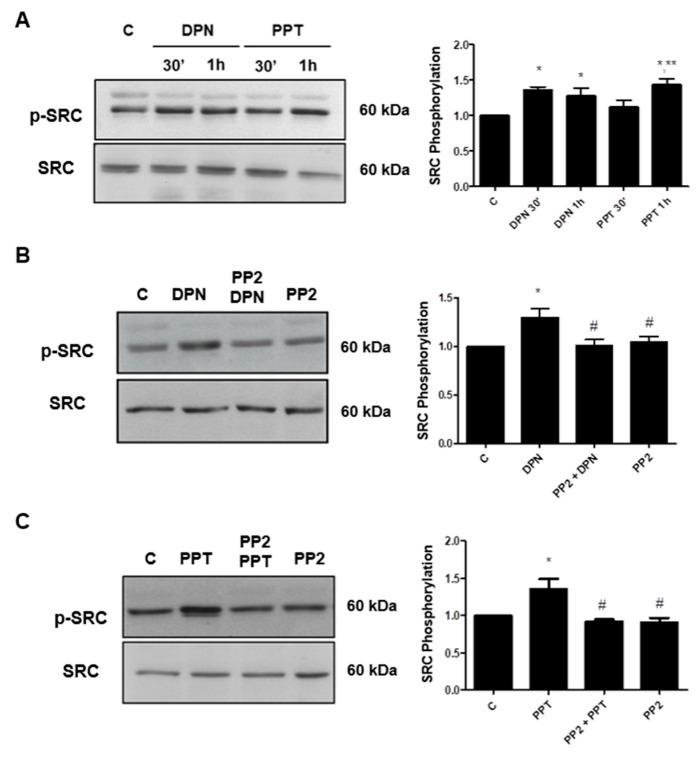
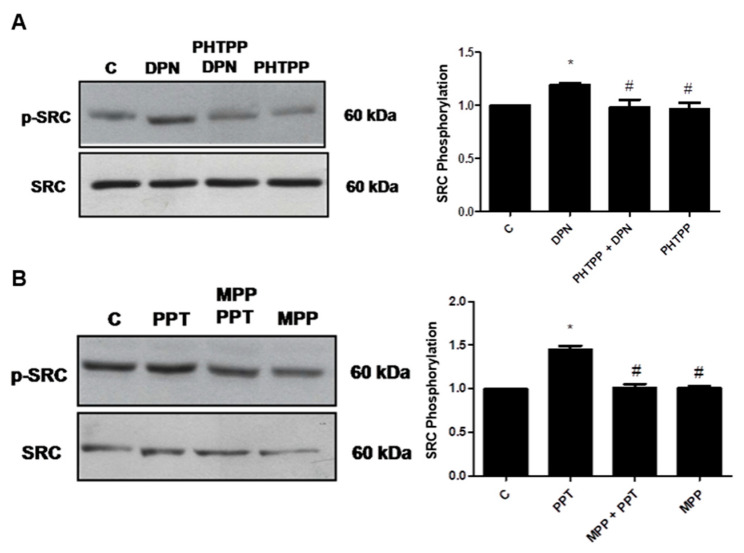
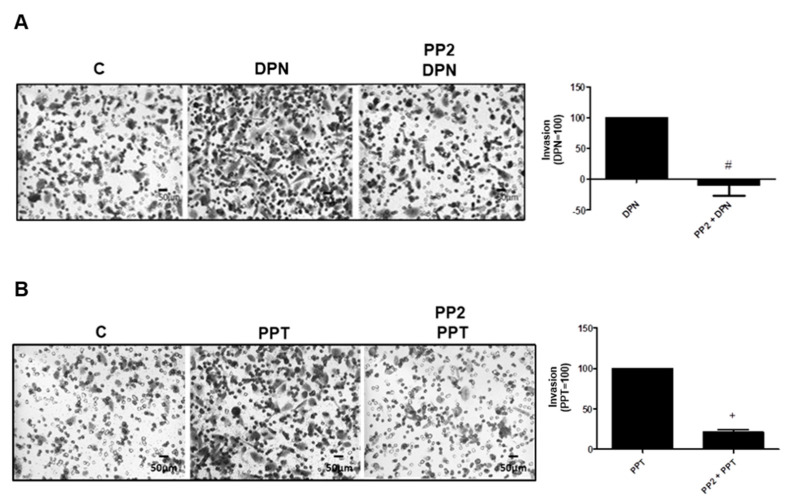
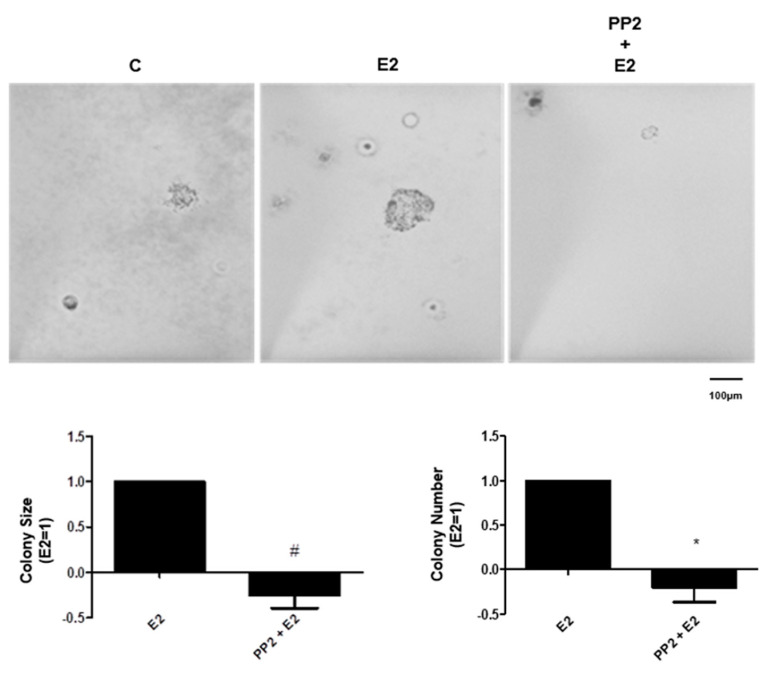
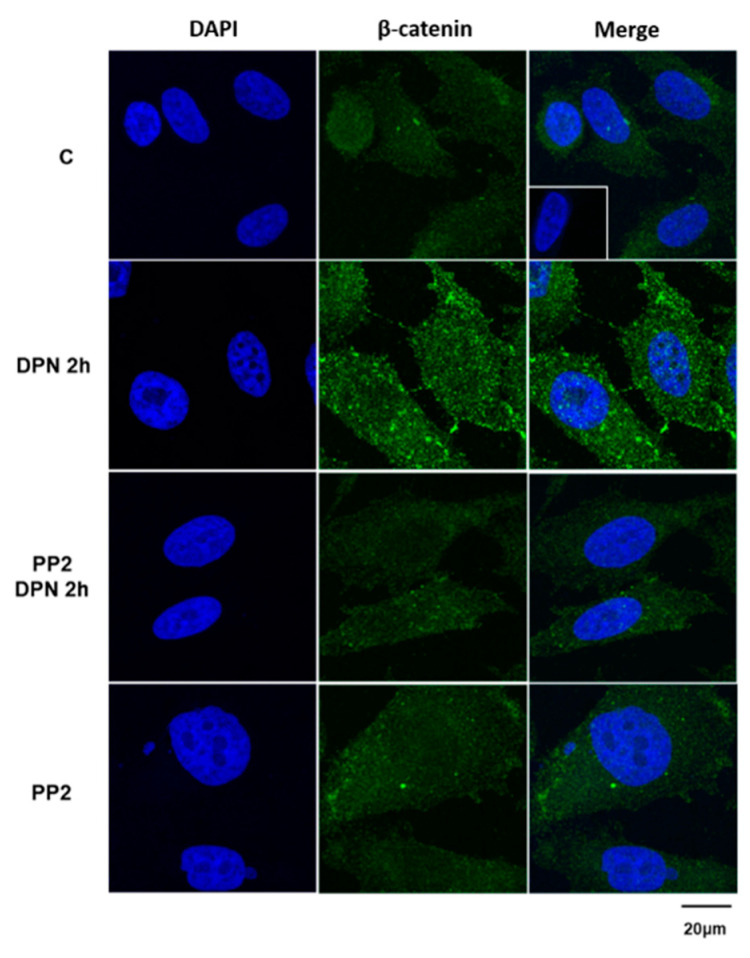
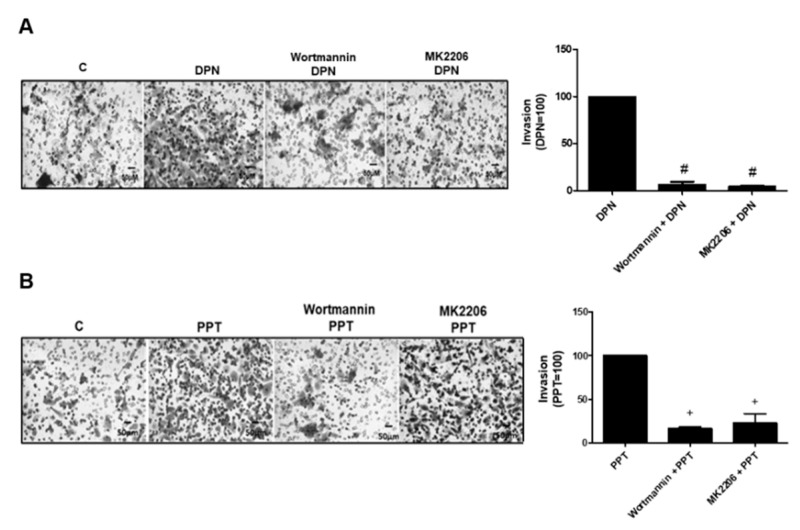
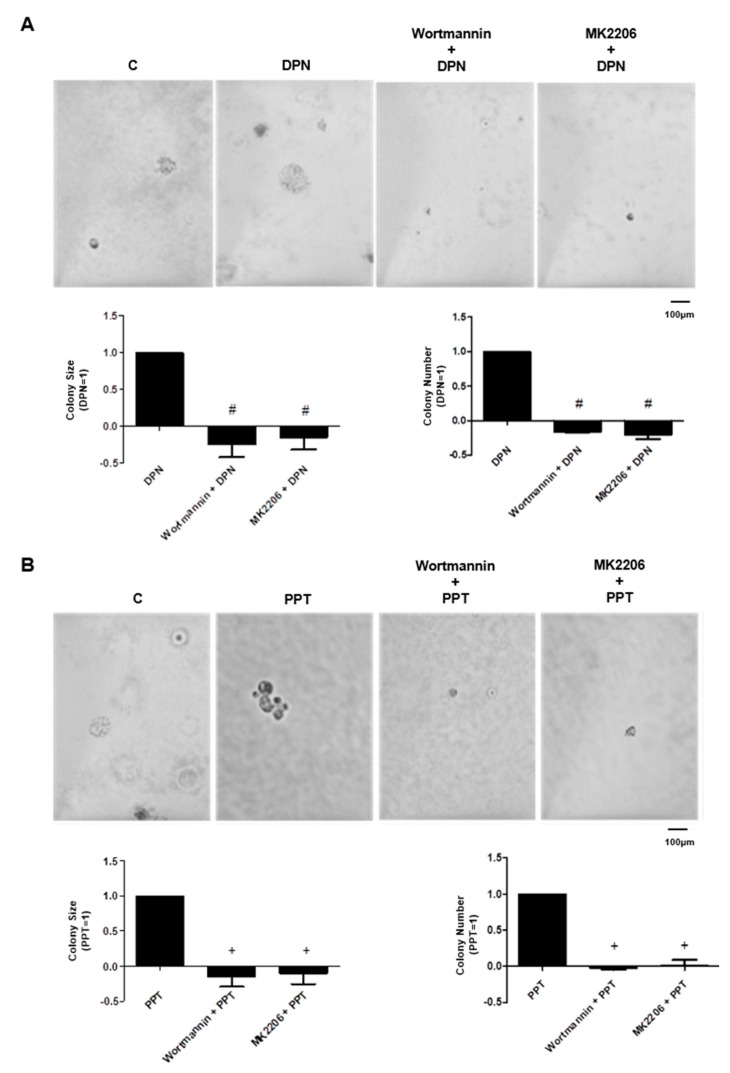
Castration-resistant prostate cancer (CRPC) is an advanced and androgen-independent form of prostate cancer. Recent studies of rapid actions mediated by estrogen in the prostate and its relationship with CRPC are emerging. We have previously shown that estrogen receptor (ER) promotes migration and invasion of the androgen-independent prostate cancer cells PC-3, but the signaling pathways involved in these events remain to be elucidated. Therefore, this study aimed to analyze the role of ERα and ERβ in the activation of SRC, and the involvement of SRC and PI3K/AKT on invasion and colony formation of the PC-3 cells. Our results showed that the activation of ERα (using ERα-selective agonist PPT) and ERβ (using ERβ-selective agonist DPN) increased phosphorylation of SRC in PC-3 cells. In the presence of the selective inhibitor for SRC-family kinases PP2, the effects of DPN and PPT on transmigration and soft agar colony formation assays were decreased. Furthermore, SRC is involved in the expression of the non-phosphorylated β-catenin. Finally, using PI3K specific inhibitor Wortmannin and AKT inhibitor MK2206, we showed that PI3K/AKT are also required for invasion and colony formation of PC-3 cells simulated by ER. This study provides novel insights into molecular mechanisms of ER in PC-3 cells by demonstrating that ER, located outside the cell nucleus, activates rapid responses molecules, including SRC and PI3K/AKT, which enhance the tumorigenic potential of prostate cancer cells, increasing cell proliferation, migration, invasion, and tumor formation.

Keywords: PC-3 cells; PI3K/AKT; SRC; estrogen receptor; β-catenin.


Conflict of interest statement

The authors declare no conflict of interest.

Figures

Figure 1
Figure 1
Effects of 17β-estradiol (E2) on SRC (Tyr419) phosphorylation in androgen-independent prostate cancer cells PC-3. The cells were incubated in the absence (C, control) and presence of E2 (10 nM) for 5, 15, 30 min, 1 and 2 h at 37 °C. Phosphorylated SRC (p-SRC) and total SRC were detected by Western Blot. The immunoassay was performed with anti-phosphorylated SRC (upper panel) and anti-total SRC antibodies (lower panel). The relative position of SRC was determined from the molecular weight standard. The data shown are representative of three independent experiments. Densitometric analysis was performed of the results obtained from each band, normalized by the expression of the total SRC and expressed in relation to the control (C = 1). Results were plotted (mean ± SEM) of three independent experiments. * Significantly different from the values obtained in relation to the control (C) (p < 0.05, ANOVA and Newman-Keuls). † Significantly different from E2 5 min (p < 0.05, ANOVA and Newman-Keuls). ‡ Significantly different from E2 15 min (p < 0.05, ANOVA and Newman-Keuls). • Significantly different from E2 2 h (p < 0.05, ANOVA and Newman-Keuls).
Figure 2
Figure 2
Effects of ERβ- (DPN) or ERα-selective agonists (PPT) on SRC (Tyr419) phosphorylation in androgen-independent prostate cancer cells PC-3. The cells were incubated in the absence (C, control) and presence of DPN or PPT (10 nM) for 30 min and 1 h at 37 °C (A). The cells were incubated in the absence (C, control) and presence of DPN (10 nM) for 30 min (B) or PPT (10 nM) (C) for 1 h. The cells were also pre-treated with the selective inhibitor for SRC-family kinases (PP2 5 nM, 30 min) and then incubated or not with DPN for 30 min (B) or PPT for 1 h (C). Phosphorylated SRC (p-SRC) and total SRC were detected by Western Blot. The immunoassay was performed with anti-phosphorylated SRC (upper panel) and total anti-SRC antibodies (lower panel). The relative position of SRC was determined from the molecular weight standard. The data shown are representative of four to six independent experiments. Densitometric analysis was performed of the results obtained from each band, normalized by the expression of the total SRC and expressed in relation to the control (C = 1). Results were plotted (mean ± SEM) of four to six independent experiments. * Significantly different from control (C) (p < 0.05, ANOVA and Newman-Keuls). ** Significantly different from PPT 30 min (p < 0.05, ANOVA and Newman-Keuls). # Significantly different from DPN for 30 min or PPT for 1 h (p < 0.05, ANOVA and Newman-Keuls).
Figure 3
Figure 3
Effects of ERβ- (PHTTP) or ERα-selective antagonists (MPP) on SRC (Tyr419) expression and phosphorylation in androgen-independent prostate cancer cells PC-3 induced by DPN or PPT. The cells were incubated in the absence (C, control) and presence of DPN (10 nM) for 30 min (A) or PPT (10 nM) for 1 h (B) at 37 °C. The cells were also pre-treated with PHTPP (10 nM) (A) or MPP (10 nM) (B) for 30 min, and then incubated or not, respectively, with DPN for 30 min (A) or PPT for 1 h (B). Phosphorylated SRC (p-SRC) and total SRC were detected by Western Blot. The immunoassay was performed with anti-phosphorylated SRC (upper panel) and anti-total SRC antibodies (lower panel). The relative position of SRC was determined from the molecular weight standard. The data shown are representative of three independent experiments. Densitometric analysis was performed of the results obtained from each band, normalized by the expression of the total SRC and expressed in relation to the control (C = 1). Results were plotted (mean ± SEM) of three independent experiments. * Significantly different from control (C) (p < 0.05, ANOVA and Newman-Keuls). # Significantly different from DPN for 30 min or PPT for 1 h (p < 0.05, ANOVA and Newman-Keuls).
Figure 4
Figure 4
Effects of the selective inhibitor for SRC-family kinases (PP2) on the invasion of androgen-independent prostate cancer cells PC-3 induced by DPN and PPT. Cells were incubated in the absence (C, control) and in the presence of DPN (10 nM) (A) or PPT (10 nM) (B) for 48 h at 37 °C. The cells were pre-treated with PP2 (5 nM) for 30 min and then incubated or not with the DPN (A) or PPT (B) for 48 h. The membranes containing the invaded cells (under the surface of membrane), were photographed. Images of three random microscope fields, in duplicate, were captured using an inverted optical microscope. The areas of invaded cells were determined by Image J software. Results were plotted (mean ± SEM of three independent experiments) in relation to the DPN or PPT subtracted from the control (DPN = 100) (A) or (PPT = 100) (B). # Significantly different from DPN (p < 0.05, Student t-test). + Significantly different from PPT (p < 0.05, Student t-test). Images are representative of three different experiments.
Figure 5
Figure 5
Effects of the selective inhibitor for SRC-family kinases (PP2) on size and number of the colony formed by androgen-independent prostate cancer cells PC-3 induced by 17β-estradiol (E2). Cells were incubated in the absence (C, control) and in the presence of 17β-estradiol (10 nM) for 3 weeks at 37 °C. The cells were also pre-treated with PP2 (5 nM) for 30 min and then incubated or not with E2. Representative image of PC-3 cell colony formation assays. The images were acquired, and the area of each colony was measured by the Image J software, and then the values obtained were expressed in relation to E2 and subtracted from the control (E2 = 1). The colonies were also counted with Zen software and the values of the number of colonies were expression in relation to E2 and subtracted from the control (E2 = 1). Results are expressed as (mean ± SEM) of three independent experiments. # Significantly different from E2 (p < 0.05, Student t-test) by #, * Significantly different from E2 (p < 0.05, Student t-test).
Figure 6
Figure 6
Effects of the selective inhibitor for SRC-family kinases (PP2) on the expression of non-phosphorylated β-catenin in androgen-independent prostate cancer cells PC-3 induced by DPN. Cells were incubated in the absence (C, control) and in the presence of DPN (10 nM) for 2 h at 37 °C. The cells were also pre-treated with PP2 (5 nM) for 30 min and then incubated or not with the DPN for 2 h. Positive immunostaining for non-phosphorylated β-catenin (green) was detected using the polyclonal antibody produced in rabbit by immunization with the synthetic peptide corresponding to the region around Serine 37 (Ser33/37/Thr41) of human β-catenin. Nuclei were stained with DAPI (blue). Negative control, in the absence of the primary antibody (detail). Results are representative of four independent experiments.
Figure 7
Figure 7
Effects of the PI3K specific inhibitor (Wortmannin) and AKT inhibitor (MK2206) on the invasion of androgen-independent prostate cancer cells PC-3 induced by DPN and PPT. Cells were incubated in the absence (C, control) and presence of DPN (10 nM) (A) or PPT (10 nM) (B) for 48 h at 37 °C. The cells were pre-treated with Wortmannin (1 µM) or MK2206 (200 nM) for 30 min, and then incubated or not with DPN (A) or PPT (B) for 48 h. Representative image of PC-3 cell invasion. The membranes containing the invaded cells (under the surface of membrane), were photographed. Images of three random microscope fields, in duplicate, were captured using an inverted optical microscope. The areas of invaded cells were determined by Image J software. Results were plotted (mean ± SEM) in relation to DPN or PPT and subtracted from the control (DPN = 100) (A) or PPT = 100) (B). # Significantly different from DPN (p < 0.05, ANOVA and Newman-Keuls). + Significantly different from PPT (p < 0.05, ANOVA and Newman-Keuls). Images are representative of three different experiments.
Figure 8
Figure 8
Effects of the PI3K specific inhibitors (Wortmannin) and AKT inhibitor (MK2206) on size and number of the colony formed by androgen-independent prostate cancer cells PC3 induced by DPN or PPT. Cells were incubated in the absence (C, control) and presence of DPN (10 nM) (A) and PPT (10 nM) (B) for 3 weeks at 37 °C. The cells were also pre-treated with Wortmannin (1 μM) or MK2206 (200 nM) for 30 min, and then incubated or not with DPN (A) or PPT (B). Representative image of PC-3 cell colony formation assays. The images were acquired, and the area of each colony was measured by the Image J software and the values obtained were expressed in relation to the DPN or PPT and subtracted from the control (DPN = 1) (A) or (PPT = 1) (B). The colonies were also counted with Zen software and the values of the number of colonies were expression in relation to DPN (A) or PPT (B) and subtracted from the control (DPN = 1) (A) or (PPT = 1) (B). Results are expressed as (mean ± SEM) of three independent experiments. # Significantly different from DPN (p < 0.05, ANOVA and Newman-Keuls). + Significantly different from PPT (p < 0.05, ANOVA and Newman-Keuls).

Similar articles

Cited by

References

    1. Heinlein C.A., Chang C. Androgen receptor in prostate cancer. Endocr. Rev. 2004;25:276–308. doi: 10.1210/er.2002-0032. - DOI - PubMed
    1. Di Zazzo E., Galasso G., Giovannelli P., Di Donato M., Castoria G. Estrogens and their receptors in prostate cancer: Therapeutic implications. Front. Oncol. 2018;8:2. doi: 10.3389/fonc.2018.00002. - DOI - PMC - PubMed
    1. Dobbs R.W., Malhotra N.R., Greenwald D.T., Wang A.Y., Prins G.S., Abern M.R. Prostate, Eetrogens and prostate cancer. Prostate Cancer Prostatic Dis. 2019;22:185–194. doi: 10.1038/s41391-018-0081-6. - DOI - PubMed
    1. Sehgal P.D., Bauman T.M., Nicholson T.M., Vellky J.E., Ricke E.A., Tang W., Xu W., Huang W., Ricke W.A. Tissue-specific quantification and localization of androgen and estrogen receptors in prostate cancer. Hum. Pathol. 2019;89:99–108. doi: 10.1016/j.humpath.2019.04.009. - DOI - PMC - PubMed
    1. Vellky J.E., Ricke W.A. Development and prevalence of castration-resistant prostate cancer subtypes. Neoplasia. 2020;22:566–575. doi: 10.1016/j.neo.2020.09.002. - DOI - PMC - PubMed

LinkOut - more resources