

Shedding Light on the African Enigma: In Vitro Testing of Homo sapiens-Helicobacter pylori Coevolution
- PMID: 33503840
- PMCID: PMC7912213
- DOI: 10.3390/microorganisms9020240
Shedding Light on the African Enigma: In Vitro Testing of Homo sapiens-Helicobacter pylori Coevolution
Abstract
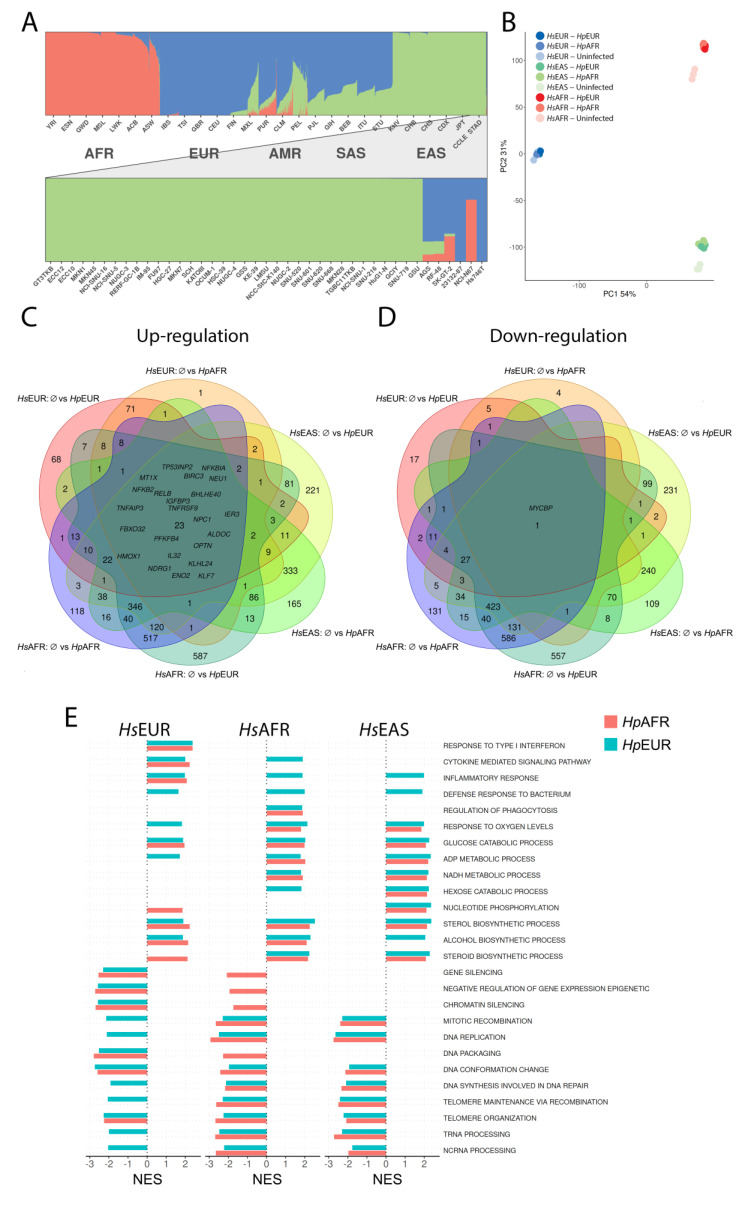
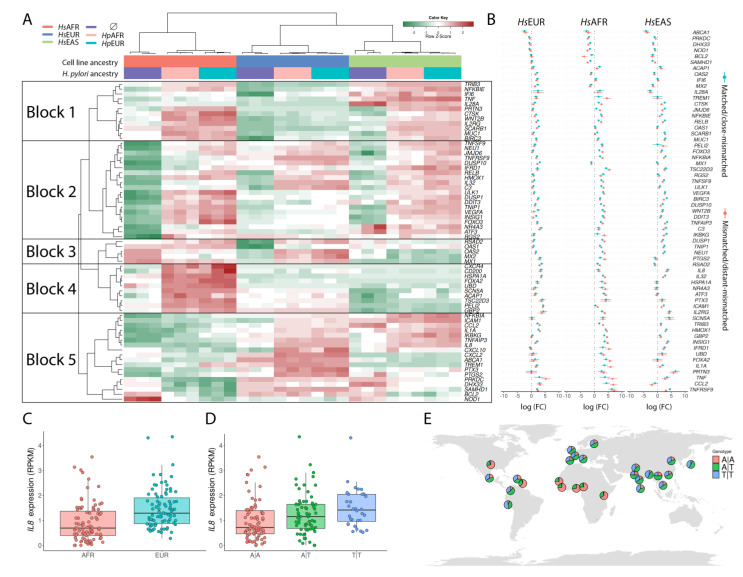
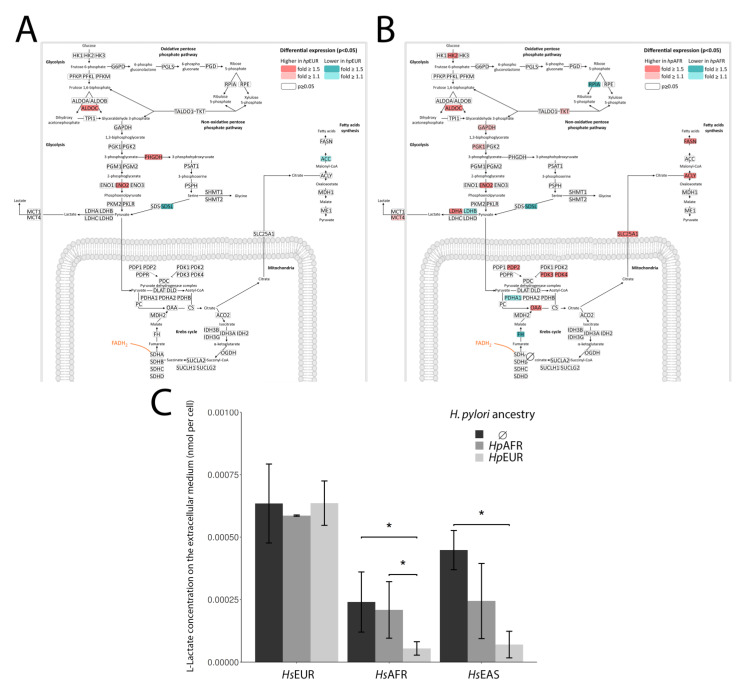
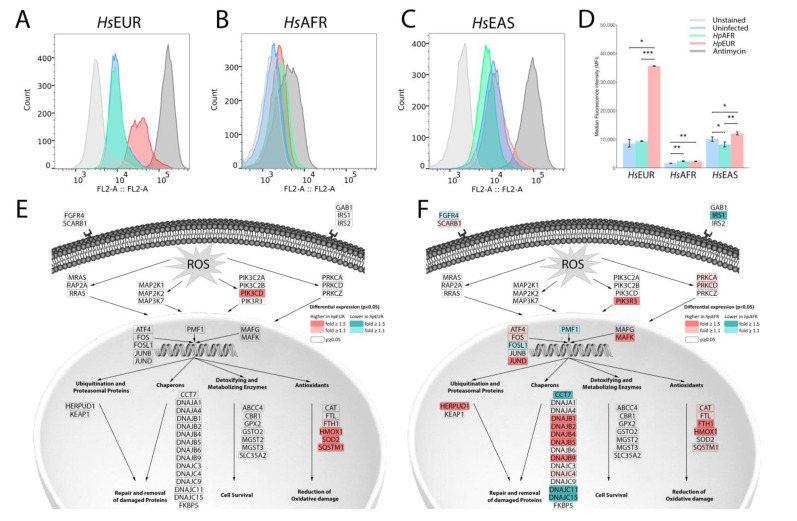
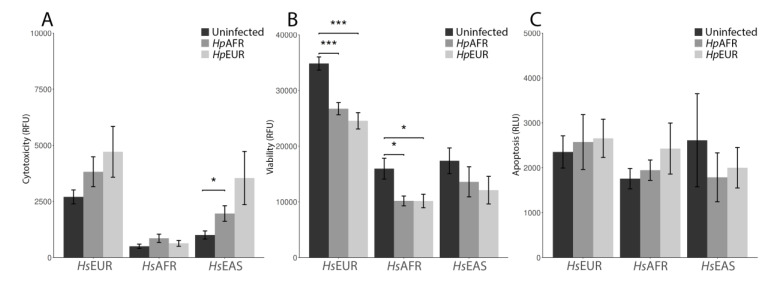
The continuous characterization of genome-wide diversity in population and case-cohort samples, allied to the development of new algorithms, are shedding light on host ancestry impact and selection events on various infectious diseases. Especially interesting are the long-standing associations between humans and certain bacteria, such as the case of Helicobacter pylori, which could have been strong drivers of adaptation leading to coevolution. Some evidence on admixed gastric cancer cohorts have been suggested as supporting Homo-Helicobacter coevolution, but reliable experimental data that control both the bacterium and the host ancestries are lacking. Here, we conducted the first in vitro coinfection assays with dual human- and bacterium-matched and -mismatched ancestries, in African and European backgrounds, to evaluate the genome wide gene expression host response to H. pylori. Our results showed that: (1) the host response to H. pylori infection was greatly shaped by the human ancestry, with variability on innate immune system and metabolism; (2) African human ancestry showed signs of coevolution with H. pylori while European ancestry appeared to be maladapted; and (3) mismatched ancestry did not seem to be an important differentiator of gene expression at the initial stages of infection as assayed here.
Keywords: Helicobacter pylori; Homo sapiens; ancestry background; coevolution; genome-wide gene expression; innate immune response.
Conflict of interest statement
The authors declare no conflict of interest. The funders had no role in the design of the study; in the collection, analyses, or interpretation of data; in the writing of the manuscript, or in the decision to publish the results.
Figures
Similar articles
-
Human and Helicobacter pylori coevolution shapes the risk of gastric disease.Proc Natl Acad Sci U S A. 2014 Jan 28;111(4):1455-60. doi: 10.1073/pnas.1318093111. Epub 2014 Jan 13. Proc Natl Acad Sci U S A. 2014. PMID: 24474772 Free PMC article.
-
Evolutionary History of the Helicobacter pylori Genome: Implications for Gastric Carcinogenesis.Gut Liver. 2012 Jan;6(1):21-8. doi: 10.5009/gnl.2012.6.1.21. Epub 2012 Jan 12. Gut Liver. 2012. PMID: 22375167 Free PMC article.
-
Strategies used by helicobacter pylori to establish persistent infection.World J Gastroenterol. 2017 Apr 28;23(16):2870-2882. doi: 10.3748/wjg.v23.i16.2870. World J Gastroenterol. 2017. PMID: 28522905 Free PMC article. Review.
-
The human gastric colonizer Helicobacter pylori: a challenge for host-parasite glycobiology.Glycobiology. 2000 Aug;10(8):761-71. doi: 10.1093/glycob/10.8.761. Glycobiology. 2000. PMID: 10929002 Review.
-
Helicobacter pylori in human health and disease: Mechanisms for local gastric and systemic effects.World J Gastroenterol. 2018 Jul 28;24(28):3071-3089. doi: 10.3748/wjg.v24.i28.3071. World J Gastroenterol. 2018. PMID: 30065554 Free PMC article. Review.
Cited by
-
Clinical Pathologic Profiles of Helicobacter pylori Reveal Age-Specific Peaking with Concomitant Chronic Gastric Inflammation, Robust Immunity, and Tissue Alterations Implying Potential Predisposition to Malignancy in Ha'il, Saudi Arabia.J Clin Med. 2025 Apr 11;14(8):2643. doi: 10.3390/jcm14082643. J Clin Med. 2025. PMID: 40283473 Free PMC article.
-
Gastrointestinal microbiome and Helicobacter pylori: Eradicate, leave it as it is, or take a personalized benefit-risk approach?World J Gastroenterol. 2022 Feb 21;28(7):766-774. doi: 10.3748/wjg.v28.i7.766. World J Gastroenterol. 2022. PMID: 35317277 Free PMC article.
-
Special Issue: From Host-Pathogen Interaction to Host-Directed Therapies.Microorganisms. 2021 Dec 17;9(12):2606. doi: 10.3390/microorganisms9122606. Microorganisms. 2021. PMID: 34946207 Free PMC article.
-
Bacterial-Viral Interactions in Human Orodigestive and Female Genital Tract Cancers: A Summary of Epidemiologic and Laboratory Evidence.Cancers (Basel). 2022 Jan 15;14(2):425. doi: 10.3390/cancers14020425. Cancers (Basel). 2022. PMID: 35053587 Free PMC article. Review.
-
Gastric cancer in Sub-Saharan Africa - a systematic review of primary data.Ecancermedicalscience. 2024 Mar 7;18:1680. doi: 10.3332/ecancer.2024.1680. eCollection 2024. Ecancermedicalscience. 2024. PMID: 38566758 Free PMC article. Review.
References
-
- Ehrlich P.R., Raven P.H. Butterflies and Plants: A Study in Coevolution. Evolution. 1964;18:586–608. doi: 10.1111/j.1558-5646.1964.tb01674.x. - DOI
LinkOut - more resources
Full Text Sources
Other Literature Sources
Miscellaneous
