

Health Advertising during the Lockdown: A Comparative Analysis of Commercial TV in Spain
- PMID: 33504002
- PMCID: PMC7908092
- DOI: 10.3390/ijerph18031054
Health Advertising during the Lockdown: A Comparative Analysis of Commercial TV in Spain
Abstract
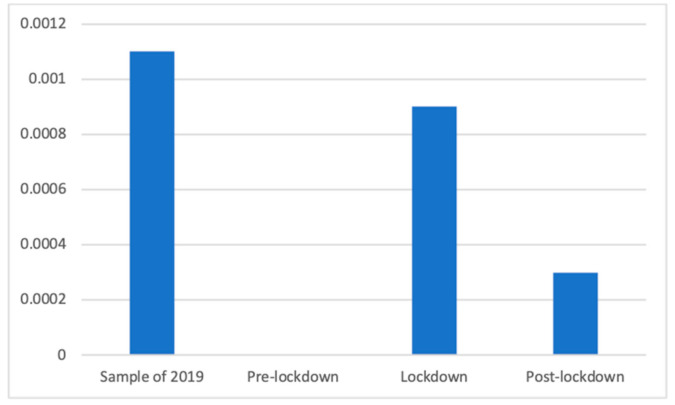
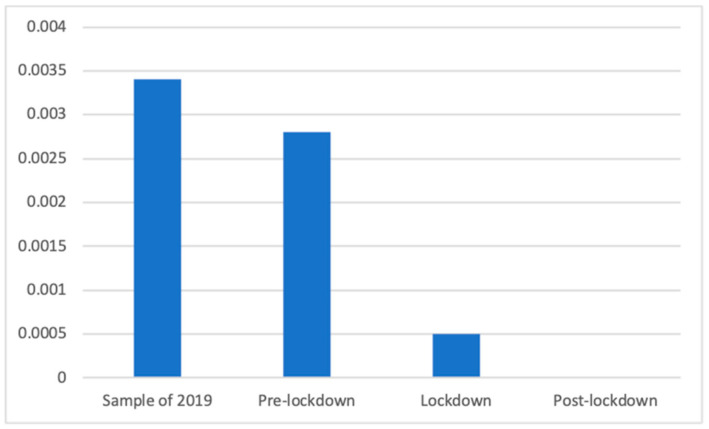
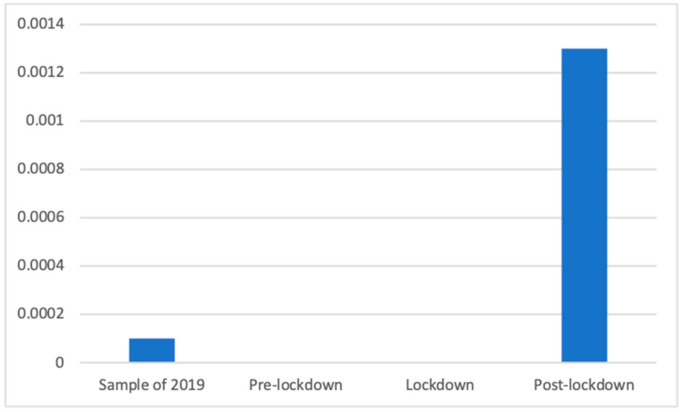
During the lockdown declared in Spain to fight the spread of COVID-19 from 14 March to 3 May 2020, a context in which health information has gained relevance, the agenda-setting theory was used to study the proportion of health advertisements broadcasted during this period on Spanish television. Previous and posterior phases were compared, and the period was compared with the same period in 2019. A total of 191,738 advertisements were downloaded using the Instar Analytics application and analyzed using inferential statistics to observe the presence of health advertisements during the four study periods. It was observed that during the lockdown, there were more health advertisements than after, as well as during the same period in 2019, although health advertisements had the strongest presence during the pre-lockdown phase. The presence of most types of health advertisements also changed during the four phases of the study. We conclude that, although many differences can be explained by the time of the year-due to the presence of allergies or colds, for instance-the lockdown and the pandemic affected health advertising. However, the effects were mostly visible after the lockdown, when advertisers and broadcasters had had time to adapt to the unexpected circumstances.
Keywords: COVID-19 pandemic; Spain; advertisements; agenda-setting theory; health advertising; health communication; lockdown; television.
Conflict of interest statement
The authors declare no conflict of interest.
Figures


Similar articles
-
TV Advertising, Corporate Power, and Latino Health Disparities.Am J Prev Med. 2022 Oct;63(4):496-504. doi: 10.1016/j.amepre.2022.04.017. Epub 2022 Jun 6. Am J Prev Med. 2022. PMID: 35680481
-
Advertising of fast food to children on Australian television: the impact of industry self-regulation.Med J Aust. 2011 Jul 4;195(1):20-4. doi: 10.5694/j.1326-5377.2011.tb03182.x. Med J Aust. 2011. PMID: 21728936
-
[Sex Work during the COVID-19 Pandemic Period in the Ibero-American Context: analysis of advertisements on websites].Cien Saude Colet. 2020 Nov;25(11):4237-4248. doi: 10.1590/1413-812320202511.26622020. Epub 2020 Aug 27. Cien Saude Colet. 2020. PMID: 33175033 Portuguese.
-
Resilience and Anti-Stress during COVID-19 Isolation in Spain: An Analysis through Audiovisual Spots.Int J Environ Res Public Health. 2020 Nov 29;17(23):8876. doi: 10.3390/ijerph17238876. Int J Environ Res Public Health. 2020. PMID: 33260338 Free PMC article.
-
Pandemic lockdown, healthcare policies and human rights: integrating opposed views on COVID-19 public health mitigation measures.Rev Cardiovasc Med. 2020 Dec 30;21(4):509-516. doi: 10.31083/j.rcm.2020.04.274. Rev Cardiovasc Med. 2020. PMID: 33387996 Review.
Cited by
-
Relations between Air Quality and Covid-19 Lockdown Measures in Valencia, Spain.Int J Environ Res Public Health. 2021 Feb 26;18(5):2296. doi: 10.3390/ijerph18052296. Int J Environ Res Public Health. 2021. PMID: 33652575 Free PMC article.
References
-
- Igartua J.J., Ortega-Mohedano F., Arcila-Calderón C. Communication use in the times of the coronavirus. A cross-cultural study. El Prof. Inf. 2020;29:e290318. doi: 10.3145/epi.2020.may.18. - DOI
-
- Román-San-Miguel A., Valenzuela N.S.G., Zambrano R.E. Las fake news durante el Estado de Alarma por COVID-19. Análisis desde el punto de vista político en la prensa española. Rev. Lat. Comun. Soc. 2020;78:359–391. doi: 10.4185/RLCS-2020-1481. - DOI
-
- Gerbner G., Gross L., Morgan M., Signorielli N. Living with television: The dynamics of the cultivation process. In: Bryant J., Zillmann D., editors. Perspectives on Media Effects. Lawrence Erlbaum Associates; Hillsdale, NJ, USA: 1986. pp. 17–40.
-
- Katz E., Blumler J., Gurevitch M. Uses and Gratifications Research. Public Opin. Q. 1973;37:509–523. doi: 10.1086/268109. - DOI
-
- Estudio General de Medios 1ª Ola 2020. [(accessed on 19 November 2020)]; Available online: http://reporting.aimc.es/index.html#/main/television.
Publication types
MeSH terms
Grants and funding
LinkOut - more resources
Full Text Sources
Other Literature Sources
Medical
