Review
. 2021 Jan 25;11(2):86.
doi: 10.3390/life11020086.

Radiologic Definition of Sarcopenia in Chronic Liver Disease

Affiliations
Review

Radiologic Definition of Sarcopenia in Chronic Liver Disease

Chul-Min Lee et al. Life (Basel). .

Abstract

Sarcopenia is prevalent in patients with chronic liver disease, and affected patients tend to have worse clinical outcomes and higher mortality. However, relevant analyses are limited by heterogeneity in the definition of sarcopenia and in the methodological approaches in assessing it. We reviewed several radiologic methods for sarcopenia in patients with chronic liver disease. Dual energy X-ray absorptiometry (DXA) can measure muscle mass, but it is difficult to evaluate muscle quality using this technique. Computed tomography, known as the gold standard for diagnosing sarcopenia, enables the objective measurement of muscle quantity and quality. The third lumbar skeletal muscle index (L3 SMI) more accurately predicted the mortality of subjects than the psoas muscle index (PMI). Few studies have evaluated the sarcopenia of chronic liver disease using ultrasonography and magnetic resonance imaging, and more studies are needed. Unification of the measurement method and cut-off value would facilitate a more systematic and universal prognosis evaluation in patients with chronic liver disease.

Keywords: CT; DXA; MRI; chronic liver disease; radiologic evaluation; sarcopenia; ultrasonography.


Conflict of interest statement

We declare that we have no financial and personal relationships with other people or organizations that can inappropriately influence our work, and there is no professional or other personal interest of any nature or kind in any product, service, and/or company.

Figures

Figure 1
Figure 1
Dual energy X-ray absorptiometry (DXA) scan with body composition analysis. The subject’s height was 1.59 m, and the lean and appendicular lean masses were 39.1 and 16.6 kg, respectively. The Appendicular Lean Mass Index (ALMI) was calculated as 6.6 kg/m2.
Figure 2
Figure 2
Left side: Example of an ultrasound measurement of the psoas muscle diameter. Right side: the corresponding CT image.
Figure 3
Figure 3
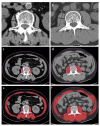
Abdominal CT images taken at the third lumbar vertebra with cirrhosis applied to quantify transverse psoas muscle thickness (TPMT), psoas muscle, and total muscle areas. The psoas muscle in panels (c,d) and total muscle area in panels (e,f) are colored in red. Panels (a,c,e) present a female patient with low TPMT (5.9 mm/m), psoas muscle index (PMI) (2.3 cm2/m2), and skeletal muscle index (SMI) (35.7 cm2/m2). Panels (b,d,f) present a male patient with high TPMT (23.3 mm/m), PMI (6.8 cm2/m2), and SMI (51.6 cm2/m2). The mean density of muscle in (cf) is 34.7, 38.2, 26.2, and 36.6 HU, respectively.
Figure 4
Figure 4
Example MR images (fat fraction) of cross-section of the spinal muscles at the Superior Mesenteric Artery level in two patients with low fatty degeneration (a) and high fatty degeneration (b). (a) The area and fat fraction of the left spinal muscle were 3150 mm2 and 10.3%. (b) The area and fat fraction of the left spinal muscle were 1394 mm2 and 44.3%. An axial three-dimensional multi-echo-modified Dixon gradient echo sequence was used for the MRI. Imaging parameters for the sequence were as follows: six Echo Time (TE)s (first TE shortest automatic (0.9–1.2ms), delta TE 0.8–1.01ms); Repetition Time (TR) shortest automatic (5.8–6.3 ms); flip angle =3; field of view = 35 × 35 cm2; 3 mm slice thickness with no gap; matrix size = 300 × 300; number of slices = 60; scan time = 14.1 s; parallel imaging SENSE factor = 2; number of signal average = 1. The sequence automatically produces water, fat, fat fraction, R2*, and T2* maps.

Similar articles

Cited by

References

    1. Cruz-Jentoft A.J., Bahat G., Bauer J., Boirie Y., Bruyère O., Cederholm T., Cooper C., Landi F., Rolland Y., Sayer A.A., et al. Sarcopenia: Revised European consensus on definition and diagnosis. Age Ageing. 2019;48:16–31. doi: 10.1093/ageing/afy169. - DOI - PMC - PubMed
    1. Nishikawa H., Shiraki M., Hiramatsu A., Moriya K., Hino K., Nishiguchi S. Japan Society of Hepatology guidelines for sarcopenia in liver disease (1st edition): Recommendation from the working group for creation of sarcopenia assessment crite-ria. Hepatol. Res. 2016;46:951–963. doi: 10.1111/hepr.12774. - DOI - PubMed
    1. Tsien C., Shah S.N., McCullough A.J., Dasarathy S. Reversal of sarcopenia predicts survival after a transjugular intrahe-patic portosystemic stent. Eur. J. Gastroenterol. Hepatol. 2013;25:85–93. doi: 10.1097/MEG.0b013e328359a759. - DOI - PubMed
    1. Ooi P.H., Hager A., Mazurak V.C., Dajani K., Bhargava R., Gilmour S.M., Mager D. Sarcopenia in Chronic Liver Disease: Impact on Outcomes. Liver Transplant. 2019;25:1422–1438. doi: 10.1002/lt.25591. - DOI - PubMed
    1. Kim G., Kang S.H., Kim M.Y., Baik S.K. Prognostic value of sarcopenia in patients with liver cirrhosis: A systematic review and meta-analysis. PLoS ONE. 2017;12:e0186990. doi: 10.1371/journal.pone.0186990. - DOI - PMC - PubMed

LinkOut - more resources