. 2021 Jan 25;10(2):234.
doi: 10.3390/plants10020234.

Enhancement of Photosynthetic Iron-Use Efficiency Is an Important Trait of Hordeum vulgare for Adaptation of Photosystems to Iron Deficiency

Affiliations

Enhancement of Photosynthetic Iron-Use Efficiency Is an Important Trait of Hordeum vulgare for Adaptation of Photosystems to Iron Deficiency

Akihiro Saito et al. Plants (Basel). .

Abstract

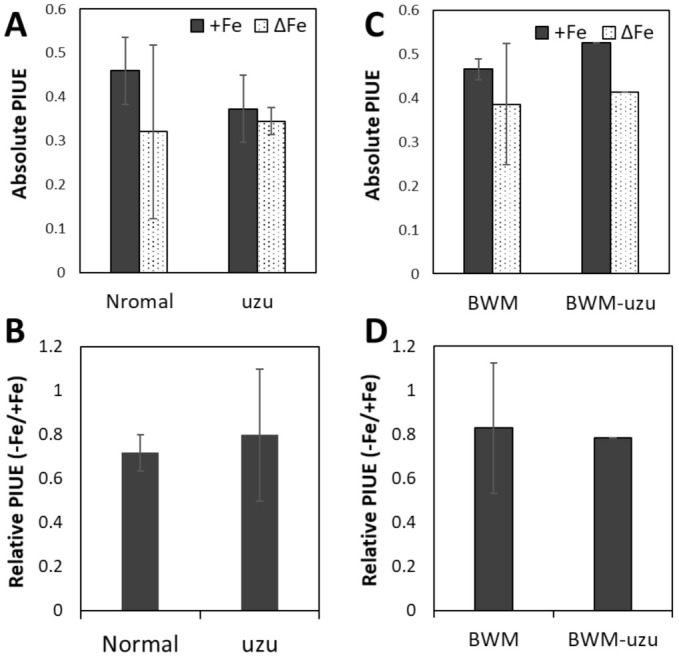
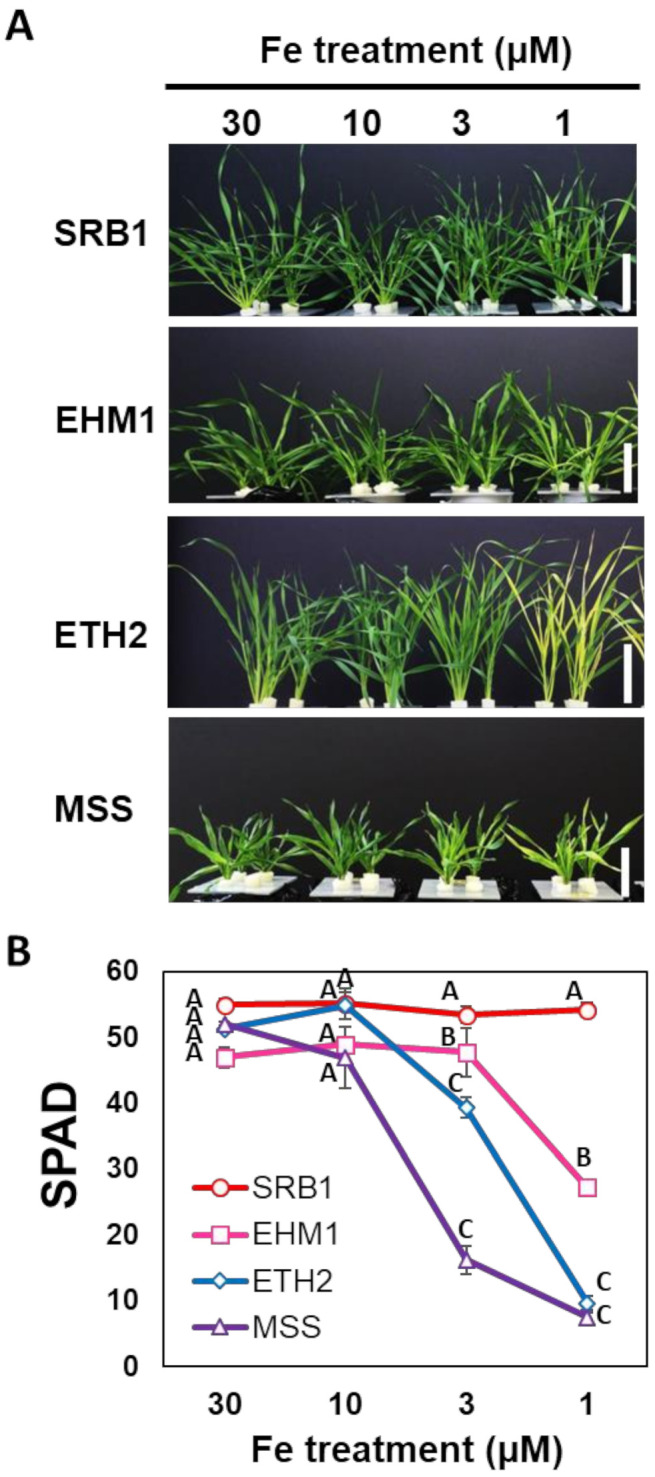
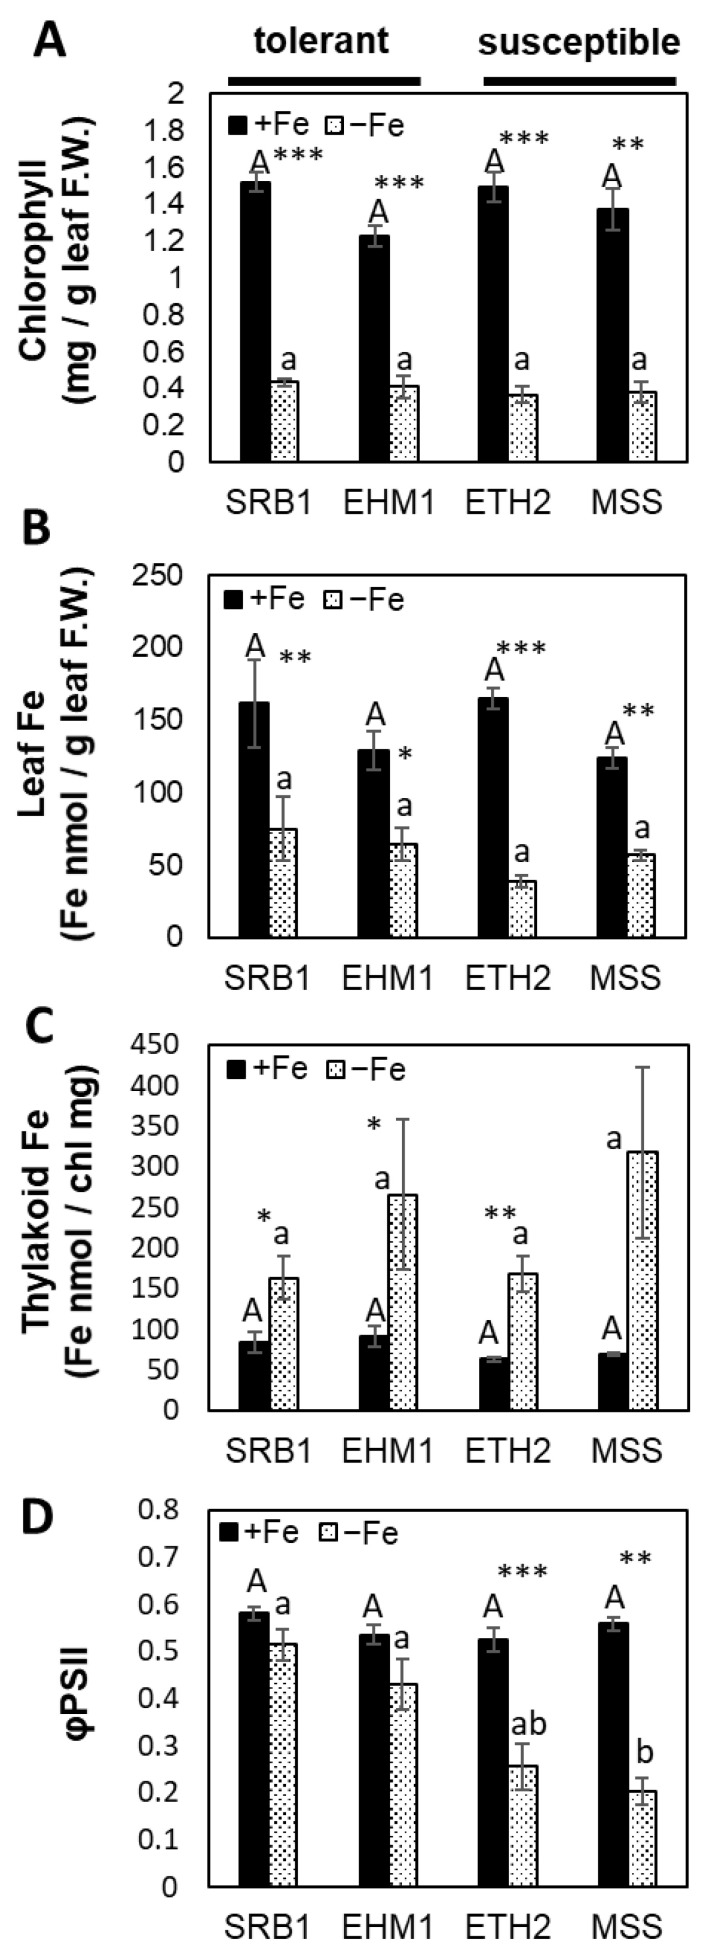
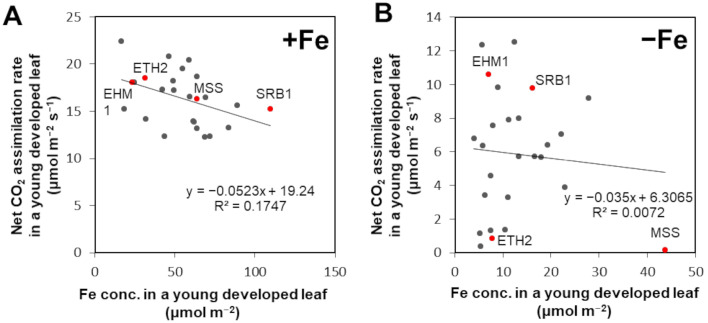
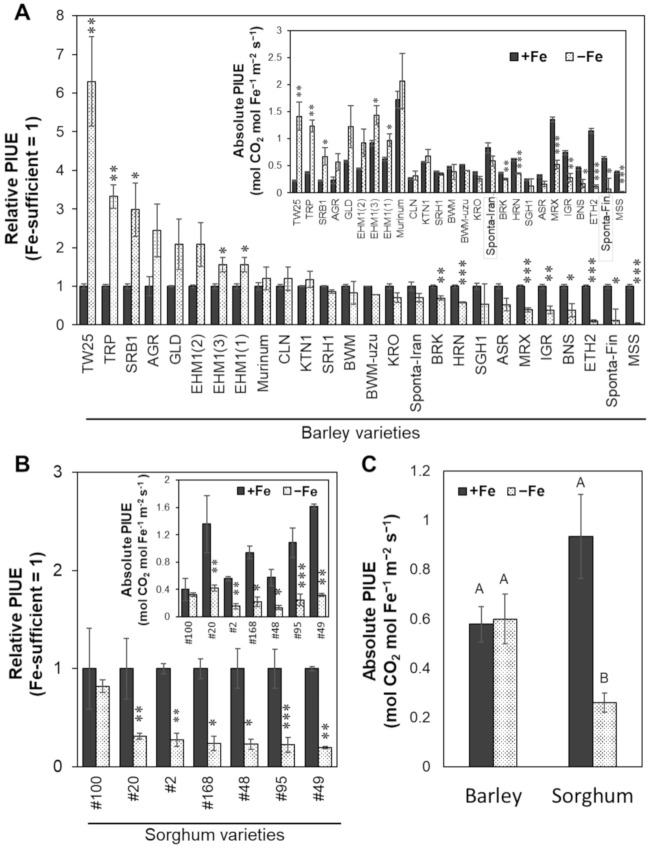
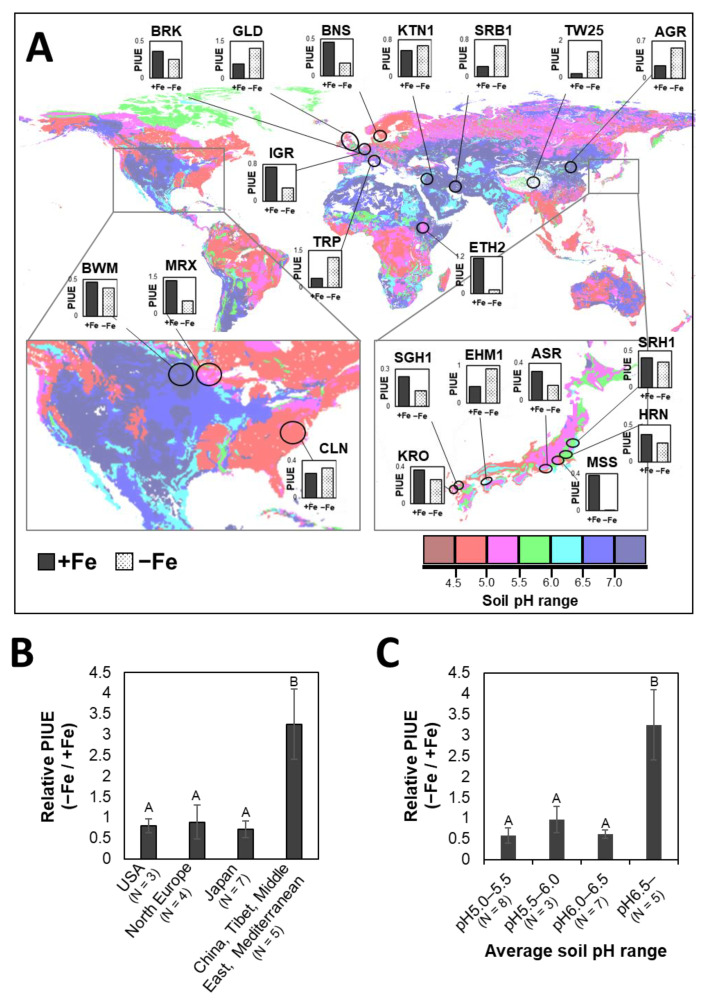
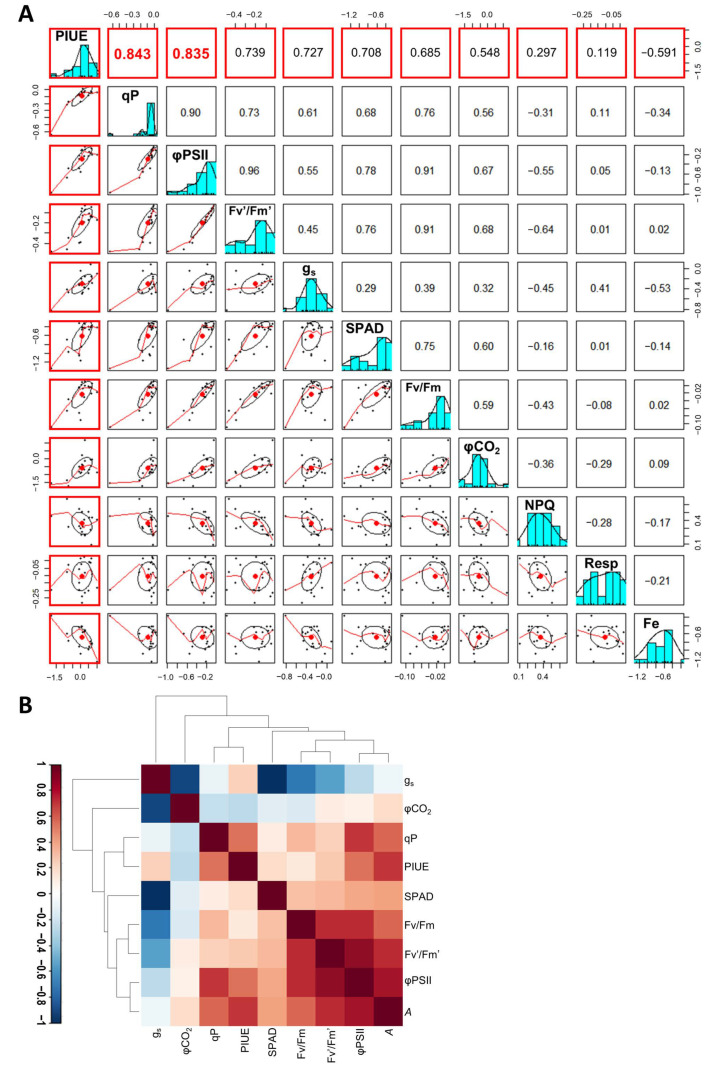
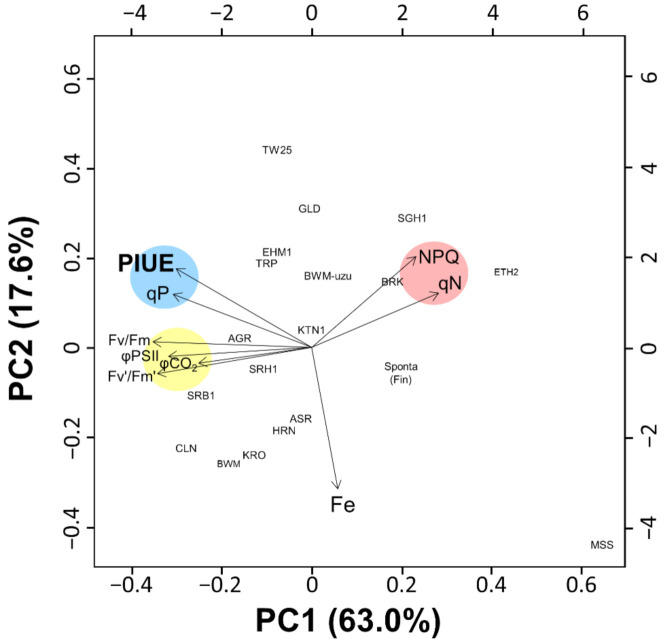
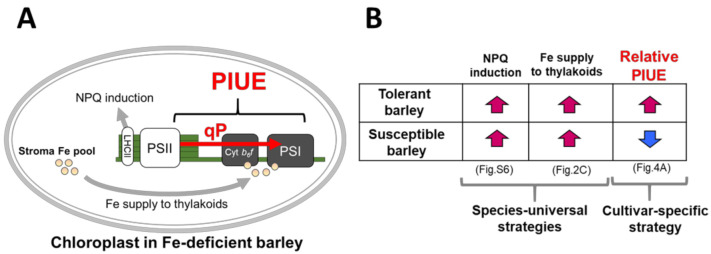
Leaf iron (Fe) contents in Fe-deficiency-tolerant plants are not necessarily higher than that in Fe-deficiency-susceptible ones, suggesting an unknown mechanism involved in saving and allowing the efficient use of minimal Fe. To quantitatively evaluate the difference in Fe economy for photosynthesis, we compared the ratio of CO2 assimilation rate to Fe content in newly developed leaves as a novel index of photosynthetic iron-use efficiency (PIUE) among 23 different barley (Hordeum vulgare L.) varieties. Notably, varieties originating from areas with alkaline soil increased PIUE in response to Fe-deficiency, suggesting that PIUE enhancement is a crucial and genetically inherent trait for acclimation to Fe-deficient environments. Multivariate analyses revealed that the ability to increase PIUE was correlated with photochemical quenching (qP), which is a coefficient of light energy used in photosynthesis. Nevertheless, the maximal quantum yield of photosystem II (PSII) photochemistry, non-photochemical quenching, and quantum yield of carbon assimilation showed a relatively low correlation with PIUE. This result suggests that the ability of Fe-deficiency-tolerant varieties of barley to increase PIUE is related to optimizing the electron flow downstream of PSII, including cytochrome b6f and photosystem I.

Keywords: Fe economy; barley; electron transport chain; iron deficiency; photosynthetic iron (Fe)-use efficiency; photosystem I; photosystem II; sorghum.


Conflict of interest statement

The funder EARTHNOTE Co., Ltd. had no role in the design of the study; in the collection, analyses, or interpretation of data; in the writing of the manuscript, or in the decision to publish the results. All authors declare no competing interests.

Figures

Figure A1
Figure A1
Photosynthetic Fe-use efficiency (PIUE) between uzu semi-dwarf and normal Japanese barley varieties. Absolute PIUE (A) and relative PIUE (B) of normal and uzu semi-dwarf Japanese barley varieties. For normal barley, the average value was obtained from the mean values of ‘Shiro Hadaka 1’ (SRH1), ‘Kairyo Ogara’ (KRO), and ‘Haruna Nijo’ (HRN). For uzu semi-dwarf barley, the average value was obtained from mean values of ‘Ehime Hadaka 1’ (EHM1), ‘Akashinriki’ (ASR), ‘Saga Hadaka 1’ (SGH1), ‘Musashinomugi’ (MSS), and ‘Colonial’ (CLN). Absolute PIUE (C) and relative PIUE (D) of ‘Bowman’ (BWM) and ‘Bowman near-isogenic line uzu1.a’ (BWM-uzu). Data represent means of triplicate determinations for BWM and one experiment for BWM-uzu.
Figure 1
Figure 1
Fe-deficiency-tolerance among four representative barley varieties. Photographs (A) and SPAD (chlorophyll meter) values of young developed leaves (B) of four barley varieties grown under different Fe treatment (30, 10, 3, and 1 µM Fe) for 16 days. Before the Fe treatments, seedlings were grown with normal Fe concentration (30 µM Fe) for 11–12 days as a pre-culture until the seed nutrition was consumed. Significant differences among different varieties were tested using the Tukey’s multiple test at each Fe treatment (N = 3 ± standard error, p < 0.05, same letters indicate no significant difference). ‘Sarab 1′ (SRB1) and ‘Ehime Hadaka 1′ (EHM1) are the tolerant cultivars and ‘Ethiopia 2′ (ETH2) and ‘Musashinomugi’ (MSS) are the susceptible barley cultivars.
Figure 2
Figure 2
Comparison of the physiological traits among four representative barley varieties. Data were obtained from young developed leaves (5–6th leaves) of each variety. Chlorophyll concentrations (A), Fe concentrations in leaf (B), Fe concentrations in the thylakoid membranes (C), and chlorophyll fluorescence parameter for the quantum efficiencies of PSII electron transport (φPSII) (D) of four barley varieties grown under Fe-sufficient (+Fe) and mild Fe-deficient (−Fe) conditions for 16–20 days are shown. Fe concentration in the −Fe solution was adjusted to 3.0 µM Fe for ETH2 and MSS, and 0.5 µM Fe for SRB1 and EHM1 to prepare similar chlorotic leaves at the fifth leaf position in all four cultivars. The significant differences between Fe treatments were determined using the Student’s t-test ((N = 3 ± standard error, * p < 0.05, ** p < 0.01, *** p < 0.001), and between-varieties Tukey’s multiple test was used (p < 0.05, no significant difference between the same lowercase or between the same capital letters).
Figure 3
Figure 3
Correlation between leaf Fe concentration and net CO2 assimilation rate among barley varieties. Correlation data among 23 barley varieties grown under Fe-sufficient (+Fe) condition (A) or Fe-deficient (−Fe) condition (B). The original data on barley (including H. vulgare spontaneum and Hordeum murinum) used for the analysis are presented in Supplementary Figure S4. Significance of differences in Pearson’s correlation coefficient between treatment groups was determined using the Student’s t-test (p < 0.05, no notation for those with no significant difference). ‘Sarab 1’ (SRB1) and ‘Ehime Hadaka 1’ (EHM1) are the tolerant cultivars, and ‘Ethiopia 2’ (ETH2) and ‘Musashinomugi’ (MSS) are the susceptible barley cultivars.
Figure 4
Figure 4
Variation in the photosynthetic Fe-use efficiency (PIUE) among barley and sorghum varieties. The relative value of PIUE of the Fe-deficient (−Fe) leaves to the Fe-sufficient (+Fe) leaves of barley (A) and sorghum (B) are shown. Inserted figures in (A,B) are absolute value of PIUE, representing molar amounts of CO2 that can be assimilated per mole leaf Fe in one second of time. Comparison of an average of absolute PIUE values for all barley and all sorghum varieties (C). The significant differences between Fe-sufficient and Fe-deficient plants in (A,B) were tested using the Student’s t-test (N = 3 ± standard error, * p < 0.05, ** p < 0.01, *** p < 0.001), and among the data of sorghum and barley in (C) were tested using the Tukey’s multiple test (N = 3 ± standard error, p < 0.05, same capital letters indicate no significant difference). Abbreviations of plant variety names are summarized below: ‘Ehime Hadaka 1’ (EHM1), ‘Shiro Hadaka 1’ (SRH1), ‘Kairyo Ogara’ (KRO), ‘Haruna Nijo’ (HRN), ‘Akashinriki’ (ASR), ‘Saga Hadaka 1’ (SGH1), ‘Musashinomugi’ (MSS), ‘Colonial’ (CLN), ‘Bowman’ (BWM), ‘Bowman near-isogenic line uzu1.a’ (BWM-uzu), ‘Bonus (BNS), ‘Igri’ (IGR), ‘Barke’ (BRK), ‘Morex’ (MRX), ‘Golden Promise’ (GLD), ‘Tripoli’ (TRP), ‘Sarab 1’ (SRB1), ‘Katana 1’ (KTN1), ‘Tibet White 25’ (TW25), ‘Ethiopia 2’ (ETH2), ‘Agriochriton’ (AGR), ‘Spontaneum’ from Iran (Sponta-Iran), ‘Spontaneum’ from Finland (Sponta-Fin), and Hordeum murinum L. (Murinum). Triplicate data of EHM1 are denoted as (EHM1(1), EHM1(2), and EHM1(3)).
Figure 5
Figure 5
Relationship between soil pH and global distribution of barley varieties with a different calculated photosynthetic Fe-use efficiency (PIUE). The distribution of 20 barley varieties on the world soil pH map (A). The inserted small bar graphs in (A) represent the absolute PIUE (Figure 4A) of each variety in Fe-sufficient (+Fe) and Fe-deficient (−Fe) conditions. As shown in the color charts below the map, areas filled with dark blue indicate alkaline and with dark red indicate acidic subsoil pH (30–100 cm depth). The collection site or production site of each barley variety was placed on the map at its original location of cultivation. Comparison of relative PIUE as the ratio of Fe-deficiency to Fe-sufficiency classified by the different geographical areas among 20 barley cultivars (B) and by the soil pH of 23 barley varieties including wild barley H. vulgare spontaneum and H. murinum (C). The significant differences among the data in (B) or (C) were tested using the Tukey’s multiple tests (p < 0.05, same capital letters indicate no significant difference).The global soil pH map was created by a software Harmonized World Soil Database (HWSD) viewer (FAO/IIASA/ISRIC/ISS-CAS/JRC, 2012. Harmonized World Soil Database (version 1.2). FAO, Rome, Italy and IIASA, Luxemburg, Austria) [29].
Figure 6
Figure 6
Correlation between biomass and photosynthetic Fe-use efficiency (PIUE) among barley varieties. Relative shoot biomass (A) and root biomass (B) as the ratio of Fe-deficiency to Fe-sufficiency. Plants in the vegetative growth phase were grown in hydroponic solution with or without Fe for 16 days. These variables (Supplementary Table S2) were converted to logarithms to fit the regression line. Significance of differences in Pearson’s correlation coefficient between relative PIUE and relative shoot biomass was determined using the Student’s t test (*** p < 0.001).
Figure 7
Figure 7
Correlation analysis of relative PIUE and relative variables among 18 barley varieties. (A) Scatter plot matrices among variables obtained in this study. These variables were the relative values as the ratio of Fe-deficiency to Fe-sufficiency and they were converted to logarithms. The values in the red square in the top row are Pearson correlation coefficients (r) as relative PIUE vs. relative qP, relative φPSII, relative Fv’/Fm’, relative stomatal conductance (gs), relative SPAD value, relative Fv/Fm, relative φCO2, relative respiration rate (Resp), relative NPQ, and relative leaf Fe concentration (Fe). The original data used for the analysis are presented in Supplementary Table S2. (B) Heatmap colored correlation matrix for 10 variables in the dataset of 18 barley varieties. Abbreviations: stomatal conductance (gs), quantum yield of carbon assimilation (φCO2), photochemical quenching coefficient (qP), photosynthetic Fe-use efficiency (PIUE), chlorophyll index (SPAD), maximal quantum yield of PSII photochemistry (Fv/Fm), quantum yield of PSII photochemistry (Fv’/Fm’), effective quantum yield of electron transport in the light-acclimated state (φPSII), net CO2 assimilation rate (A).
Figure 8
Figure 8
Principle component analysis (PCA) for nine variables in the dataset of 18 barley varieties. Blue, yellow, and red indicate clusters of photosynthetic Fe-use efficiency (PIUE)-related indices (PIUE and qP), electron transport-related indices (Fv/Fm, Fv’/Fm’, φPSII, and φCO2), and nonphotochemical quenching (qN and NPQ). Proportion of variances for PC1 and PC2 are shown in parentheses and in Supplementary Figure S5A. Loading of each variables is shown in Supplementary Figure S5B. Dataset of the logarithmic relative value [log(−Fe/+Fe)] of variables related to photosynthesis are listed in Supplementary Table S2. Abbreviations of plant variety names are summarized below: ‘Ehime Hadaka 1’ (EHM1), ‘Shiro Hadaka 1’ (SRH1), ‘Kairyo Ogara’ (KRO), ‘Haruna Nijo’ (HRN), ‘Akashinriki’ (ASR), ‘Saga Hadaka 1’ (SGH1), ‘Musashinomugi’ (MSS), ‘Colonial’ (CLN), ‘Bowman’ (BWM), ‘Bowman near-isogenic line uzu1.a’ (BWM-uzu), ‘Golden Promise’ (GLD), ‘Tripoli’ (TRP), ‘Sarab 1’ (SRB1), ‘Katana 1’ (KTN1), ‘Tibet White 25’ (TW25), ‘Ethiopia 2’ (ETH2), ‘Agriochriton’ (AGR), ‘Spontaneum’ originated from Finland (Sponta-Fin).
Figure 9
Figure 9
Model of adaptive mechanisms in chloroplasts of Fe-deficient barley. (A) Chloroplasts in Fe-deficient barley have at least three different mechanisms to adapt/acclimate to Fe-deficiency. High NPQ induction to protect from photoinhibition [13] and preferential Fe supply to the thylakoid membranes [17] are commonly observed in barley varieties grown under Fe-deficiency as fundamental acclimation mechanisms. Induction of high PIUE (the current study) was observed only in the barley varieties with Fe-deficiency-tolerance, which generally originated from regions covered with alkaline soils. (B) Relationship between Fe-deficiency-tolerance and the three adaptive mechanisms in chloroplasts. Red up-arrows and blue down-arrows indicate an increase and decrease (or non-induction) of each mechanism under Fe-deficiency. The universality of each mechanism within H. vulgare species is shown below the table. The data to reach this conclusion are shown in parentheses.

Similar articles

Cited by

References

    1. Briat J.F., Dubos C., Gaymard F. Iron nutrition, biomass production, and plant product quality. Trends Plant Sci. 2015;20:33–40. doi: 10.1016/j.tplants.2014.07.005. - DOI - PubMed
    1. Amunts A., Nelson N. Plant Photosystem I Design in the Light of Evolution. Structure. 2009;17:637–650. doi: 10.1016/j.str.2009.03.006. - DOI - PubMed
    1. Hantzis L.J., Kroh G.E., Jahn C.E., Cantrell M., Peers G., Pilon M., Ravet K. A Program for Iron Economy during Deficiency Targets Specific Fe Proteins. Plant Physiol. 2018;176:596–610. doi: 10.1104/pp.17.01497. - DOI - PMC - PubMed
    1. Michel K.P., Pistorius E.K. Adaptation of the Photosynthetic Electron Transport Chain in Cyanobacteria to Iron Deficiency: The Function of IdiA and IsiA. Physiologia Plantarum. Volume 120. Wiley; Hoboken, NJ, USA: 2004. pp. 36–50. - PubMed
    1. Kroh G.E., Pilon M. Regulation of Iron Homeostasis and Use in Chloroplasts. Int. J. Mol. Sci. 2020;21:3395. doi: 10.3390/ijms21093395. - DOI - PMC - PubMed

Grants and funding

LinkOut - more resources