

Comparison of Three Cellular Assays to Predict the Course of CMV Infection in Liver Transplant Recipients
- PMID: 33504093
- PMCID: PMC7911226
- DOI: 10.3390/vaccines9020088
Comparison of Three Cellular Assays to Predict the Course of CMV Infection in Liver Transplant Recipients
Abstract
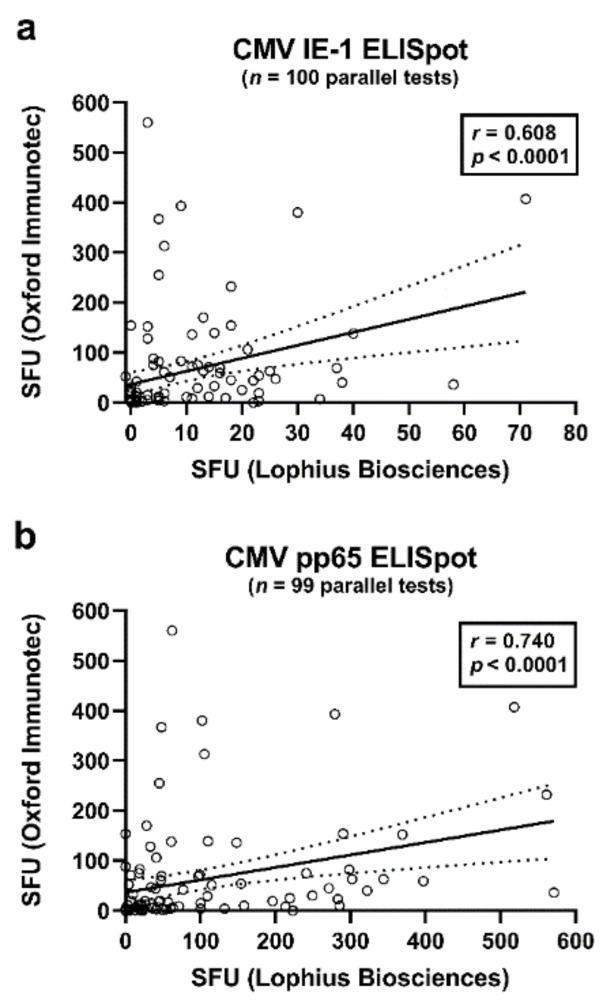
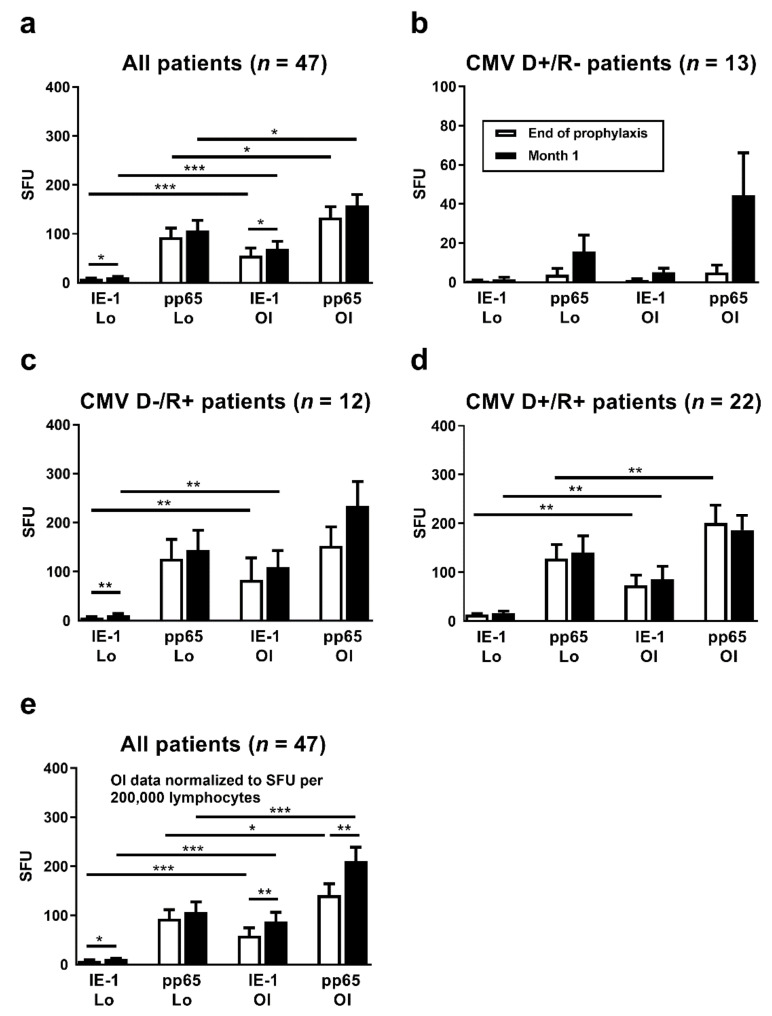
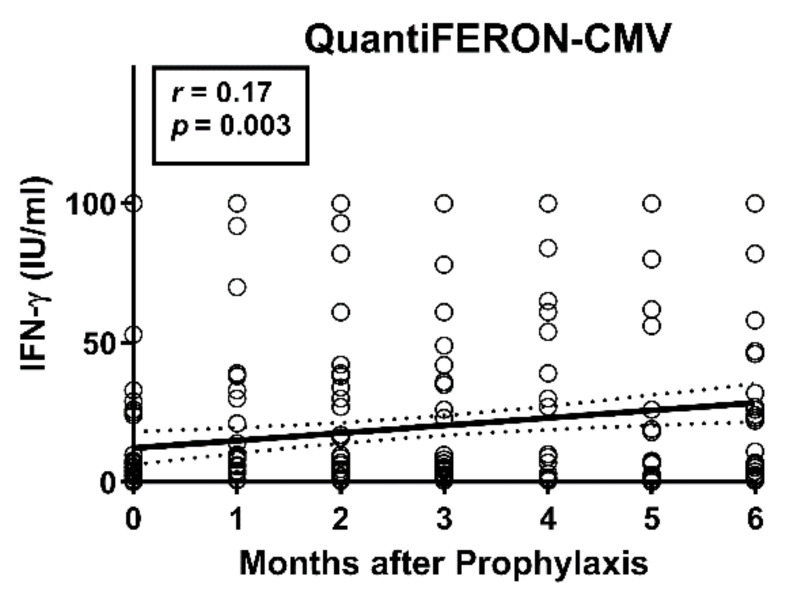
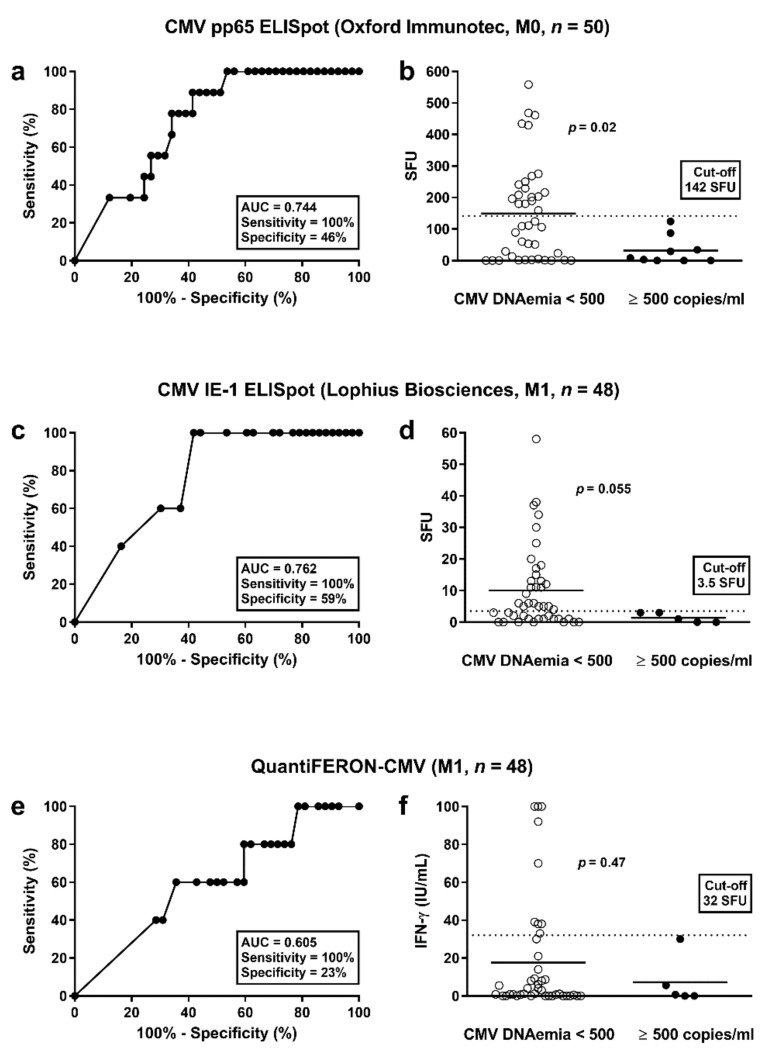
To estimate protection from cytomegalovirus (CMV) replication after solid organ transplantation, CMV serology has been considered insufficient and thus CMV immunity is increasingly assessed by cellular in vitro methods. We compared two commercially available IFN-γ ELISpot assays (T-Track CMV and T-SPOT.CMV) and an IFN-γ ELISA (QuantiFERON-CMV). Currently, there is no study comparing these three assays. The assays were performed in 56 liver transplant recipients at the end of antiviral prophylaxis and one month thereafter. In CMV high- or intermediate-risk patients the two ELISpot assays showed significant correlation (p < 0.0001, r > 0.6) but the correlation of the ELISpot assays with QuantiFERON-CMV was weaker. Results of both ELISpot assays were similarly predictive of protection from CMV-DNAemia ≥500 copies/mL [CMV pp65 T-SPOT.CMV at the end of prophylaxis: area under curve (AUC) = 0.744, cut-off 142 spot forming units (SFU), sensitivity set to 100%, specificity 46%; CMV IE-1 T-Track CMV at month 1: AUC = 0.762, cut-off 3.5 SFU, sensitivity set to 100%, specificity 59%]. The QuantiFERON-CMV assay was inferior, reaching a specificity of 23% when setting the sensitivity to 100%. In conclusion, both CMV-specific ELISpot assays appear suitable to assess protection from CMV infection/reactivation in liver transplant recipients.
Keywords: ELISA; ELISpot; human cytomegalovirus; interferon-γ; liver transplantation; prediction; reactivation.
Conflict of interest statement
The authors declare no conflict of interest. The funders had no role in the design of the study; in the collection, analyses, or interpretation of data; in the writing of the manuscript, or in the decision to publish the results.
Figures
Similar articles
-
T-Track-CMV and QuantiFERON-CMV assays for prediction of protection from CMV reactivation in kidney transplant recipients.J Clin Virol. 2018 Aug;105:91-96. doi: 10.1016/j.jcv.2018.06.009. Epub 2018 Jun 12. J Clin Virol. 2018. PMID: 29936407
-
Comparison of cytomegalovirus (CMV) enzyme-linked immunosorbent spot and CMV quantiferon gamma interferon-releasing assays in assessing risk of CMV infection in kidney transplant recipients.J Clin Microbiol. 2013 Aug;51(8):2501-7. doi: 10.1128/JCM.00563-13. Epub 2013 May 15. J Clin Microbiol. 2013. PMID: 23678073 Free PMC article.
-
Cytomegalovirus (CMV) immune monitoring with ELISPOT and QuantiFERON-CMV assay in seropositive kidney transplant recipients.PLoS One. 2017 Dec 12;12(12):e0189488. doi: 10.1371/journal.pone.0189488. eCollection 2017. PLoS One. 2017. PMID: 29232714 Free PMC article.
-
Immune Monitoring for CMV in Transplantation.Curr Infect Dis Rep. 2018 Mar 14;20(4):4. doi: 10.1007/s11908-018-0610-4. Curr Infect Dis Rep. 2018. PMID: 29542023 Review.
-
Diagnostic performance of cytomegalovirus (CMV) immune monitoring with ELISPOT and QuantiFERON-CMV assay in kidney transplantation: A PRISMA-compliant article.Medicine (Baltimore). 2019 Apr;98(16):e15228. doi: 10.1097/MD.0000000000015228. Medicine (Baltimore). 2019. PMID: 31008952 Free PMC article.
Cited by
-
Comparison of Humoral and Cellular CMV Immunity in Patients Awaiting Kidney Transplantation.Diagnostics (Basel). 2021 Sep 16;11(9):1688. doi: 10.3390/diagnostics11091688. Diagnostics (Basel). 2021. PMID: 34574029 Free PMC article.
-
Immunomonitoring via ELISPOT Assay Reveals Attenuated T-Cell Immunity to CMV in Immunocompromised Liver-Transplant Patients.Cells. 2024 Apr 24;13(9):741. doi: 10.3390/cells13090741. Cells. 2024. PMID: 38727277 Free PMC article.
-
The Association Between Cytomegalovirus Infection and Kidney Damage in the Liver Transplant Setting.Viruses. 2024 Nov 26;16(12):1830. doi: 10.3390/v16121830. Viruses. 2024. PMID: 39772140 Free PMC article.
-
ELISPOT assays with pp65 peptides or whole HCMV antigen are reliable predictors of immune control of HCMV infection in seropositive kidney transplant recipients.J Med Virol. 2023 Feb;95(2):e28507. doi: 10.1002/jmv.28507. J Med Virol. 2023. PMID: 36655741 Free PMC article.
-
Immune Control of Human Cytomegalovirus (HCMV) Infection in HCMV-Seropositive Solid Organ Transplant Recipients: The Predictive Role of Different Immunological Assays.Cells. 2024 Aug 8;13(16):1325. doi: 10.3390/cells13161325. Cells. 2024. PMID: 39195215 Free PMC article.
References
Grants and funding
LinkOut - more resources
Full Text Sources
Other Literature Sources
