. 2021 Jan 27;22(1):50.
doi: 10.1186/s13059-021-02267-5.

Single-cell proteomic and transcriptomic analysis of macrophage heterogeneity using SCoPE2

Affiliations

Single-cell proteomic and transcriptomic analysis of macrophage heterogeneity using SCoPE2

Harrison Specht et al. Genome Biol. .

Abstract

Background: Macrophages are innate immune cells with diverse functional and molecular phenotypes. This diversity is largely unexplored at the level of single-cell proteomes because of the limitations of quantitative single-cell protein analysis.

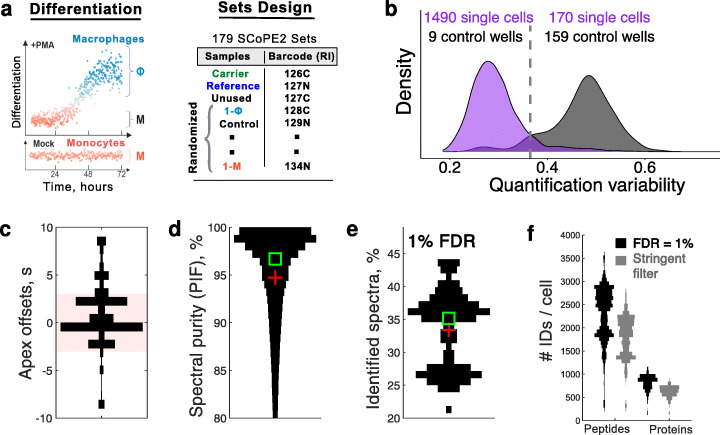
Results: To overcome this limitation, we develop SCoPE2, which substantially increases quantitative accuracy and throughput while lowering cost and hands-on time by introducing automated and miniaturized sample preparation. These advances enable us to analyze the emergence of cellular heterogeneity as homogeneous monocytes differentiate into macrophage-like cells in the absence of polarizing cytokines. SCoPE2 quantifies over 3042 proteins in 1490 single monocytes and macrophages in 10 days of instrument time, and the quantified proteins allow us to discern single cells by cell type. Furthermore, the data uncover a continuous gradient of proteome states for the macrophages, suggesting that macrophage heterogeneity may emerge in the absence of polarizing cytokines. Parallel measurements of transcripts by 10× Genomics suggest that our measurements sample 20-fold more protein copies than RNA copies per gene, and thus, SCoPE2 supports quantification with improved count statistics. This allowed exploring regulatory interactions, such as interactions between the tumor suppressor p53, its transcript, and the transcripts of genes regulated by p53.

Conclusions: Even in a homogeneous environment, macrophage proteomes are heterogeneous. This heterogeneity correlates to the inflammatory axis of classically and alternatively activated macrophages. Our methodology lays the foundation for automated and quantitative single-cell analysis of proteins by mass spectrometry and demonstrates the potential for inferring transcriptional and post-transcriptional regulation from variability across single cells.


Conflict of interest statement

The authors declare that they have no competing financial interests.

Correspondence: Correspondence and materials requests should be addressed to nslavov@alum.mit.edu

Figures

Fig. 1
Fig. 1
Optimizing and benchmarking MS analysis with bulk standards modeling SCoPE2 sets. a Conceptual diagram and work flow of SCoPE2. Cells are sorted into multiwell plates and lysed by mPOP [24]. The proteins in the lysates are digested with trypsin; the resulting peptides labeled with TMT, combined, and analyzed by LC-MS/MS. SCoPE2 sets contain reference channels that allow merging single cells from different SCoPE2 sets into a single dataset. The LC-MS/MS analysis is optimized by DO-MS [25], and peptide identification enhanced by DART-ID [26]. b Schematic for the design of a 100xM bulk standards. Monocytes (U937 cells) and embryonic kidney cells (HEK-293) were serially diluted to the indicated cell numbers, lysed, digested, and labeled with tandem-mass tags having the indicated reporter ions (RI). c Comparison of protein fold change between the embryonic kidney cells and monocytes estimated from the small samples and from the carrier samples of a 1xM standard, i.e., 1% sample from the 100xM standard described in a. The relative protein levels measured from bulk samples diluted to single-cell levels are very similar to the corresponding estimates from the isobaric carrier (bulk) samples. d Principal component analysis separates samples corresponding to embryonic kidney cells (HEK-293) or to monocytes (U-937 cells). The small samples (which correspond to bulk cell lysates diluted to single-cell level) cluster with the corresponding carrier samples, indicating that relative protein quantification from all samples is consistent and based on cell type. All quantified proteins were used for this analysis, and each protein was normalized separately for the carrier channels and the small sample channels
Fig. 2
Fig. 2
Sampling elution peaks and co-isolating precursor ions during LC-MS/MS, each labeled peptide elutes from the chromatographic column as an elution peak over a time period typically ranging from 10 to 40 s (5–20 s at mid-height) while its ions are isolated (sampled) for MS2 analysis over much shorter intervals, typically ranging from 5 to 80 ms. If the elution peak is sampled too early (left panel) or too late (right panel), the fraction of the peptide ions used for quantification and sequence identification is smaller compared to sampling the apex (middle panel). To increase the fraction of sampled ions per peptide, we used DO-MS to increase the probability of sampling the apex (Fig. 3c), decreased the elution peak width (see the “Methods” section), and increased the MS2 fill time to 300 ms. SCoPE2 quantifies peptides sequentially, one peptide at a time. For each analyzed peptide, the MS instrument aims to isolate only ions from the peptide by applying a narrow mass filter (m/z isolation window) denoted by a red rectangle in the sketch above. Yet, ions from other peptides might also fall within that window and thus become coisolated, as shown with the blue and orange peptides in the third panel. Since coisolated peptides contribute to the measured reporter ions (RI), coisolation reduces the accuracy of quantification. To minimize coisolation, we reduced the isolation windows to 0.7 Th and improved apex targeting as described above. The success of these optimizations was evaluated by the precursor ion fraction (PIF), a benchmark computed by MaxQuant as an estimate for the purity of the ions isolated for fragmentation and MS2 analysis, Fig. 3d
Fig. 3
Fig. 3
Model system and technical benchmarks for analyzed single cells and proteins. a Monocytes were differentiated into macrophages by PMA treatment, and FACS-sorted cells prepared into 179 SCoPE2 sets, labeled with TMT 11-plex or TMT 16-plex. b Distributions of coefficients of variation (CVs) for the fold changes of peptides originating from the same protein. The CVs for single cells are significantly lower than for the control wells. c A distribution of time differences between the apex of chromatographic peaks and the time when they were sampled for MS2 analysis, see Box 1. Over 80% of ions (shaded box) were sampled within 3 s of their apexes. d A distribution of precursor ion fractions (PIF) for all peptides across all SCoPE2 sets. PIF is a quantitative metric computed by MaxQuant [33] to estimate the degree of coisolation. For most MS2 scans, over 97% of the ions isolated for fragmentation and MS2 analysis belonged to a single precursor (peptide sequence), see Fig. 2. The square and the cross mark, the median, and the mean respectively. e About 35% of MS2 spectra are assigned to peptide sequences at 1% false discovery rate (FDR). The lower mode of the distribution corresponds to samples analyzed when the quadrupole of our instrument had suboptimal ion transmission performance. f The number of identified and quantified peptides and proteins in single cells from SCoPE2 sets analyzed on 60 min nLC gradients. All peptide and protein identifications are at FDR below 1% and are supported by DART-ID [26]. The criteria for stringent filtering are described in the “Methods” section. See Additional file 1: Fig. S3b for the number of peptides and proteins identified from MS spectra alone. The number of proteins with non-zero RI intensity in control wells ranged from 66 to a few hundred in contaminated or cross-labeled control wells that were excluded from the analysis. The x-axes in all violin plots (vertical histograms) correspond to counts, number of MS2 scans in c, number of PSMs in d, and number of SCoPE2 sets in e and f
Fig. 4
Fig. 4
Identifying cell clusters by principal component analysis and evaluating SCoPE2 quantification. a A weighted principal component analysis (PCA) of 1490 single cells using all 3042 proteins quantified across multiple single cells. Missing values were imputed using k-nearest neighbor (k = 3). Cells are colored by cell type. b The cells from the PCA in a are color-coded based on the abundance of monocyte and macrophage genes, defined as the 30 most differential proteins between bulk samples of monocytes and macrophages. c The relative protein levels (macrophage/monocyte protein ratios) estimated from the single cells correlate to the corresponding estimates from bulk samples; ρ denotes Pearson correlation. Proteins functioning in signaling (d) as well as the least abundant proteins quantified by SCoPE2 (e) allow clustering cells by cell type. The protein fold changes between monocytes and macrophages for these protein sets are consistent between single cells and bulk samples, similar to c
Fig. 5
Fig. 5
Single-cell proteomes define a continuum of macrophage polarization states. a Heatmap of the top 20% most variable proteins (609) between two clusters of cells identified by unsupervised spectral clustering of all quantified proteins and cells. The cells are ordered based on their rank in the corresponding Fiedler vector from the spectral clustering, see Eq. 1. The color bars above the heatmap indicate the loadings of each cell in the Fiedler vector. b Gene set enrichment [37] identified overrepresented functions for the proteins enriched within each cell type. These functions are displayed alongside representative protein distributions from each gene set. c The unsupervised spectral analysis from panel a was applied only to the macrophage-like cells, revealing a gradient of macrophage heterogeneity. Cells were ordered based on the corresponding elements of the Fiedler vector, Eq. 1. The bars above the heatmap indicate the Fiedler vector loading of each cell. The top 25% of proteins with the largest fold change between the first 40 cells and last 40 cells are displayed (761 proteins). The single-cell levels of genes in the protein data set previously reported to be enriched in M1 or M2 polarized primary human macrophages [38] are displayed at the bottom; each data point represents the median value over bins of 110 cells (1096 macrophage-like cells total), and error bars denote standard error of data points in each bin
Fig. 6
Fig. 6
Joint analysis of single-cell RNA and protein data. a The number of unique barcode reads per mRNA or ions per peptide/protein for the set of 2383 genes detected in both datasets. Peptides and proteins were filtered to 1% FDR. Proteins from genes not quantified in the RNA data were omitted and vice versa. The higher copy numbers measured for proteins support more reliable counting statistics compared to mRNAs. b Distributions of correlations between ri and pi, where ri is the vector of pairwise correlations of the ith RNA to all other RNAs, and pi is the vector of pairwise correlations of the ith protein to all other proteins [13, 40]. The null distribution corresponds to permuting the order of RNAs and proteins. The two modes of the distribution of correlations for all genes were used to define gene clusters 1 and 2. The correlations between pi and ri were then recomputed just within the space of genes from clusters 1 or from clusters 2 and displayed as separate distributions. c Genes from cluster 1 display similar abundance profiles at both the RNA and protein levels, while genes from cluster 2 display the opposite profiles. The columns correspond to single cells ordered by the first common principal component (CPC 1), which strongly correlate to cell type both for the RNA and for the protein dataset. Cluster 1 genes are ordered by the left CPC 1, and cluster 2 genes by the fold change across the ordered cells from both RNA and protein datasets. df Joint projections of the RNA and protein data by Conos [41]. d Cells analyzed by SCoPE2 are color-coded by cell type while cells analyzed by scRNA-seq are marked gray. e All single cells are color-coded by biological replicate and batch. f Cells are color-coded by the expression of marker genes for monocytes and macrophages
Fig. 7
Fig. 7
Exploring transcriptional and post-transcriptional regulation in single cells. a A total of 1490 cells analyzed by 10× Genomics were ordered based on the loadings of their first common principal component (CPC 1) and the abundance of NCL mRNA displayed. Similarly, 1490 cells analyzed by SCoPE2 were ordered based on CPC 1, and the abundance of NCL protein displayed. Cells having the same rank were paired to display the joint distribution of NCL. bd The same analysis as in a was performed for RHOC, TNFSF13B, and TP53. e Distributions of correlations between p53 protein (or the TP53 RNA) and the RNA levels of its target genes. The target genes are subset into those whose transcription is repressed by p53 (blue dotted boxplots) and those whose transcription is activated by the p53 (red boxplots). The correlations for p53 protein and TP53 mRNA are significantly (p < 0.001) different

Comment in

References

    1. Levy E, Slavov N. Single cell protein analysis for systems biology. Essays Biochem. 2018;62. 10.1042/EBC20180014. - PMC - PubMed
    1. Marx V. A dream of single-cell proteomics. Nat Methods. 2019;16(9):809–812. doi: 10.1038/s41592-019-0540-6. - DOI - PubMed
    1. Shapiro E, Biezuner T, Linnarsson S. Single-cell sequencing-based technologies will revolu- tionize whole-organism science. Nat Rev Genet. 2013;14(9):618. doi: 10.1038/nrg3542. - DOI - PubMed
    1. Grün D, Kester L, Van Oudenaarden A. Validation of noise models for single-cell transcrip- tomics. Nat Methods. 2014;11(6):637. doi: 10.1038/nmeth.2930. - DOI - PubMed
    1. Ben-Moshe S, Itzkovitz S. Spatial heterogeneity in the mammalian liver. Nature Reviews Gastroenterol Hepatol. 2019;16(7):395–410. - PubMed

Publication types