. 2021 Jan 27;13(578):eabb6871.
doi: 10.1126/scitranslmed.abb6871.

Impaired prenatal motor axon development necessitates early therapeutic intervention in severe SMA

Affiliations

Impaired prenatal motor axon development necessitates early therapeutic intervention in severe SMA

Lingling Kong et al. Sci Transl Med. .

Abstract

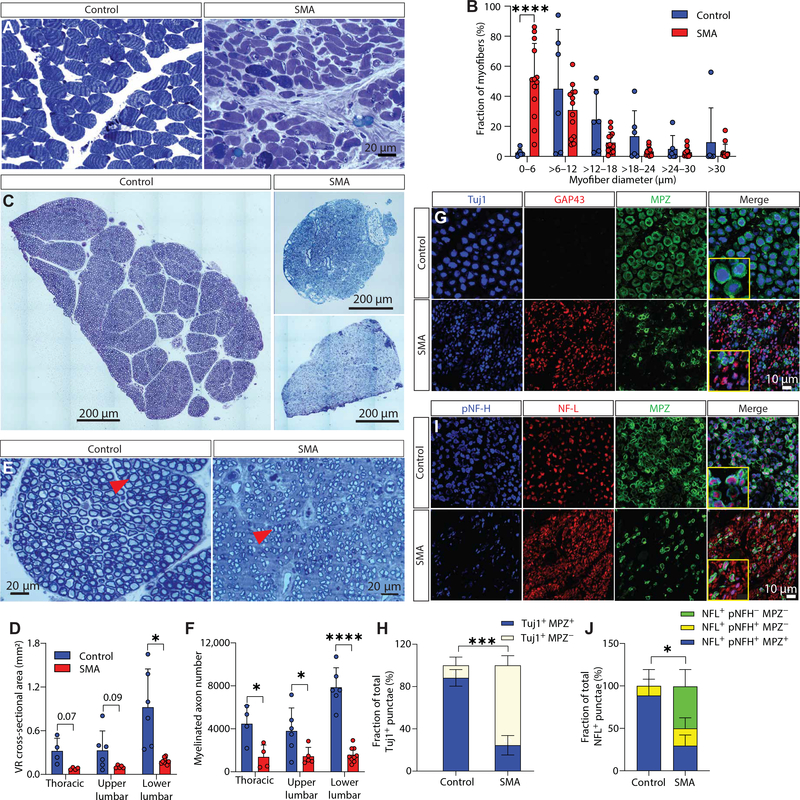
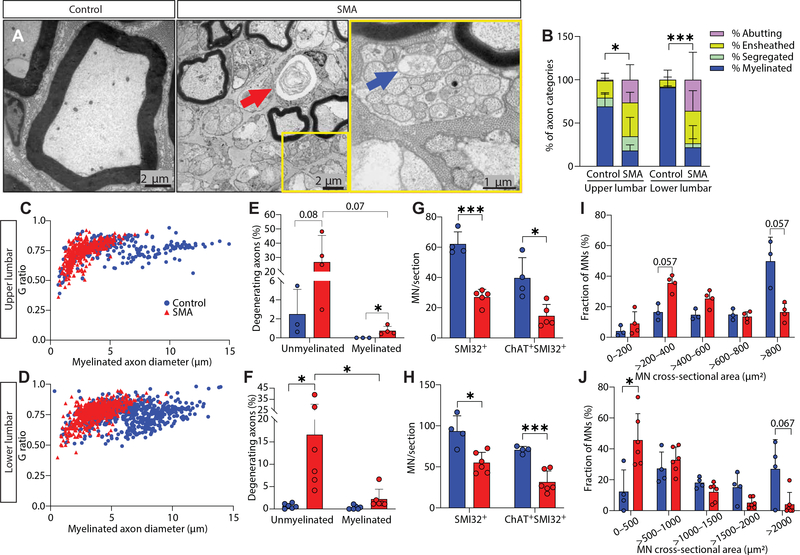
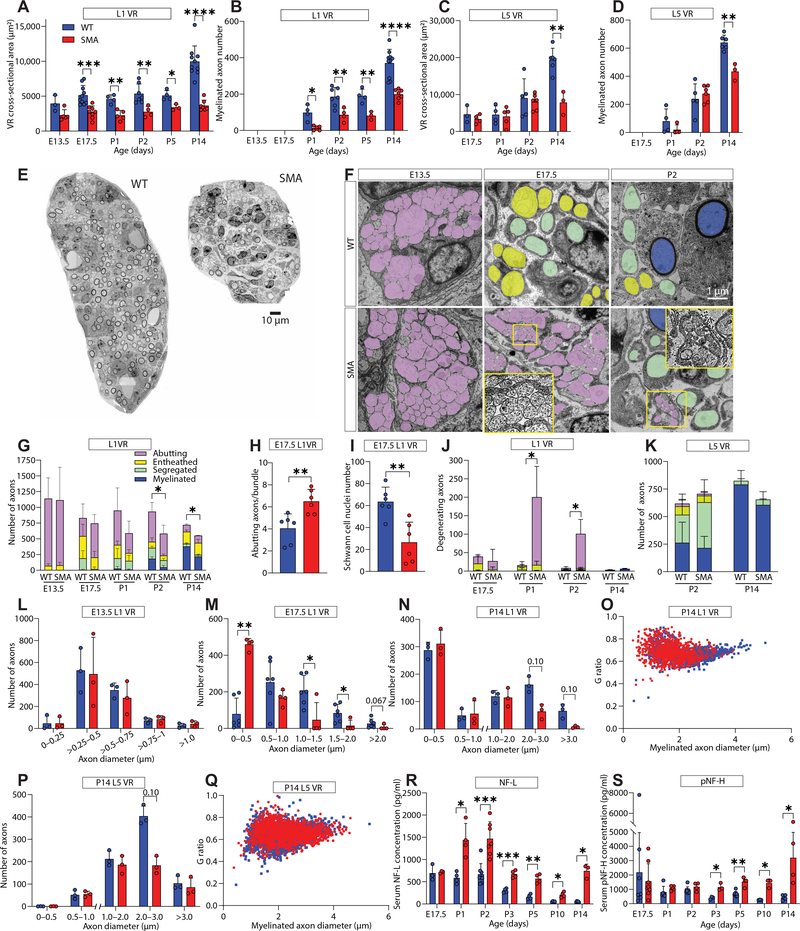
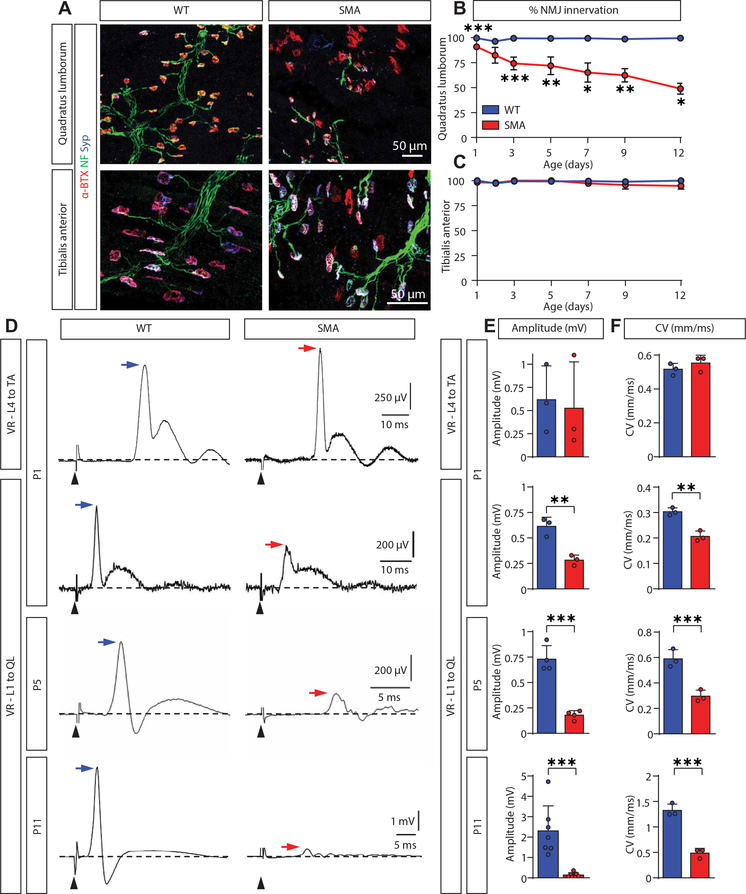
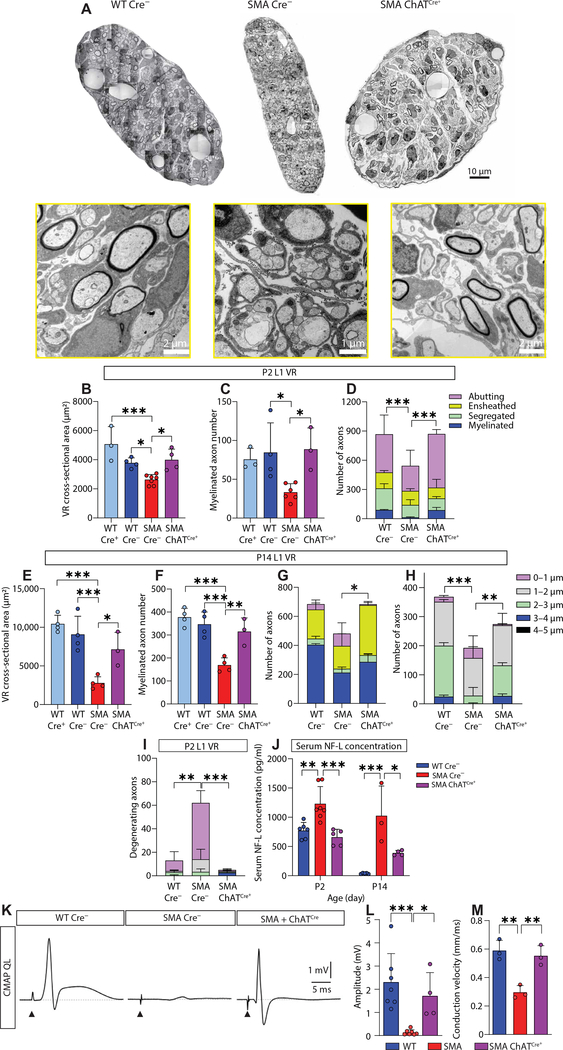
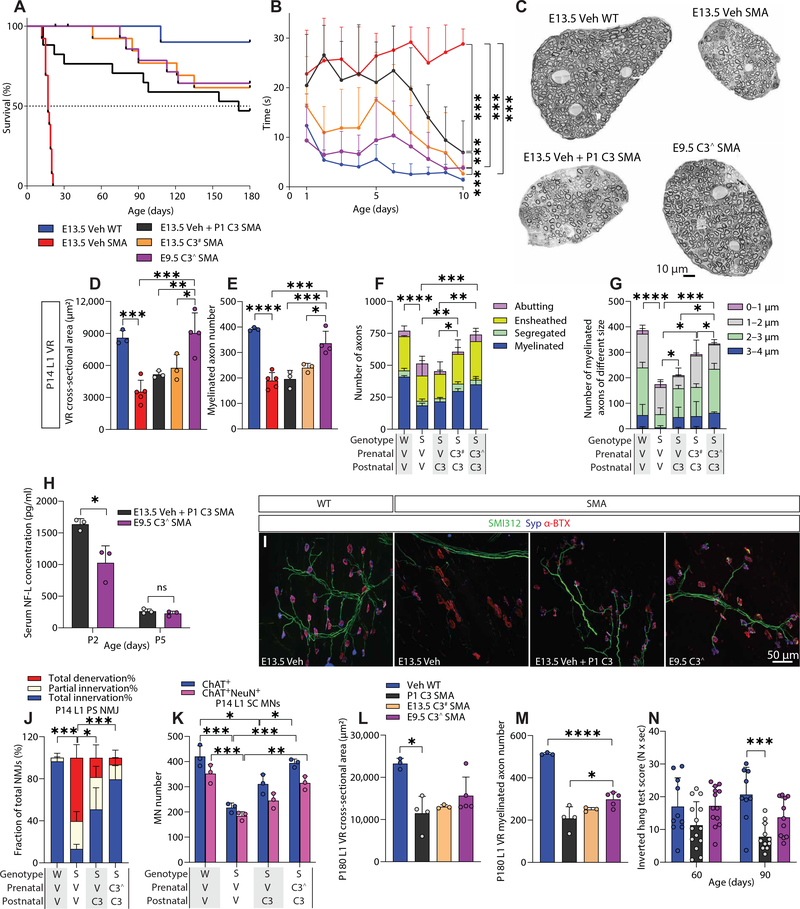
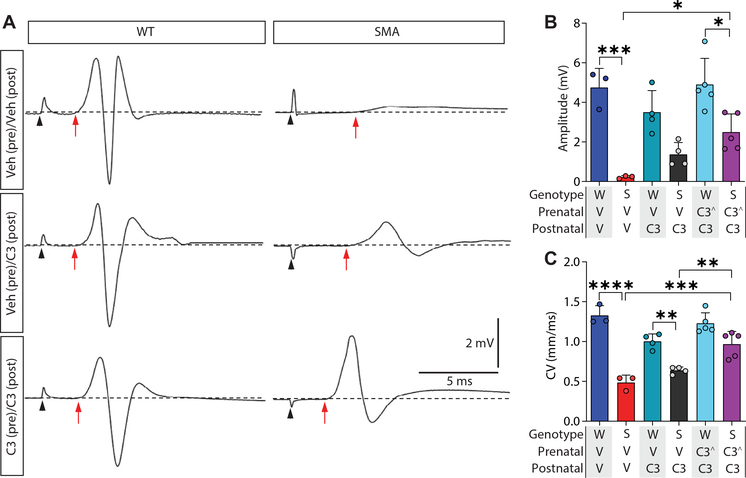
Gene replacement and pre-mRNA splicing modifier therapies represent breakthrough gene targeting treatments for the neuromuscular disease spinal muscular atrophy (SMA), but mechanisms underlying variable efficacy of treatment are incompletely understood. Our examination of severe infantile onset human SMA tissues obtained at expedited autopsy revealed persistence of developmentally immature motor neuron axons, many of which are actively degenerating. We identified similar features in a mouse model of severe SMA, in which impaired radial growth and Schwann cell ensheathment of motor axons began during embryogenesis and resulted in reduced acquisition of myelinated axons that impeded motor axon function neonatally. Axons that failed to ensheath degenerated rapidly postnatally, specifically releasing neurofilament light chain protein into the blood. Genetic restoration of survival motor neuron protein (SMN) expression in mouse motor neurons, but not in Schwann cells or muscle, improved SMA motor axon development and maintenance. Treatment with small-molecule SMN2 splice modifiers beginning immediately after birth in mice increased radial growth of the already myelinated axons, but in utero treatment was required to restore axonal growth and associated maturation, prevent subsequent neonatal axon degeneration, and enhance motor axon function. Together, these data reveal a cellular basis for the fulminant neonatal worsening of patients with infantile onset SMA and identify a temporal window for more effective treatment. These findings suggest that minimizing treatment delay is critical to achieve optimal therapeutic efficacy.


Figures

Fig. 1.
Fig. 1.. Myofiber and VR hypotrophy in patients with SMA.
(A) Toluidine blue–stained cross sections of iliopsoas muscles from CNTL 12–05 (19 months, left) and SMA 10–01 (15 months, right). (B) Histogram of iliopsoas myofiber diameter: controls (ages: 0.03 to 168 months, n = 6) and SMA Type 1 (ages: 1.75 to 36 months, n = 13). (C) Toluidine blue-stained cross sections of L5 VRs from CNTL 17–01 (9 months, left), SMA 98–16 (9 months, upper right), and SMA 17–03 (0.5 months, lower right). (D) Average VR cross-sectional area: controls (ages: 0.03 to 168 months, n = 4 to 6) and SMA Type 1 cases (ages: 0.5 to 72 months, n = 4 to 8). (E) High-magnification images of VRs from CNTL 17–01 (9 months, left) and SMA 98–16 (9 months, right). Arrowheads indicate examples of myelinated axons. (F) Average total VR myelinated axon number. (G) Confocal images of lower lumbar VRs stained with Tuj1 (blue), GAP43 (red), and MPZ (green) from CNTL12–05 (19 months) and SMA11–01 (1.8 months). (H) Percentage of Tuj1+ punctae with or without encircling MPZ staining in controls (ages: 0.03 to 19 months, n = 3) and SMA Type 1 cases (ages: 1.75 to 16 months, n = 5). (I) Confocal images of lower lumbar VRs stained with pNF-H (blue), NF-L (red), and MPZ (green) from CNTL08–01 (4 months) and SMA17–03 (0.5 months). (J) Percentage of pNF-H+/NF-L+ or pNF-H/NF-L+ punctae with or without encircling MPZ staining in VRs of control (ages: 0.03 to 9 months, n = 3) and SMA Type 1 cases (ages: 0.5 to 7 months) (* represents the difference between control and SMA in the pNF-H/NF-L+/MPZ and pNF-H+/NF-L+/MPZ+ groups). Data represent means and SD. Statistical analysis was performed using Mann-Whitney test for (B) and unpaired t test for (D), (F), (H), and (J). Significance: *P ≤ 0.05, ***P < 0.001, ****P < 0.0001.
Fig. 2.
Fig. 2.. Immature morphologies of SMA VR axons.
(A) EM images of axons in VRs from CNTL12–05 (19 months, left) and SMA11–01 (1.8 months, middle and right). The right panel is a higher-magnification view of the yellow square in the middle panel. The red arrow indicates a degenerating myelinated axon; the blue arrow indicates a degenerating, abutting axon. (B) Average percentage of axons of different categories in upper lumbar VRs: controls (ages: 0.03 to 36 months, n = 3) and SMA Type 1 (ages: 1.75 to 72 months, n = 5) and lower lumbar VRs: controls (ages: 0.03 to 168 months, n = 6) and SMA Type 1 (ages: 0.5 to 72 months, n = 6) (* indicates significance for the myelinated axon group). (C and D) Axon diameters and G ratios of VR motor axons in upper lumbar (CNTL: n = 3, SMA: n = 4) (C) and lower lumbar (CNTL: n = 6, SMA: n = 6) (D) VRs. (E and F) Average percentage of degenerating unmyelinated and myelinated axons in control and SMA Type 1 upper lumbar (CNTL, ages: 0.03 to 36 months, n = 3; SMA, ages: 1.75 to 72 months, n = 4) (E) and lower lumbar (CNTL: ages: 0.03 to 168 months, n = 6; SMA, ages: 0.5 to 72 months, n = 6) (F) VRs. (G and H) Number of MNs per section determined by NF-H (SMI32) and ChAT staining in upper lumbar spinal cord [control (ages: 0.03 to 168 months, n = 4) and SMA Type 1 (ages: 1.75 to 72 months, n = 5)] (G) and lower lumbar spinal cord [control (ages: 0.03 to 168 months, n = 4) and SMA (ages: 0.5 to 72 months, n = 6)] (H). (I and J) MN size distribution in the upper lumbar spinal cord [control (ages: 0.03 to 9 months, n = 3) and SMA Type 1 (ages: 1.75 to 4 months, n = 4)] (I) and lower lumbar spinal cord [control (ages: 0.03 to 19 months, n = 4) and SMA (ages: 0.5 to 16 months, n = 6)] (J). Data represent means and SD. Statistical analysis was performed using unpaired t test for (B) to (H) and Mann-Whitney test for (I) and (J). Significance: *P ≤ 0.05; ***P < 0.001.
Fig. 3.
Fig. 3.. Impaired motor axon radial growth and sorting begin prenatally and are associated with rapid neonatal degeneration in SMA mice.
(A to D) VR cross-sectional area (A and C) and VR myelinated axon number in L1 (A and B) and L5 (C and D) VRs of SMAΔ7 mice (WT: n = 3 to 10; SMA: n = 3 to 8). (E) Representative reconstructed EM images of L1 VRs acquired at 8000× from WT and SMA mice at P2. (F) Representative EM images of L1 VR axons from E13.5 to P2. Pseudocoloring: pink = abutting axons; yellow = ensheathed, unmyelinated axon; green = segregated, unmyelinated axons; blue = myelinated axons. (G) Total number of axons of different morphological types in L1 VRs from E13.5 to P14 (WT: n = 3 to 6; SMA: n = 3 to 6) (* indicates significance for the total number of axons). (H and I) The average number of abutting axons per bundle (H) and number of Schwann cell nuclei per L1 VR (I) at E17.5 (n = 6 each). (J) Total number of degenerating axons from each axon category in L1 VRs from E17.5 to P14 (n = 3 to 4 in each group) (* indicates significance for the degenerating, abutting axon group). (K) Total number of axons of different morphological types in L5 VRs at P2 and P14 (n = 3 each). (L to N) Histogram of axon diameter in L1 VRs at E13.5 (n = 3 each) (L), E17.5 (WT: n = 6, SMA: n = 4) (M), and P14 (n = 3 each) (N). (O) Axon diameter-G ratio histogram of myelinated axons in L1 VRs at P14 (n = 3 each). (P) Histogram of diameter of all axons in L5 VRs at P14 (n = 3 each). (Q) Axon diameter-G ratio histogram of myelinated axons in L5 VRs at P14 (n = 3 each). (R and S) Serum NF-L (WT: n = 3 to 8; SMA: n = 3 to 7) (R) and pNF-H (n = 3 to 8 each) (S) concentrations in SMAΔ7 mice from E17.5 to P14. Data represent means and SD. Statistical analysis was performed using unpaired t test in (A) to (D), (G) to (K), (R), and (S) and Mann-Whitney test in (L) to (N) and (P). Significance: *P ≤ 0.05; **P < 0.01; ***P < 0.001, ****P < 0.0001.
Fig. 4.
Fig. 4.. Time course of NMJ denervation and electrophysiological abnormalities of vulnerable SMA motor neuron axons.
(A) NMJ staining with α-bungarotoxin (α-BTX, red), synaptophysin (Syp, blue), and neurofilament (NF, green) in QL and TA muscles in P11 WT and SMA mice. (B and C) Quantification of NMJ innervation in QL (B) and TA (C) muscles in WT (n = 3) and SMA (n = 3 to 5) mice from P1 to P12. (D) CMAP recordings from the TA muscle after L4 VR stimulation at P1 and CMAP recordings from the QL muscle after L1 VR stimulation in WT and SMA mice at P1, P5, and P11 and in WT and SMA mice. Arrows indicate maximum CMAP amplitude. Black arrowheads indicate the stimulus artifact. Scale bars shown in SMA also apply for the corresponding WT. (E and F) Quantification of CMAP amplitude (E) and nerve CV (F) for QL and TA muscle recordings shown in (D) (n = 3 to 7 each). Data represent means and SD. Statistical analysis in (B), (C), (E), and (F) was performed using unpaired t test. Significance: *P ≤ 0.05; **P < 0.01; ***P < 0.001.
Fig. 5.
Fig. 5.. Selective restoration of SMN in motor neurons restores motor axon development and function in SMA mice.
(A) Representative reconstructed EM images and single higher-magnification images of L1 VRs in WT, SMA, and ChATCre+ SMA mice at P2. (B to D) L1 VR size (n = 3 to 7 each) (B), myelinated axon number (n = 3 to 6 each) (C), and number of axons of different categories (n = 3 each) (D) at P2 (* indicates significance for the myelinated axon group). (E to H) L1 VR size (E), myelinated axon number (F), number of axons of different categories (* indicates significance for ensheathed axons) (G), and diameter of axons (* indicates significance for axons of the 2–3 μm group) (H) at P14 (n = 3 each). (I) Number of degenerating axons in L1 VRs at P2 (n = 3 each, * indicates significance for the degenerating abutting axons). (J) Serum NF-L concentrations at P2 (n = 5 to 7 each) and P14 (n = 3 to 5 each). (K) CMAP recordings from the QL muscle after stimulation of the L1 VR at P11. Arrowheads indicate stimulus artifact. (L and M) Quantification of CMAP amplitude (n = 4 to 7 each) (L) and nerve CV (n = 3 each) (H). All data represent means and SD. Statistical analysis was performed using one-way ANOVA, corrected by Dunnett’s multiple comparisons test in (B) to (D), (F) to (J), (L), and (M). Significance: *P ≤ 0.05; **P < 0.01; ***P < 0.001.
Fig. 6.
Fig. 6.. Prenatal treatment with SMN-C3 prevents neonatal axon degeneration, enhances axon development, and improves motor behavior of SMA mice.
(A and B) Survival (A) and righting time (B) of WT mice treated with vehicle (pre- and postnatally, n = 10), SMA mice treated with vehicle (pre- and postnatally, n = 13 to 14), SMA mice treated with vehicle prenatally and SMN-C3 postnatally (n = 17 to 18), SMA mice treated with SMN-C3 prenatally (starting at E13.5#, n = 13 to 14) and postnatally (n = 14), and SMA mice treated with SMN-C3 prenatally (starting at E9.5^) and postnatally (n = 16 to 19) (* represents significance between curves). (C) Representative EM reconstructed images of L1 VRs at P14. (D to G) L1 VR size (n = 3 to 5) (D), myelinated axon number (n = 3 to 5) (E), types of axons (n = 3) (F, * indicates significance of the myelinated axon category between differently treated groups.), and myelinated axon diameter (n = 3) (G, * indicates significance of myelinated axons between 2–3 μm in diameter between the differently treated groups) at P14. (H) Serum NF-L concentrations at P2 or P5 (n = 3 each). (I) Confocal images of P14 L1 PS muscle NMJs stained with SMI312 (blue), synaptophysin (purple), and α-BTX (red). (J) NMJ innervation in L1 PS muscle at P14 (n = 3 each, * indicates significance of the total innervation% category between differently treated groups). (K) MN number in the L1 spinal cord segment at P14 (n = 3 each). (L and M) L1 VR size (E) and myelinated axon number (F) at P180 (n = 3 to 5). (N) Hang time test at P60 and P90 (n = 10 to 14). W, WT; S, SMA; V, vehicle; C3#, SMN-C3 starting at E13.5; C3^, SMN-C3 starting at E9.5. In (A), statistical analysis was performed using log-rank test. In all other graphs, data represent means and SD. Statistical analysis was performed in (B) using random effects regression test; in (D) to (G) and (J) to (N) using one-way ANOVA with Tukey’s post hoc test; and in (H) using unpaired t test. Significance: *P ≤ 0.05; **P < 0.01; ***P < 0.001, ****P < 0.0001.
Fig. 7.
Fig. 7.. Prenatal treatment with SMN-C3 improves motor axon function.
(A) CMAP recordings from the QL muscle after L1 VR stimulation at P11. Red arrows indicate shortest latency of CMAP response. Black arrowheads indicate stimulus artifact. (B and C) Quantification of CMAP amplitudes (n = 3 to 5) (B) and nerve CVs (n = 3 to 5) (C) from WT (W) and SMA (S) mice receiving vehicle (V) or SMN-C3 treatment starting prenatally at E9.5 (C3^) or postnatally at P1. In (B) and (C), statistical analysis was performed using one-way ANOVA with Tukey’s post hoc test. Significance: *P ≤ 0.05; **P < 0.01; ***P < 0.001, ****P < 0.0001.

Similar articles

Cited by

References

    1. Lefebvre S, Burglen L, Reboullet S, Clermont O, Burlet P, Viollet L, Benichou B, Cruaud C, Millasseau P, Zeviani M, Le Paslier D, Frézal J, Cohen D, Weissenbach J, Munnich A, Melki J, Identification and characterization of a spinal muscular atrophy-determining gene. Cell 80, 155–165 (1995). - PubMed
    1. Lorson CL, Hahnen E, Androphy EJ, Wirth B, A single nucleotide in the SMN gene regulates splicing and is responsible for spinal muscular atrophy. Proc. Natl. Acad. Sci. U.S.A. 96, 6307–6311 (1999). - PMC - PubMed
    1. Monani UR, Lorson CL, Parsons DW, Prior TW, Androphy EJ, Burghes AH, McPherson JD, A single nucleotide difference that alters splicing patterns distinguishes the SMA gene SMN1 from the copy gene SMN2. Hum. Mol. Genet. 8, 1177–1183 (1999). - PubMed
    1. Finkel RS, McDermott MP, Kaufmann P, Darras BT, Chung WK, Sproule DM, Kang PB, Foley AR, Yang ML, Martens WB, Oskoui M, Glanzman AM, Flickinger J, Montes J, Dunaway S, O’Hagen J, Quigley J, Riley S, Benton M, Ryan PA, Montgomery M, Marra J, Gooch C, De Vivo DC, Observational study of spinal muscular atrophy type I and implications for clinical trials. Neurology 83, 810–817 (2014). - PMC - PubMed
    1. Kolb SJ, Coffey CS, Yankey JW, Krosschell K, Arnold WD, Rutkove SB, Swoboda KJ, Reyna SP, Sakonju A, Darras BT, Shell R, Kuntz N, Castro D, Parsons J, Connolly AM, Chiriboga CA, McDonald C, Burnette WB, Werner K, Thangarajh M, Shieh PB, Finanger E, Cudkowicz ME, McGovern MM, McNeil DE, Finkel R, Iannaccone ST, Kaye E, Kingsley A, Renusch SR, McGovern VL, Wang X, Zaworski PG, Prior TW, Burghes AHM, Bartlett A, Kissel JT; NeuroNEXT Clinical Trial Network on behalf of the NN101 SMA Biomarker Investigators, Natural history of infantile-onset spinal muscular atrophy. Ann. Neurol. 82, 883–891 (2017). - PMC - PubMed

Publication types

Substances