. 2021 Jan 27;12(1):614.
doi: 10.1038/s41467-020-20752-6.

IDH1 mutations induce organelle defects via dysregulated phospholipids

Affiliations

IDH1 mutations induce organelle defects via dysregulated phospholipids

Adrian Lita et al. Nat Commun. .

Abstract

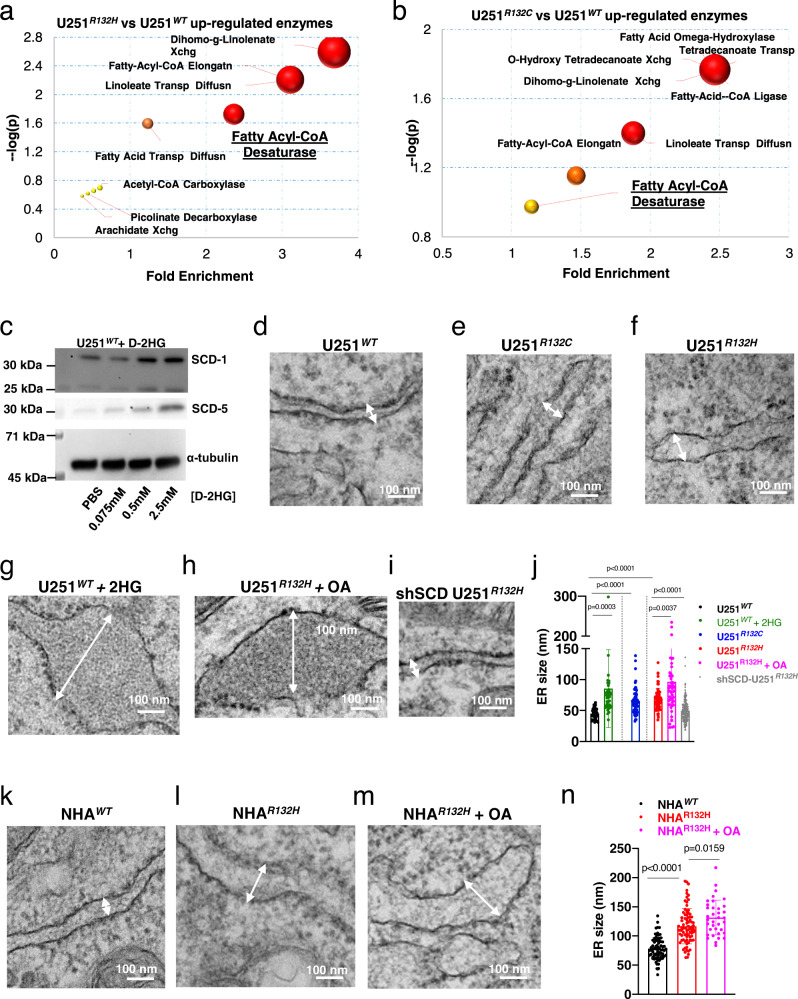
Infiltrating gliomas are devastating and incurable tumors. Amongst all gliomas, those harboring a mutation in isocitrate dehydrogenase 1 mutation (IDH1mut) acquire a different tumor biology and clinical manifestation from those that are IDH1WT. Understanding the unique metabolic profile reprogrammed by IDH1 mutation has the potential to identify new molecular targets for glioma therapy. Herein, we uncover increased monounsaturated fatty acids (MUFA) and their phospholipids in endoplasmic reticulum (ER), generated by IDH1 mutation, that are responsible for Golgi and ER dilation. We demonstrate a direct link between the IDH1 mutation and this organelle morphology via D-2HG-induced stearyl-CoA desaturase (SCD) overexpression, the rate-limiting enzyme in MUFA biosynthesis. Inhibition of IDH1 mutation or SCD silencing restores ER and Golgi morphology, while D-2HG and oleic acid induces morphological defects in these organelles. Moreover, addition of oleic acid, which tilts the balance towards elevated levels of MUFA, produces IDH1mut-specific cellular apoptosis. Collectively, these results suggest that IDH1mut-induced SCD overexpression can rearrange the distribution of lipids in the organelles of glioma cells, providing new insight into the link between lipid metabolism and organelle morphology in these cells, with potential and unique therapeutic implications.


Conflict of interest statement

The authors declare the following competing interests: P.P. is the owner of ACIS, LLC, a company developing BCAbox. A.K. is an employee of ACIS, LLC. The remaining authors declare no competing interests.

Figures

Fig. 1
Fig. 1. Global biomolecular changes induced by IDH mutation in live cells at the organellar level.
a Schematic representation of the strategy for the study. Figure was created using Biorender. b Representative Raman spectra of live cells obtained using our newly developed method (black, ER; red, Golgi; green, mitochondria; blue, lysosomes). cf Distribution of lipid unsaturation parameter, sphingomyelin and TCP parameter in U251WT and U251R132H cells, represented for each cell and organelle to show the heterogeneity in lipid distribution across cells and organelles. Each point represents the average of three measurements in one organelle of a live cell. Between 10-30 organelles are depicted for the distribution of the parameters per organelle and the data are also available in Source Data file. Light ovals depict U251WT organelle data; dark ovals, the U251R132H data. g The distribution of the lipid unsaturation parameter becomes more homogeneous after addition of AGI5198, the inhibitor of IDH1 mutation (yellow ovals). Each point represents an average of three measurements in one organelle of a live cell. h, i Averaged sphingomyelin and LSU levels for ER and Golgi apparatus depicting the changes in this parameter as a function of the mutations. For h, sphingomyelin values were determined from the n = 15 (U251R132C) n = 10 (U251WT) and n = 16 (U251R132H) biologically independent samples corresponding to the ER, while from n = 21 (U251R132C), n = 22 (U251WT) and n = 18 (U251R132H) biologically independent samples corresponding to the Golgi apparatus. Data are presented as mean values ± SD. P values were determined by a one-way ANOVA followed by Tukey’s test for multiple comparisons for ER and Golgi. For i, LSU values were determined from the n = 15 (U251R132C), n = 10 (U251WT), and n = 14 (U251R132H) biologically independent samples corresponding to the ER, while from n = 21 (U251R132C), n = 15 (U251WT), and n = 17 (U251R132H) biologically independent samples corresponding to the Golgi apparatus. Data are presented as mean values ± SD. P values were determined via a one-way ANOVA followed by Tukey’s test for multiple comparisons for ER and Golgi. j Averaged LSU parameter in ER of both mutants of IDH1 as a function of AGI5198. LSU parameter values were determined from n = 16 (U251R132H), n = 14 (U251R132H + AGI5198), n = 15 (U251R132C), and n = 17 (U251R132C + AGI5198) biologically independent samples corresponding to the ER. p values were obtained from a two-sided t-test with Welch correction for each mutant (R132H and R132C) vs AGI5198 treatment. k Raman spectra of pure standards oleic (red) and linoleic acid (black) to show differences in the LSU parameter.
Fig. 2
Fig. 2. Endoplasmic reticulum (ER) and Golgi apparatus-specific lipid changes due to IDH1 mutation.
Comparison of the lipidomic profiles of ER from U251WT (black) and U251R132H (red) (a) or U251R132C (blue) (b) revealed a higher relative abundance of saturated and monounsaturated fatty acids in U251R132H cells only, similar to the LSU parameter. Black bars represent values for U251WT cells (n = 3) while the red and blue represent U251R132H (n = 3) and U251R132C (n = 3), respectively. The mean values and standard deviation (error bars) are represented. Statistical values are represented as: ns not significant; *p ≤ 0.05; **p ≤ 0.005; ***p ≤ 0.0005; ****p ≤ 0.0001 and were determined using two-sided student t-test with Welch correction. c Heatmap of phospholipids extracted from the ER of U251WT, U251R132H, and U251R132C cells shows the 30 most significantly altered features. d Heatmap with the most significant phospholipids from the targeted Golgi lipidomics showed that most phospholipids containing saturated or monounsaturated phospholipids are depleted in Golgi. Heatmaps were created using MetaboAnalyst. e Volcano plot of the lipidomic assay comparing U251WT and U251R132H/C combined. 2HG appears to be the most significant metabolite upregulated in the mutant cells, whereas phospholipids (PEs) (red dots) are among the most downregulated lipids in mutant cells. P values were obtained via two-sided Student’s t-test followed by FDR correction. f Relative intensity of PEs that contain zero or one double bond are downregulated in mutant cells (light red and light blue bars) compared with wild-type (black bars) and are partially restored by adding AGI5198 inhibitor (dark red and dark blue bars). Mean values and SD are represented. Error bars represent standard deviation of n = 3 independent experiments. One-way ANOVA test with Tukey’s correction for multiple comparisons was conducted using GraphPad Prism 8.2.1. g Z-stacked Golgi reconstructed image from fluorescence microscopy shows the area of colocalization between Golgi apparatus (red) and saturated fatty acids (green). Scale is 10 microns. Images were collected using fast frame switching in lattice SIM mode with 0.1 um z-step size, 0.03 um X–Y pixel size, and processed using the SIM module of the Zen software Images are representative of n = 3, independent experiments. hj Fluorescence microscopy shows colocalization (yellow, middle panel) of saturated fatty acids (green) with the Golgi apparatus (red) in U251R132H cells (i) and the loss of colocalization in the presence of the inhibitor AGI5198 (j). Scale is 5 microns. At least five images per group were taken for each experiment. Images are representative of n = 3, independent experiments.
Fig. 3
Fig. 3. Stearyl CoA desaturase (SCD) overexpression is induced by D-2HG and is responsible for IDH1mut-induced defects in ER.
a, b Predicted enzymes from Golgi-specific lipids identified from U251R132H/C by mass spectrometry. Ratios of lipid levels between U251R132H/C and U251WT were used in MetaboAnalyst to predict enzymes most affected. c Western blot analysis show SCD-1/5 expression upon addition of 0.5–2.5 mM D-2HG to U251WT. Uncropped blots are available in Source data. Experiments were performed in duplicates (SCD-5) or triplicates (SCD-1). df Transmission electron micrographs of U251WT, U251R132H, and U251R132C show significant changes in the ER structure. Arrows indicate the distance between two ER membranes. g TEM micrograph showing high resolution images of ER U251WT upon addition of D-2HG, which leads to ER dilation. h TEM micrograph showing high resolution images of ER U251R132H upon addition of oleic acid, which further leads to ER dilation. i ER morphology in U251R132H cells recovered upon knocking down of hSCD via short hairpin RNA. j Quantification of ER dilation was done via measurements of the distance between the two ER membrane. U251WT (black symbols) (n = 39), U251R132C (n = 69, blue symbols), U251R132H (n = 66, red symbols) U251WT + D-2HG (n = 39, green symbols), U251R132H + oleic acid (OA, n = 51, magenta symbols), U251R132H + shSCD (n = 198, gray symbols). km TEM micrograph showing high resolution images of ER in NHAWT, NHAR132H, and NHAR132H treated with oleic acid cells. n. Quantification of ER lumen enlargement via measurements of the distance between the two ER membrane in normal human astrocytes (NHA). NHAWT (black symbols) (n = 79), NHAR132H (n = 80, red symbols), NHAR132H + oleic acid (OA, n = 36, magenta symbols). For j and n the mean values ± SD are presented. p values from a one-way ANOVA followed by Tukey’s test for multiple comparisons were obtained using GraphPad Prism 8.2.1 for comparison of each group. Data are available in Source Data file. At least 10 images per organelles were taken. Micrographs are representative of three independent experiments.
Fig. 4
Fig. 4. D-2HG levels and SCD expression are responsible for IDH1mut-induced membrane defects in Golgi.
ad Transmission electron micrographs of U251WT, U251R132C U251R132H, and U251R132H + AGI5198 show significant changes in the Golgi structure. Arrows indicate the altered region of Golgi stacks. e Golgi size quantification of U251WT (n = 63, black symbols), U251R132C (n = 59, blue symbols), U251R132H (n = 63, red symbols), and U251R132H + AGI5198 (n = 90, dark red symbols). Statistical values are represented on the graph. f, g Addition of D-2HG in U251WT was enough to cause Golgi dilation. h Golgi size quantification of U251WT (n = 63, black symbols), U251WT + D-2HG (n = 90, green symbols), and U251R132H (n = 63, red symbols). ij Comparison between Golgi of U251R132H cells and the U251R132H cells that lack hSCD showed a restored Golgi structure. k Inhibiting the hSCD enzyme with CAY10566 led to partial restoration of Golgi structure. l Golgi size quantification of U251R132H (n = 63, red symbols), U251R132H + CAY10566 (n = 69, orange symbols), and siRNA hSCD U251R132H (n = 84, cyan symbols). For e, h, l the mean values and SD are presented and the p values obtained from a one-way ANOVA tests with Tukey’s correction for multiple comparisons were conducted using GraphPad Prism 8.2.1. At least 10 images per organelles were taken. Data are available in Source Data file. Micrographs are representative of three independent experiments.
Fig. 5
Fig. 5. Validation of SCD expression, phospholipid imbalance, and Golgi dilation in patient tissue and their impact on cellular function.
a Consensus clustering of 22 genes from fatty acid synthesis pathway reveled clustering of oligodendroglioma samples with highest mRNA levels for SCD-1 and SCD-5 enzymes. b mRNA levels of SCD-1 and SCD-5 from The Cancer Genome Atlas show increased expression in these transcripts in IDH1mut (n = 218) tissue compared with IDH1WT (n = 68) in low-grade gliomas (LGG). c mRNA levels of SCD-1 and SCD-5 were inversely correlated with the molecular subtypes in the following order: oligodendroglioma (n = 161), astrocytoma (n = 194), and GBM (n = 152). Figure was created using GlioVis data portal. Box plots indicate median (middle line), 25th, 75th, percentiles (box), and 5th and 95th percentile (whiskers) as well as outliers. For b and c pairwise t-test comparisons between group levels with Bonferroni correction was used to determine the p value shown on the plot. df TEM micrograph showing high resolution images of ER for tissue from three patient samples; two oligodendroglioma and one glioblastoma multiforme. At least 10 images per organelles were taken. Micrographs are representative of three independent experiments. g Distance measurements of ER membranes from tissues of: Patient 4 (GBM, black symbols, n = 106), Patient 1 margin (red symbols, n = 17), Patient 1 tumor (blue symbols, n = 37), and Patient 3 (green symbols, n = 100). One-way ANOVA followed by Tukey’s test for multiple comparisons was conducted using GraphPad Prism 8.2.1. Data are plotted as mean ± SD. hk Transmission electron micrographs of Golgi in tissue from different grades of oligodendroglioma compared with glioblastoma multiforme (GBM) (IDH1WT) show specific dilation of this organelle (red arrows) in the oligo tumor samples only. At least 10 images per organelles were taken. Micrographs are representative of three independent experiments. l, m Increased MUFA- phospholipids in the Golgi of a tumor from patient 1 compared with the margin. Data are shown as mean ± SEM and are representative of two technical replicates. n Reactome pathways for Golgi proteins extracted from tissue of Patient 1 (black) U251R132H/WT (red), U251R132C/WT (blue). The tables are describing the statistics for the top three pathways altered based upon their p value for the three comparisons. P values were corrected for the multiple testing (Benjamini–Hochberg procedure) that arises from evaluating the submitted list of identifiers against every pathway. Note that both variants were analyzed separately; however, their results were similar for the top three pathways. The graphs depict the significance of the specific pathways under the membrane trafficking with the corresponding p values for three comparisons Patient 1 (black bars), U251R132H/WT (red bars), U251R132C/WT (blue bars). Data were plotted using Reactome-based analysis report tables, which are located in Supplementary Tables 2–4.
Fig. 6
Fig. 6. Addition of MUFA leads to IDH1mut-specific cell death.
a Western blot analysis of fatty acid synthesis and regulation proteins in a panel of patient-derived cell lines. Uncropped blots are available in Source Data. Experiments were conducted in triplicates. b mRNA levels of SCD-1 are is higher in TS603 (IDH1R132H) compared with GSC827 (IDH1WT) as determined by RT-PCR. The data have been obtained from three biologically independent samples and is plotted as mean ± SD. P = 0.036 was obtained using two-sided Student’s t-test with Welch’s correction. c Photomicrographs of TS603 neurospheres in absence and presence of oleic acid showing the cell death. Scale bar corresponds to 100 microns. At least five images were taken for each group. dg Oleic acid treatment led to decreased viability in patient-derived cell lines BT142, TS603, and NCH1681, and it was more pronounced than in IDHWT (GSC827). The average value of five biological replicates is shown along with the standard deviation. p values were determined via a two-way ANOVA for multiple comparisons followed by Sidak correction for alpha = 0.05. h, i EC50 measurements of oleic acid. from CCK-8 assays, which show greater sensitivity of IDH1mut cells (green, blue, and red lines) to oleic acid supplementation compared with IDH1WT neutrospheres (gray line). The average value of four (GSC827, NCH1681) or five (BT142 and TS603) biological replicates is shown along with the standard deviation. j, k In IDH1WT cells (GSC827), there was no change in cellular apoptosis measured 48 h after addition of oleic acid. In patient-derived IDH1mut cells (TS603) 43% of cells underwent late apoptosis as measured by FITC Annexin V Apoptosis Detection Kit.
Fig. 7
Fig. 7. Proposed model for IDH1mut-induced phospholipid imbalance and cellular function.
IDH1WT cells display homeostatic levels of phospholipids and basal expression of hSCD enzymes. IDH1mut cells induce high levels of hSCD enzymes, which alter the phospholipid balance and the morphology of ER and Golgi. Shown with red arrows is a potential way to exploit this alteration, by addition of oleic acid a prevalent MUFA, which leads to apoptosis. Dashed rectangle signifies the fact that hSCD enzymes are localized within the ER membrane.

References

    1. Hanahan D, Weinberg RobertA. Hallmarks of cancer: the next generation. Cell. 2011;144:646–674. doi: 10.1016/j.cell.2011.02.013. - DOI - PubMed
    1. Yan H, et al. IDH1 and IDH2 mutations in gliomas. N. Engl. J. Med. 2009;360:765–773. doi: 10.1056/NEJMoa0808710. - DOI - PMC - PubMed
    1. Dang L, et al. Cancer-associated IDH1 mutations produce 2-hydroxyglutarate. Nature. 2009;462:739–744. doi: 10.1038/nature08617. - DOI - PMC - PubMed
    1. Louis DN, et al. The 2016 World Health Organization classification of tumors of the central nervous system: a summary. Acta Neuropathol. 2016;131:803–820. doi: 10.1007/s00401-016-1545-1. - DOI - PubMed
    1. Louis, D. N. et al. cIMPACT-NOW update 6: new entity and diagnostic principle recommendations of the cIMPACT-Utrecht meeting on future CNS tumor classification and grading. Brain Pathol.10.1111/bpa.12832 (2020). - PMC - PubMed

Publication types

MeSH terms