. 2021 Jan 27;12(1):608.
doi: 10.1038/s41467-020-20801-0.

Niche derived netrin-1 regulates hematopoietic stem cell dormancy via its receptor neogenin-1

Affiliations

Niche derived netrin-1 regulates hematopoietic stem cell dormancy via its receptor neogenin-1

Simon Renders et al. Nat Commun. .

Abstract

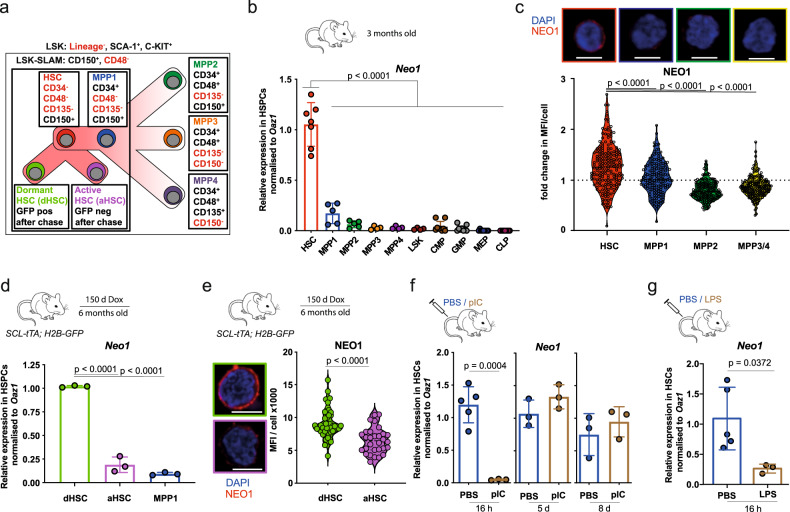
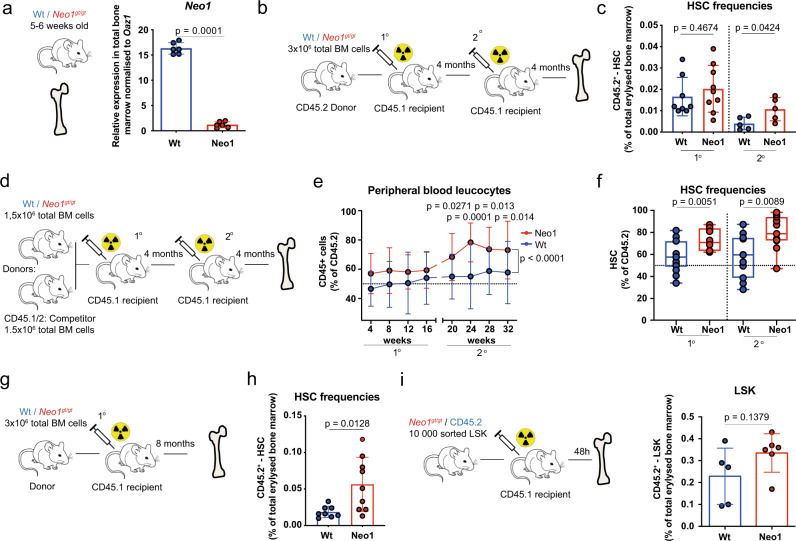
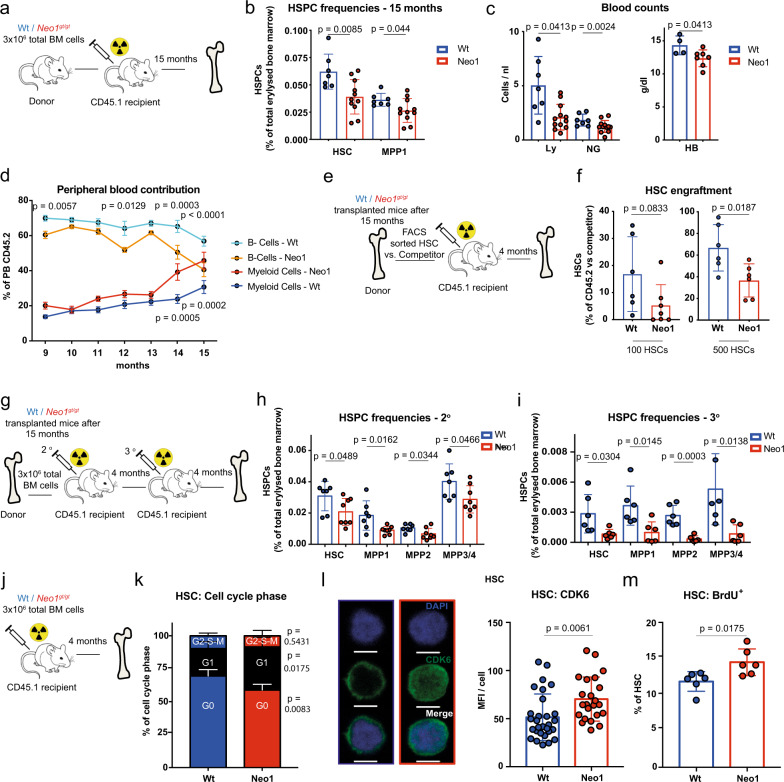
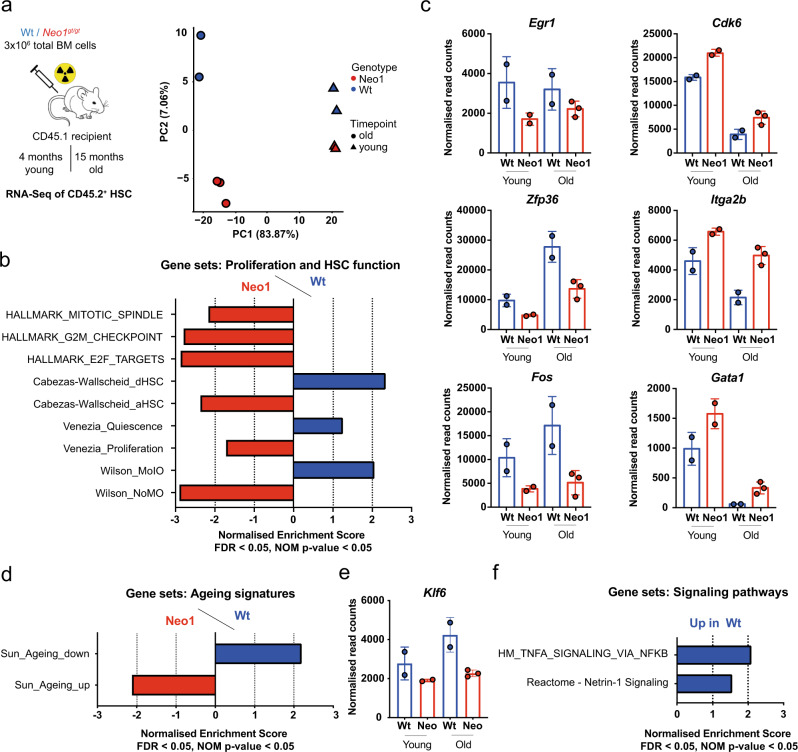
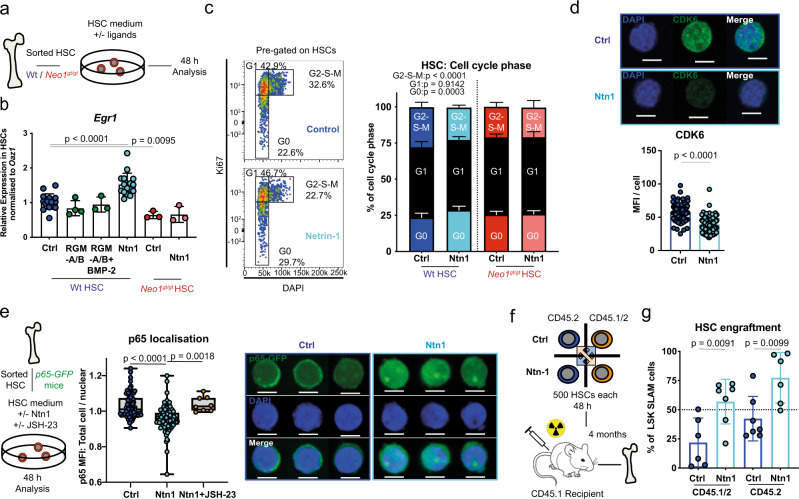
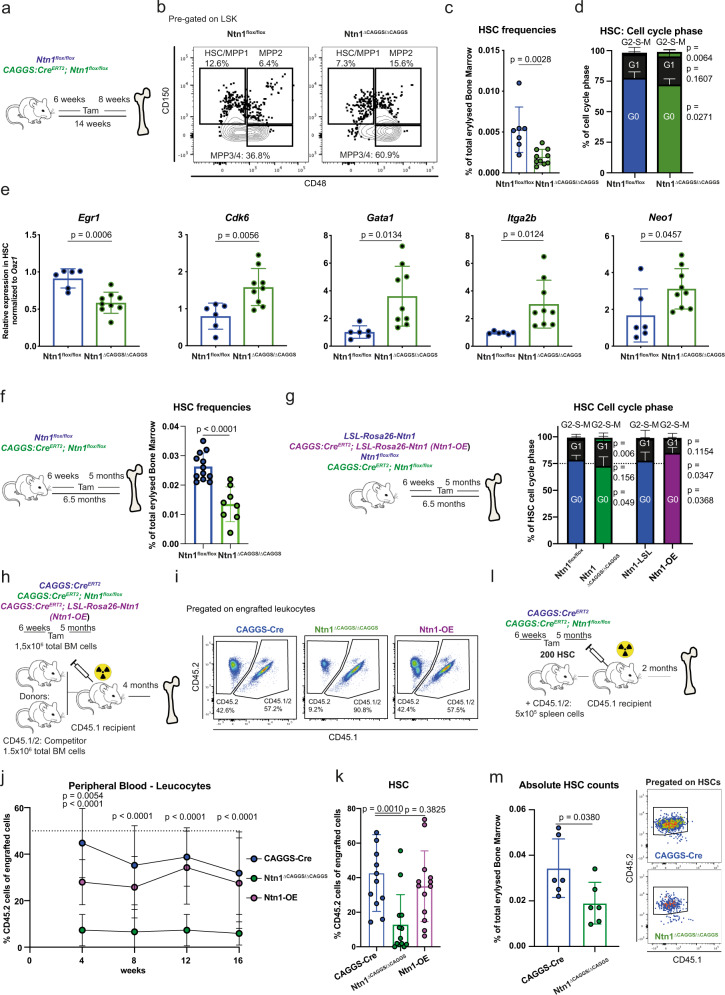
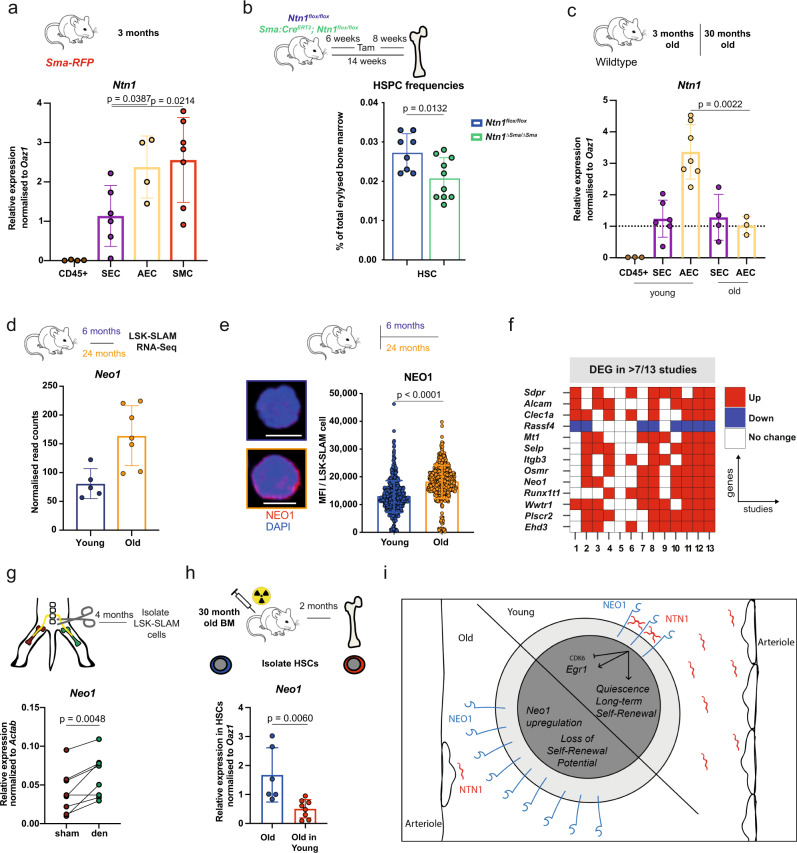
Haematopoietic stem cells (HSCs) are characterized by their self-renewal potential associated to dormancy. Here we identify the cell surface receptor neogenin-1 as specifically expressed in dormant HSCs. Loss of neogenin-1 initially leads to increased HSC expansion but subsequently to loss of self-renewal and premature exhaustion in vivo. Its ligand netrin-1 induces Egr1 expression and maintains quiescence and function of cultured HSCs in a Neo1 dependent manner. Produced by arteriolar endothelial and periarteriolar stromal cells, conditional netrin-1 deletion in the bone marrow niche reduces HSC numbers, quiescence and self-renewal, while overexpression increases quiescence in vivo. Ageing associated bone marrow remodelling leads to the decline of netrin-1 expression in niches and a compensatory but reversible upregulation of neogenin-1 on HSCs. Our study suggests that niche produced netrin-1 preserves HSC quiescence and self-renewal via neogenin-1 function. Decline of netrin-1 production during ageing leads to the gradual decrease of Neo1 mediated HSC self-renewal.


Conflict of interest statement

The authors declare no competing interests.

Figures

Fig. 1
Fig. 1. Neo1 is specifically expressed HSC and associated with quiescence.
a Overview of hematopoietic stem and progenitor cells (HSPCs) and their immunophenotypes. b Relative expression of Neo1 in HSPCs from 3-month-old mice; n = 4–7 (HSC-MPPs) and 9 (CMP/MEP/GMP), two independent experiments. c MFI of NEO1 in HSPCs from 3-month-old mice; n = 90 (MPP2), 118 (MPP34), 126 (MPP1) and 145 (HSC), two independent experiments. d Relative expression of Neo1 in dHSC and aHSC from SCL-tTA; H2B-GFP mice, chase for 5 months; n = 3. e MFI of NEO1 in dHSCs and aHSCs from SCL-tTA; H2B-GFP mice, chase for 5 months; n = 30 (aHSC)–47 (dHSC). f Relative expression of Neo1 in HSCs, 16 h, 5 and 7 days after PBS or poly-I:C injections; n = 3–5 (PBS16h). g Relative expression of Neo1 in HSCs, 16 h after PBS or LPS injections; n = 3 (LPS)–5 (PBS). For all panels, ±SD is shown. n indicates biological replicates. Scale bars in IF images are 5 μm. P value was determined by two-tailed t test. Source data are provided as a Source Data file.
Fig. 2
Fig. 2. Mutant Neo1 causes an initial HSC expansion.
a Relative expression of Neo1 in the total bone marrow of Wt and Neo1gt/gt mice; n = 6, three independent experiments. b Workflow: generation of full chimeras. c Absolute frequencies of bone marrow CD45.2+ HSCs in full Wt and Neo1gt/gt chimeras 4 months after first and second transplantation; n = 5 (2nd Tx)–8 (Ctrl 1st Tx) and 9 (Neo1 1st TX), two independent experiments. d Workflow: competitive transplantations. e Peripheral blood CD45.2+ chimerism during 1° and 2° competitive transplantations of Wt and Neo1gt/gt bone marrow; n = 13–17 (for exact n/timepoint please see Source data file), three independent experiments, Analysis with two-way ANOVA, multiple comparison with LSD Fisher’s test. f CD45.2+ chimerism of HSCs at endpoints of 1° and 2° competitive transplantations of Wt and Neo1gt//gt bone marrow; n = 11 (2nd TX), 12 (Ctrl 1st Tx), 14(Neo1 1st TX), three independent experiments. Whiskers are min–max, box is 25–75th percentile and line is mean. g Workflow: full chimeras studied in (h). h Absolute frequencies of bone marrow CD45.2+ HSCs in full Wt and Neo1gt//gt chimeras after 8 months; n = 8 (Ctrl)–9 (Neo1), three independent experiments. i Workflow: Homing assay in (j). j Absolute frequencies of CD45.2+ bone marrow LSK cells 48 h after transplantation of 10,000 sorted Wt and Neo1gt//gt LSK; n = 5 (Ctrl)–6 (Neo1). For all panels, ±SD is shown. n indicates biological replicates. P value was determined by two-tailed t test unless stated otherwise. Source data are provided as a Source Data file.
Fig. 3
Fig. 3. Mutant Neo1 causes premature HSC exhaustion.
a Workflow: aged chimeras, analysed in (bd). b Absolute frequencies of bone marrow CD45.2+ HSPCs in full Wt and Neo1gt//gt chimeras after 15 months; n = 7 (Ctrl)–11 (Neo1), two independent experiments. c Absolute blood counts of full Wt and Neo1gt//gt chimeras after 15 months; n = 7 (Ctrl)–11 (Neo1), two independent experiments, for HB: 4 (Ctrl)–7 (Neo1). d Frequencies of B cells and myeloid cells of C45.2+ cells in peripheral blood of Wt and Neo1gt//gt chimeras after 15 months; n = 5–13 (for exact n/timepoint please see Source data file), two independent experiments. Analysis with two-way-ANOVA, multiple comparisons with LSD Fisher’s test. e Workflow: assessment of HSC potency derived from 15 months (aged) chimeras. f Frequency of CD45.2+ vs. competitor HSCs 16 weeks transplantation of 100 or 500 HSCs from of aged Wt and Neo1gt//gt chimeras; n = 6 (Ctrl + 500 HSC Neo1)–7(100 HSC, Neo1), two independent experiments. g Workflow: secondary and tertiary transplantations of 15 months (aged) chimeras. h Absolute frequencies of bone marrow CD45.2+ HSPCs in 2° transplantations of aged Wt and Neo1gt//gt chimeras after 4 months; n = 7 (Ctrl)–8 (Neo1), two independent experiments. i Absolute frequencies of bone marrow CD45.2+ HSPCs in 3° transplantations of aged Wt and Neo1gt//gt chimeras after 4 months; n = 6, two independent experiments. j Workflow: generation of full chimeras used in (km). k Cell cycle phase of CD45.2+ HSCs derived from Wt and Neo1gt//gt chimeras after 4 months; n = 4 (Ctrl)–6 (Neo1), two independent experiments. l MFI of CDK6 in CD45.2+ HSC derived from Wt and Neo1gt//gt chimeras after 4 months; n = 23 (Neo1)–29 (Ctrl). m Frequency of BrdU+ CD45.2+ HSC derived from Wt and Neo1gt//gt chimeras after 4 months, 48 h post BrdU injection; n = 6, two independent experiments. For all panels, ±SD is shown. n indicates biological replicates. P value was determined by two-tailed t test unless stated otherwise. Scale bars in IF images are 5 μm. Source data are provided as a Source Data file.
Fig. 4
Fig. 4. Neo1-mutant HSCs reveal a loss of quiescence and potency signatures.
a, Left: workflow for RNA-seq of CD45.2+ HSCs from Wt and Neo1gt//gt chimeras after 4 and 15 months. Right: sparse PCA; n = 2 (WT old/young, Neo1 young)–3 (Neo1 old). b GSEA for cell cycle and HSC potency of Wt vs. Neo1gt//gt HSCs. FDR < 0.05, NOM p value <0.05. c Normalized read counts of DEG in HSCs from young and old Wt and Neo1gt//gt chimeras, n = 4 (Ctrl)–5 (Neo1). d GSEA for HSC ageing signatures in Wt vs. Neo1gt//gt HSCs. FDR < 0.05, NOM p value <0.05. e Normalized read counts of Klf6 in HSCs from young and old Wt and Neo1gt//gt chimeras, n = 4 (Ctrl)–5 (Neo1). f GSEA for signalling pathways in Wt vs. Neo1gt//gt HSCs. FDR < 0.05, NOM p value <0.05. For all panels, ±SD is shown. n indicates biological replicates. Scale bars in IF images are 4 μm. P value was determined by two-tailed t test unless stated otherwise. Source data are provided as a Source Data file.
Fig. 5
Fig. 5. Ntn1 preserves HSC quiescence and engraftment potential in vitro via Neo1.
a Workflow: In vitro stimulation of sorted HSCs used in (bd), analysis after 48 h. b Relative expression of Egr1 in Wt HSCs; n = 3 (other), 4 (RGM-a + b), 16 (Ctrl/Neo1), for ctrl/Ntn1, four independent experiments. c Representative cell cycle plots pre-gated on HSCs and quantification with or without Ntn1 treatment; n = 3 (Neo1), 11 (Wt-Ctrl), 12 (Wt-Ntn1), three independent experiments for ctrl HSC. d MFI of CDK6 in Wt HSCs 48 h after Ntn1 treatment, quantification of MFI per cell; n = 114 (Ctrl) and 134 (Ntn1). e Workflow: representative images and quantification of total cell/nuclear MFI of p65-GFP HSC 48 h after treatment with Ntn1 or Ntn1 + JSH-23; n = 8 (JSH-23), 78 (Ctrl), 91 (Ntn1), two independent experiments. f Workflow: competitive transplantation of Ntn1 stimulated CD45.2 and CD45.1/2 HSCs. g Chimerism of bone marrow LSK-SLAM cells 4 months after competitive transplantation of Control vs. Ntn1-treated HSCs; n = 6 (CD45.1/2), 7 (CD45.2), two independent experiments. For all panels, ±SD is shown. n indicates biological replicates. Scale bars in IF images are 4 μm. P value was determined by two-tailed t test unless stated otherwise. Source data are provided as a Source Data file.
Fig. 6
Fig. 6. In vivo Ntn1 deletion depletes HSC and Ntn1 overexpression increases HSC quiescence.
a Workflow: analysis of Ntn1flox/flox and CAGGS:CreERT2; Ntn1flox/flox mice 8 weeks after Cre induction for (be). b Representative flow cytometry plots of the LSK population of Ntn1flox/flox and Ntn1ΔCAGGS/ΔCAGGS mice. c Frequencies of bone marrow HSCs in Ntn1flox/flox and Ntn1ΔCAGGS/ΔCAGGS mice; n = 7 (flox)–10 (∆CAGGS), two independent experiments. d Cell cycle phase of HSCs derived from Ntn1flox/flox and Ntn1ΔCAGGS/ΔCAGGS mice; n = 8 (flox) and 10 (∆CAGGS), two independent experiments. e Relative expression of quiescence and activation related genes in HSCs derived from Ntn1flox/flox and Ntn1ΔCAGGS/ΔCAGGS mice; n = 6 (flox)–9 (∆CAGGS), two independent experiments. f Frequencies of bone marrow HSCs in Ntn1flox/flox and Ntn1ΔCAGGS/ΔCAGGS mice 5 months after Cre induction; n = 8 (∆CAGGS) and 12 (flox), three independent experiments. g Cell cycle phase of HSCs derived from Ntn1+/LSL-Rosa26-Ntn1 and Ntn1-OE mice; n = 8 (∆CAGGS) and 12 (flox), three independent experiments. h Workflow: competitive transplantation of CAGGS:CreERT2, Ntn1ΔCAGGS/ΔCAGGS and Ntn1-OE mice 5 months after Cre induction, analysed in (ik). i Representative FACS plots of peripheral blood leucocytes pre-gated on CD45+ cells at 16 weeks after transplantation. j Peripheral blood CD45.2+ chimerism during competitive transplantations; n = 13 (OE)–14 (Cre/∆CAGGS), two independent experiments. Analysis was done with two-way-ANOVA, multiple comparison with LSD Fisher’s test. k Bone marrow HSC CD45.2+ chimerism after 16 weeks of competitive transplantation; n = 12 (Cre)–13 (∆CAGGS/OE), two independent experiments. l Workflow: transplantation of 200 HSCs sorted from CAGGS:CreERT2 and Ntn1ΔCAGGS/ΔCAGGS mice at 5 months after Cre induction. m Frequencies of bone marrow HSCs 8 weeks transplantation; n = 6. For all panels, ±SD is shown. n indicates biological replicates. P value was determined by two-tailed t test unless stated otherwise. Source data are provided as a Source Data file.
Fig. 7
Fig. 7. Loss of niche-derived Ntn1 induces Neo1 in HSC upon ageing.
a Relative expression of Ntn1 in CD45+ cells, SEC, AEC and RFP+ SMC derived from Sma-RFP mice; n = 4 (CD45/AEC), 6 (SEC) and 7 (SMA-RFP), two independent experiments. b Frequencies of HSCs in bone marrow of in Ntn1flox/flox and Ntn1ΔSma/ΔSma mice; n = 8 (flox) and 10 (∆SMA), three independent experiments. c Relative expression of Ntn1 in SEC, AEC and CD45+ cells derived from young and old Wt mice; n = 3 (yCD45/oAEC), 4 (oSEC), 6 (ySEC) and 7 (yAEC), three independent experiments. d Normalized read counts of Neo1 in young, and old LSK-SLAM cells; n = 5 (young) and 7 (old), FDR < 0.0001. e MFI of NEO1 in sorted 6 or 24 months LSK-SLAM cells; n = 592 (young)–593 (old). f Most abundant common DEGs in published ageing studies and own data, additional details in the “Methods” section. g Relative expression of Neo1 in LSK-SLAM cells isolated from either denervated or healthy legs of individual mice; n = 8, two independent experiments. h Relative expression of Neo1 in HSCs of aged mice, before and after 2 months post transplantation; n = 6 (before) and 8 (after), two independent experiments. i Model of Neo1/Ntn1 axis in young and old mice. For all panels, ±SD is shown. n indicates biological replicates. Scale bars in IF images are 5 μm. P value determined by two-tailed t test unless stated otherwise. Source data are provided as a Source Data file.

References

    1. Cabezas-Wallscheid N, et al. Identification of regulatory networks in HSCs and their immediate progeny via integrated proteome, transcriptome, and DNA methylome analysis. Cell Stem Cell. 2014;15:507–522. doi: 10.1016/j.stem.2014.07.005. - DOI - PubMed
    1. Kiel MJ, et al. SLAM family receptors distinguish hematopoietic stem and progenitor cells and reveal endothelial niches for stem cells. Cell. 2005;121:1109–1121. doi: 10.1016/j.cell.2005.05.026. - DOI - PubMed
    1. Pietras EM, et al. Functionally distinct subsets of lineage-biased multipotent progenitors control blood production in normal and regenerative conditions. Cell Stem Cell. 2015;17:35–46. doi: 10.1016/j.stem.2015.05.003. - DOI - PMC - PubMed
    1. Busch K, et al. Fundamental properties of unperturbed haematopoiesis from stem cells in vivo. Nature. 2015;518:542–546. doi: 10.1038/nature14242. - DOI - PubMed
    1. Rodriguez-Fraticelli AE, et al. Clonal analysis of lineage fate in native haematopoiesis. Nature. 2018;553:212–216. doi: 10.1038/nature25168. - DOI - PMC - PubMed

Publication types