. 2021 Jan 27;11(1):2393.
doi: 10.1038/s41598-021-81557-1.

The inflammatory response induced by Pseudomonas aeruginosa in macrophages enhances apoptotic cell removal

Affiliations

The inflammatory response induced by Pseudomonas aeruginosa in macrophages enhances apoptotic cell removal

Adriana Valeria Jäger et al. Sci Rep. .

Abstract

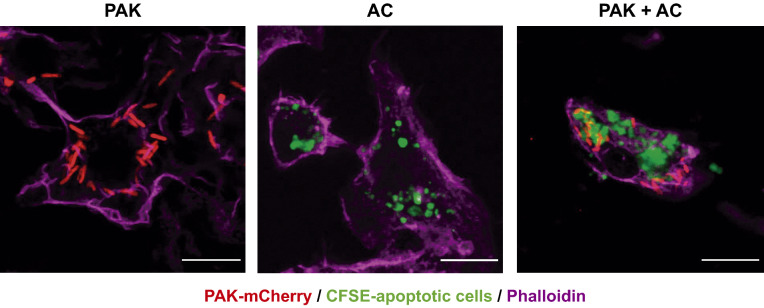
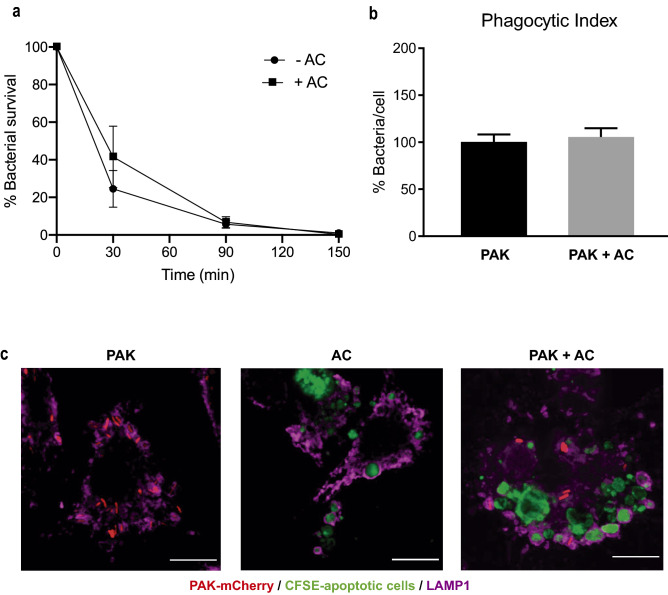
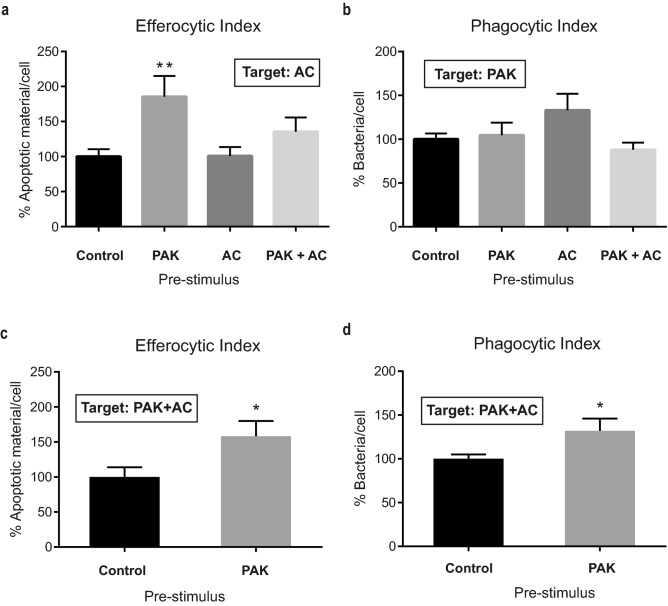
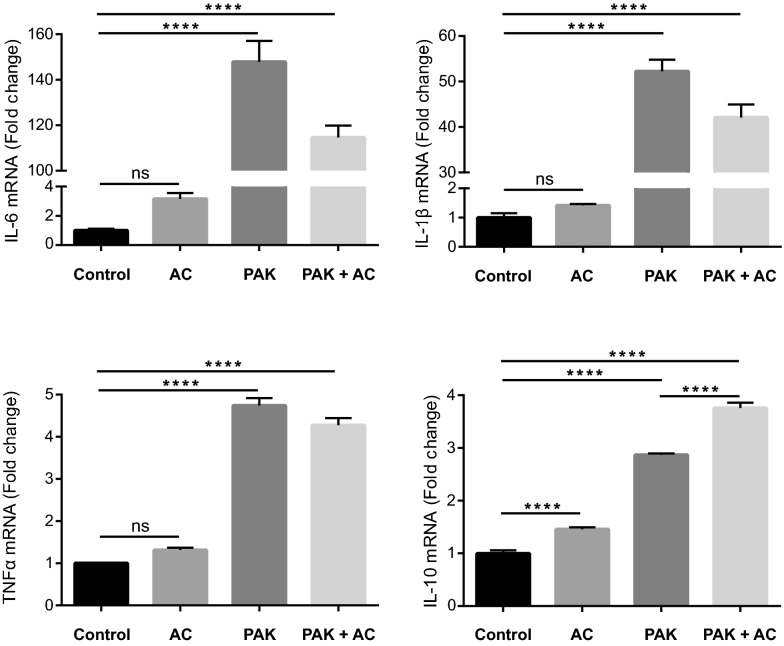
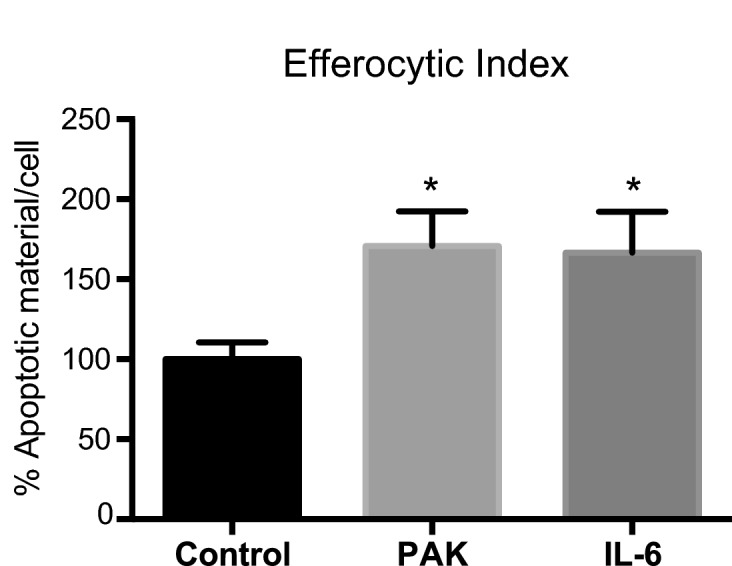
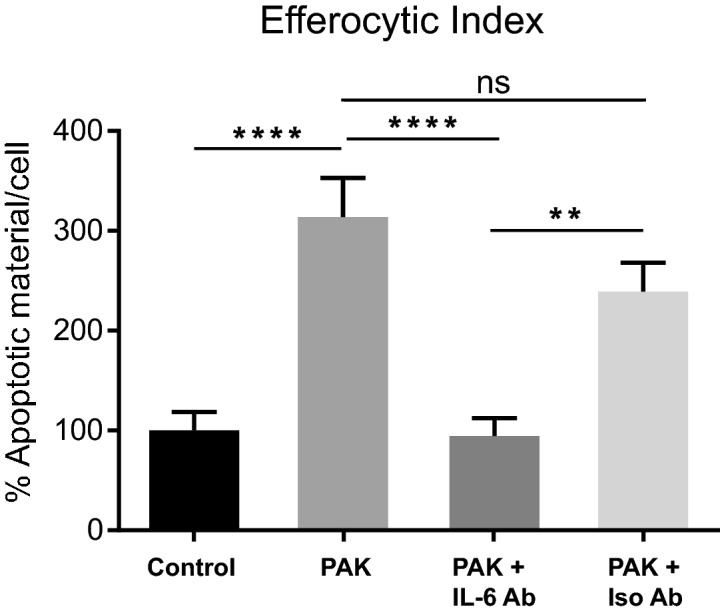
Pathogens phagocytosis and the uptake of apoptotic cells (efferocytosis) are essential macrophages tasks, classically considered as mutually exclusive. Macrophages have been observed to polarize into either pro-inflammatory/microbicidal or anti-inflammatory/efferocytic phenotypes. However, macrophage functions have shown to be more complex. Furthermore, little is known about the regulation of efferocytosis under inflammatory conditions. In this study, we elucidate the modulation of the macrophage efferocytic function during an inflammatory stimulus. We find that bone marrow-derived macrophages (BMDM) are very efficient in engulfing both the bacterial pathogen Pseudomonas aeruginosa and apoptotic cells. BMDM showed a high bactericidal capacity unaffected by the concomitant presence of apoptotic material. Plasticity in macrophage programming, in response to changing environmental cues, may modulate efferocytic capability. In this work, we further show that, after phagocyting and processing Pseudomonas aeruginosa, macrophages highly increase their efferocytic capacity without affecting their phagocytic function. Moreover, we demonstrate that Pseudomonas aeruginosa enhances efferocytosis of these phagocytes through the IL-6 signaling pathway. Our results show that the inflammatory response generated by the bacterial processing enhances these macrophages' capacity to control inflammation through an increased efferocytosis.


Conflict of interest statement

The authors declare no competing interests.

Figures

Figure 1
Figure 1
P. aeruginosa adheres to J774 apoptotic cells and both are internalized by macrophages. Projected confocal Z-stacks of BMDM exposed for 30 min to bacteria, apoptotic cells, or both. Scale bars 10 µm. Green: CFSE-labeled J774 apoptotic cells. Red: PAK-mCherry. Magenta: phalloidin.
Figure 2
Figure 2
P. aeruginosa is eliminated by murine primary BMDM inside LAMP1-positive vesicles. (a) Intracellular bacterial survival over time was measured by standard antibiotic protection assays followed by CFU counting. Data presented as mean of CFUs ± SEM were normalized to time 0 (100%). This assay was done in the absence (−AC) or presence of apoptotic cells (+AC). Three independent experiments were performed. No significant differences were found by unpaired t test. (b) Phagocytic Index. Cells were incubated with the targets for 30 min. The index was calculated as the average number of bacteria internalized per cell in the presence or absence of apoptotic cells. Data were calculated as mean ± SEM and normalized to the condition with only bacteria (100%). PAK bacteria alone, PAK + AC PAK with apoptotic cells concurrently. Three independent experiments were performed. No significant differences were found by unpaired t test. (c) P. aeruginosa and apoptotic cells localize to LAMP1-positive vesicles. BMDM were fed for 50 min with PAK-mCherry, CFSE-labeled apoptotic cells, or both concurrently. Confocal projected Z-stacks showing LAMP1-positive vesicles containing bacteria and apoptotic material. Scale bars 10 µm. Green: CFSE-labeled apoptotic cells. Red: PAK-mCherry. Magenta: LAMP1.
Figure 3
Figure 3
BMDM Efferocytic Index is increased by P. aeruginosa pre-stimulation. (a) BMDM Efferocytic Indexes after different stimuli are shown. BMDM were incubated for 50 min with different pre-stimuli: PAK (bacteria), AC (apoptotic cells), PAK + AC (PAK with AC concurrently) and Control (non-stimulus). The efferocytic capacities using apoptotic cells as targets were checked 18 h after pre-stimuli. The Phagocytic Indexes for these same macrophage populations were calculated and are shown in panel (b). Analysis of BMDM efferocytic (c) and phagocytic (d) Indexes after pre-stimulation with bacteria (or non-stimulated as Control) and confronted with bacteria-laden apoptotic cells as targets. Same experimental conditions as in (a,b) but using PAK and AC concurrently as targets for the assays. Data were normalized to the Control (non-stimulus: 100%) and expressed as mean of apoptotic material/cell or bacteria /cell ± SEM of three independent experiments. In (a) **p = 0.0098 vs. Control by one-way ANOVA, followed by Dunnett´s multiple comparison test. In (c,d) * p < 0.05 vs. Control by unpaired t test.
Figure 4
Figure 4
BMDM cytokine gene expression profile elicited by the different stimuli. Cytokine gene expression was determined in BMDM after different pre-stimuli treatment and expressed as a fold change with respect to Control. BMDM were incubated for 50 min with different pre-stimuli: AC (apoptotic cells), PAK (bacteria), PAK + AC (PAK with AC concurrently) and Control (non-stimulus). Six hours after the initiation of the experiment, RNA was extracted. Four mRNA cytokines were tested by RT-qPCR: Il-6, Il-1β, Tnfα and Il-10. Data is presented as mean Fold Change ± SD. One of three independent experiments normalized to Ywhaz mRNA levels is shown. ****p < 0.0001 vs. Control by one-way ANOVA, followed by Tukey’s multiple comparison test.
Figure 5
Figure 5
BMDM Efferocytic Index is increased by IL-6 pre-stimulation. BMDM Efferocytic Index after pre-stimulation with PAK or IL-6 (10 ng/ml). BMDM (from C57BL/6J mice) were incubated for 50 min with PAK or IL-6, and non-stimulus as Control. The efferocytic capacities using apoptotic cells as targets were checked 18 h after pre-stimuli. Data were normalized to the Control (non-stimulus: 100%) and expressed as mean of apoptotic material/cell ± SEM of two independent experiments. *p < 0.03 vs. Control by unpaired t test.
Figure 6
Figure 6
IL-6 mediates the increase of the Efferocytic Index in bacterial pre-stimulated BMDM. BMDM were incubated for 50 min with PAK (bacteria) as pre-stimulus or left unstimulated (Control). The efferocytic capacities using apoptotic cells as targets were checked 18 h after pre-stimuli. Additionally, PAK pre-treatment was evaluated in the constant presence of anti-IL-6-neutralizing monoclonal antibody (IL-6 Ab) or its matching isotype Control (Iso Ab). Efferocytic capacity was determined by confocal microscopy as detailed in Methods. Data were normalized to the Control (non-stimulus: 100%) and expressed as mean ± SEM of three independent experiments, **p = 0.0019 and ****p < 0.0001 vs. Control by one-way ANOVA, followed by Tukey’s multiple comparison test.

References

    1. Martinez FO, Helming L, Gordon S. Alternative activation of macrophages: An immunologic functional perspective. Annu. Rev. Immunol. 2009;27:451–483. doi: 10.1146/annurev.immunol.021908.132532. - DOI - PubMed
    1. Duffield JS, Lupher M, Thannickal VJ, Wynn TA. Host responses in tissue repair and fibrosis. Annu. Rev. Pathol. 2013;8:241–276. doi: 10.1146/annurev-pathol-020712-163930. - DOI - PMC - PubMed
    1. Murray PJ. Macrophage polarization. Annu. Rev. Physiol. 2017;79:541–566. doi: 10.1146/annurev-physiol-022516-034339. - DOI - PubMed
    1. Italiani P, Boraschi D. From monocytes to M1/M2 macrophages: Phenotypical vs. functional differentiation. Front. Immunol. 2014;5:514. doi: 10.3389/fimmu.2014.00514. - DOI - PMC - PubMed
    1. Mills CD. M1 and M2 macrophages: Oracles of health and disease. Crit. Rev. Immunol. 2012;32:463–488. doi: 10.1615/critrevimmunol.v32.i6.10. - DOI - PubMed

Publication types

MeSH terms

LinkOut - more resources