. 2021 Jan 27;11(1):2336.
doi: 10.1038/s41598-020-79085-5.

Cyclophosphamide arrhythmogenicitytesting using human-induced pluripotent stem cell-derived cardiomyocytes

Affiliations

Cyclophosphamide arrhythmogenicitytesting using human-induced pluripotent stem cell-derived cardiomyocytes

A D Podgurskaya et al. Sci Rep. .

Abstract

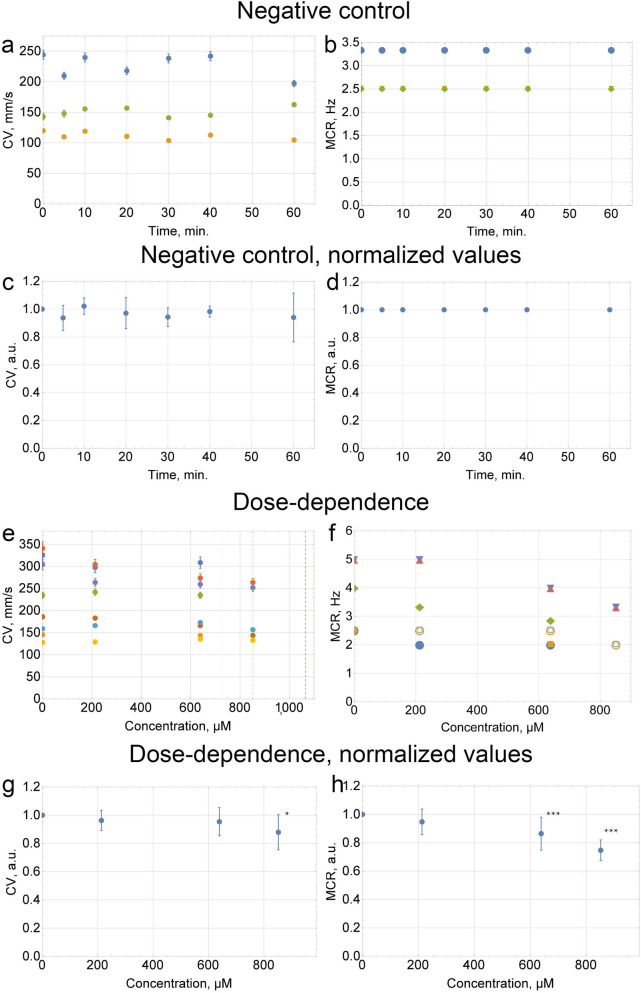
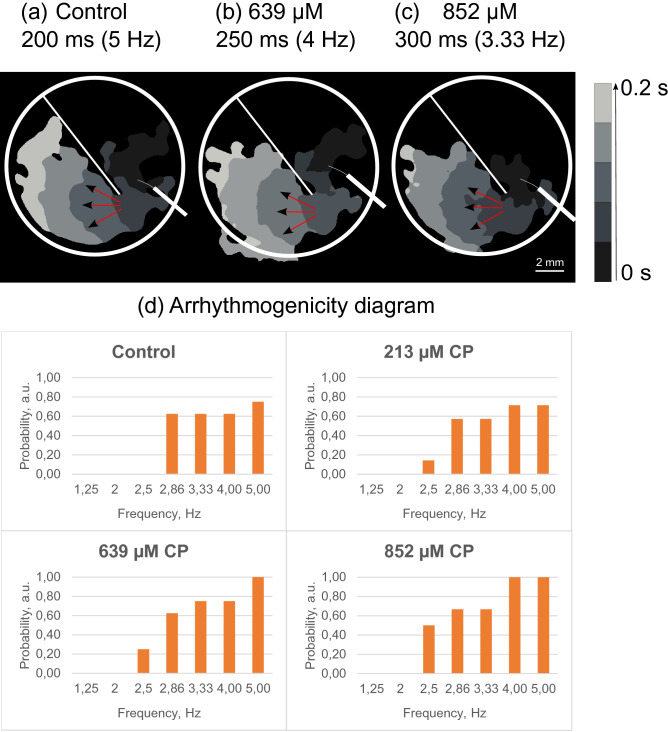
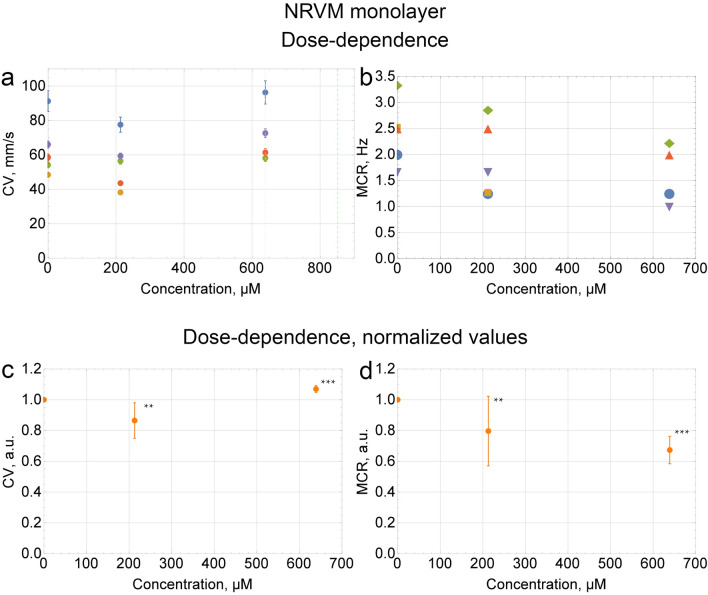
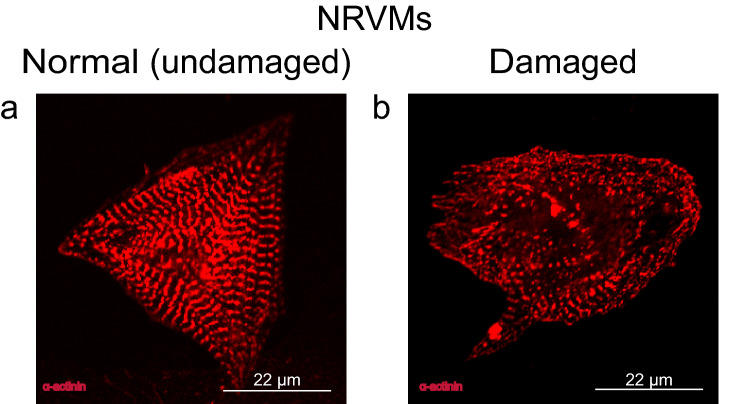
Cyclophosphamide (CP) is an anticancer drug, an alkylating agent. Cardiotoxicity of CP is associated with one of its metabolites, acrolein, and clinical cardiotoxicity manifestations are described for cases of taking CP in high doses. Nevertheless, modern arrhythmogenicity prediction assays in vitro include evaluation of beat rhythm and rate as well as suppression of cardiac late markers after acute exposure to CP, but not its metabolites. The mechanism of CP side effects when taken at low doses (i.e., < 100 mg/kg), especially at the cellular level, remains unclear. In this study conduction properties and cytoskeleton structure of human induced pluripotent stem cell-derived cardiomyocytes (hiPSC-CMs) obtained from a healthy donor under CP were evaluated. Arrhythmogenicity testing including characterization of 3 values: conduction velocity, maximum capture rate (MCR) measurements and number of occasions of re-entry on a standard linear obstacle was conducted and revealed MCR decrease of 25% ± 7% under CP. Also, conductivity area reduced by 34 ± 15%. No effect of CP on voltage-gated ion channels was found. Conduction changes (MCR and conductivity area decrease) are caused by exposure time-dependent alpha-actinin disruption detected both in hiPSC-CMs and neonatal ventricular cardiomyocytes in vitro. Deviation from the external stimulus frequency and appearance of non-conductive areas in cardiac tissue under CP is potentially arrhythmogenic and could develop arrhythmic effects in vivo.


Conflict of interest statement

The authors declare no competing interests.

Figures

Figure 1
Figure 1
Human iPSC-CMs differentiation efficiency for three independent differentiations of m34Sk3 cell line. Quantification was done on the basis of optical mapping fluorescence data (Ca2+) of obtained cardiac tissue.
Figure 2
Figure 2
The CP dose-dependences of CV and MCR in the hiPSC cardiac tissue. The CV was measured at a frequency of 1 Hz. For the MCR measurements, the frequency was increased from 1 to 5 Hz in increments of ≤ 0.5 Hz. Dashed lines indicate the moments when normal propagation stopped. The CV and MCR were measured ≤ 10 min after the addition of the CP solution. (c,d,g,h) Data of each run was normalized to the control value. Summary data is presented as mean ± SD (n = 8); *p < 0.05, **p < 0.01, ***p < 0.001 vs. control. (a,e) Error bars on each individual point represent the equipment error for each measurement of CV.
Figure 3
Figure 3
The effect of cyclophosphamide on re-entry formation in the hiPSC cardiac tissue. Activation maps of successful propagation on a standard linear obstacle in (a) control, (b) under 639 µM (~ 13 mg/kg) and (c) 852 µM (~ 18 mg/kg) of CP. The activation time is color coded. The frequency was increased from 1 to 5 Hz in increments of ≤ 0.5 Hz; white circles correspond to the border of the sample, white lines correspond to the location of the obstacle, and red arrows indicate the direction of the excitation wave propagation. Arrhythmogenicity diagram (d), the orange bars indicate cases in which the tissue did not capture the external impulses. The vertical values of the diagram bars show the probability of the external impulses non-capturing in the hiPSC-derived cardiac tissue.
Figure 4
Figure 4
The effect of CP on voltage-dependent ion channels in hiPSC-CMs obtained from a healthy donor. (a) Voltage-dependent fast sodium current (INav) shown in the control and after the addition of 630 μM (~ 13 mg/kg) of CP, and a ramp current that was evoked when the voltage was increased smoothly from − 120 to + 50 mV for 200 ms. The cell was prepulsed to − 120 mV for 100 ms from a holding potential of − 80 mV. The voltage protocol is shown above the current trace. Summary data is presented on the bar graph as mean ± SEM (n = 5). (b) L-type Ca2+ currents obtained in the absence (control) and presence of 630 μM (~ 13 mg/kg) of CP. Inset: The original current trace in response to a voltage step from − 40 to 0 mV for 300 ms. The inactivation of INa+ was achieved by a pre-step from a holding potential of − 80 mV to − 40 mV for 100 ms. Summary data is presented on the bar graph as mean ± SEM (n = 3). (c) The effect of 630 μM (~ 13 mg/kg) of CP on the slow potassium currents of the delayed rectification IKs current elicited in response to the 5 s depolarizing pulse from − 40 mV to + 60 mV in 10 mV increments. Summary data is presented on the bar graph as mean ± SEM (n = 5). (d) Voltage-clamp recordings of the IKr current elicited in response to the 5 s depolarizing pulse from − 40 mV to + 60 mV in 10 mV increments (HP of − 40 mV), showing the effect of 630 μM (~ 13 mg/kg) of CP on a tail current of IKr. IKr tail after the stimulation step during a 3 s holding potential of − 40 mV could be observed. Summary data is presented on the bar graph as mean ± SEM (n = 4).
Figure 5
Figure 5
The CP dose-dependences of CV and MCR in the NRVM monolayer. The CV was measured at a frequency of 1 Hz. For the MCR measurements, the frequency was increased from 1 to 5 Hz in increments of ≤ 0.5 Hz. Dashed lines indicate the moments when normal propagation stopped. (a) Error bars on each individual point represent the equipment error for each measurement of CV. (c,d) Data of each run was normalized to the control value. Summary data is presented as mean ± SD (n = 5); **p < 0.01, ***p < 0.001 vs. control.
Figure 6
Figure 6
Confocal imaging of F-actin, α-actinin and DAPI in hiPSC-CMs. (a,c,e) Normal, undamaged cardiomyocytes. C = 3.6 for the presented cells. (b,d,f) Bottom part of figure: cardiomyocytes with damaged cytoskeleton after incubation with 213 µM (~ 4 mg/kg) of CP. C = 1.0 and C = 0.7 for cardiomyocytes presented on the image.
Figure 7
Figure 7
Representative image of α-actinin damage in isolated NRVMs under the influence of CP. (a) Normal, undamaged cardiomyocyte. (b) Cardiomyocyte with damaged α-actinin after incubation with 213 µM (~ 4 mg/kg) of CP.

References

    1. Dhesi S, et al. Cyclophosphamide-induced cardiomyopathy: A case report, review, and recommendations for management. J. Investig. Med. High Impact Case Rep. 2013;1:2324709613480346. - PMC - PubMed
    1. Iqubal A, Haque SE, Sharma S, Ansari MA, Khan V, Iqubal MK. Clinical updates on drug—induced cardiotoxicity. Int. J. Pharm. Sci. Res. 2018 doi: 10.13040/IJPSR.0975-8232.9(1).16-26. - DOI
    1. Nakamae H, Tsumura K, Hino M, Hayashi T, Tatsumi N. QT dispersion as a predictor of acute heart failure after high-dose cyclophosphamide. Lancet (London, England) 2000;355:805–806. doi: 10.1016/S0140-6736(00)02051-1. - DOI - PubMed
    1. Senkus E, Jassem J. Cardiovascular effects of systemic cancer treatment. Cancer Treat. Rev. 2011;37:300–311. doi: 10.1016/j.ctrv.2010.11.001. - DOI - PubMed
    1. Steingo, L. Cardiovascular complications of chemotherapy: A synopsis. SA Hear.9, (2017).

Publication types

MeSH terms

Substances