

In your phase: neural phase synchronisation underlies visual imagery of faces
- PMID: 33504828
- PMCID: PMC7840739
- DOI: 10.1038/s41598-021-81336-y
In your phase: neural phase synchronisation underlies visual imagery of faces
Erratum in
-
Author Correction: In your phase: neural phase synchronisation underlies visual imagery of faces.Sci Rep. 2021 Aug 2;11(1):16012. doi: 10.1038/s41598-021-94756-7. Sci Rep. 2021. PMID: 34341371 Free PMC article. No abstract available.
Abstract
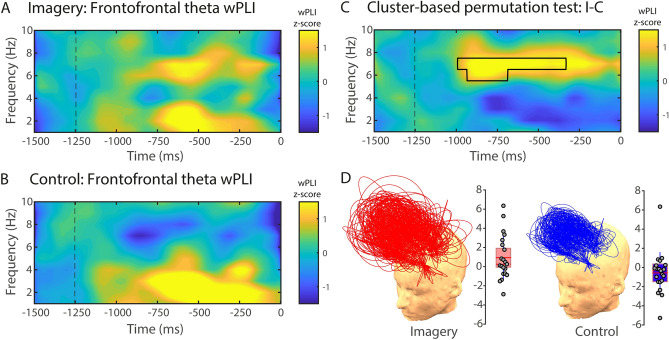
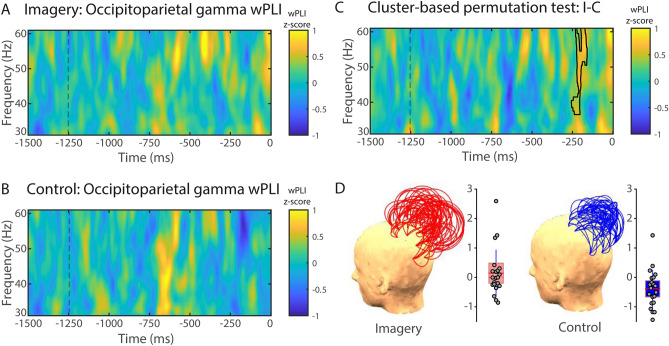
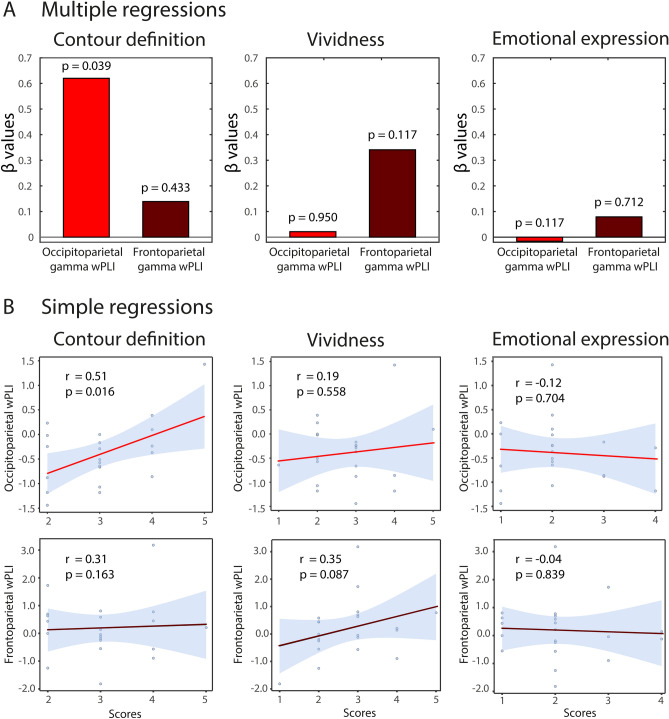
Mental imagery is the process through which we retrieve and recombine information from our memory to elicit the subjective impression of "seeing with the mind's eye". In the social domain, we imagine other individuals while recalling our encounters with them or modelling alternative social interactions in future. Many studies using imaging and neurophysiological techniques have shown several similarities in brain activity between visual imagery and visual perception, and have identified frontoparietal, occipital and temporal neural components of visual imagery. However, the neural connectivity between these regions during visual imagery of socially relevant stimuli has not been studied. Here we used electroencephalography to investigate neural connectivity and its dynamics between frontal, parietal, occipital and temporal electrodes during visual imagery of faces. We found that voluntary visual imagery of faces is associated with long-range phase synchronisation in the gamma frequency range between frontoparietal electrode pairs and between occipitoparietal electrode pairs. In contrast, no effect of imagery was observed in the connectivity between occipitotemporal electrode pairs. Gamma range synchronisation between occipitoparietal electrode pairs predicted subjective ratings of the contour definition of imagined faces. Furthermore, we found that visual imagery of faces is associated with an increase of short-range frontal synchronisation in the theta frequency range, which temporally preceded the long-range increase in the gamma synchronisation. We speculate that the local frontal synchrony in the theta frequency range might be associated with an effortful top-down mnemonic reactivation of faces. In contrast, the long-range connectivity in the gamma frequency range along the fronto-parieto-occipital axis might be related to the endogenous binding and subjective clarity of facial visual features.
Conflict of interest statement
The authors declare no competing interests.
Figures


Similar articles
-
Visual imagery of famous faces: effects of memory and attention revealed by fMRI.Neuroimage. 2002 Dec;17(4):1729-41. doi: 10.1006/nimg.2002.1330. Neuroimage. 2002. PMID: 12498747
-
Where bottom-up meets top-down: neuronal interactions during perception and imagery.Cereb Cortex. 2004 Nov;14(11):1256-65. doi: 10.1093/cercor/bhh087. Epub 2004 Jun 10. Cereb Cortex. 2004. PMID: 15192010
-
I can see where you would be: Patterns of fMRI activity reveal imagined landmarks.Neuroimage. 2017 Jan 1;144(Pt A):174-182. doi: 10.1016/j.neuroimage.2016.08.034. Epub 2016 Aug 20. Neuroimage. 2017. PMID: 27554528
-
Seeing faces and objects with the "mind's eye".Arch Ital Biol. 2010 Mar;148(1):1-9. Arch Ital Biol. 2010. PMID: 20426249 Review.
-
Visual mental imagery: Evidence for a heterarchical neural architecture.Phys Life Rev. 2024 Mar;48:113-131. doi: 10.1016/j.plrev.2023.12.012. Epub 2023 Dec 27. Phys Life Rev. 2024. PMID: 38217888 Review.
Cited by
-
Integrated phenomenology and brain connectivity demonstrate changes in nonlinear processing in jhana advanced meditation.bioRxiv [Preprint]. 2025 Mar 27:2024.11.29.626048. doi: 10.1101/2024.11.29.626048. bioRxiv. 2025. Update in: J Cogn Neurosci. 2025 May 14:1-24. doi: 10.1162/jocn.a.50. PMID: 39677684 Free PMC article. Updated. Preprint.
-
Real and Deepfake Face Recognition: An EEG Study on Cognitive and Emotive Implications.Brain Sci. 2023 Aug 23;13(9):1233. doi: 10.3390/brainsci13091233. Brain Sci. 2023. PMID: 37759834 Free PMC article.
-
Deep Convolutional Neural Network-Based Visual Stimuli Classification Using Electroencephalography Signals of Healthy and Alzheimer's Disease Subjects.Life (Basel). 2022 Mar 4;12(3):374. doi: 10.3390/life12030374. Life (Basel). 2022. PMID: 35330125 Free PMC article.
References
-
- Ganis G, Thompson WL, Kosslyn SM. Brain areas underlying visual mental imagery and visual perception: An fMRI study. Cognit. Brain Res. 2004;20:226–241. - PubMed
-
- Ganis G, Thompson WL, Mast FW, Kosslyn SM. Visual imagery in cerebral visual dysfunction. Neurol. Clin. 2003;21:631–646. - PubMed
-
- Kosslyn SM. Mental images and the brain. Cognit. Neuropsychol. 2005;22:333–347. - PubMed
-
- Holmes EA, Mathews A. Mental imagery in emotion and emotional disorders. Clin. Psychol. Rev. 2010;30:349–362. - PubMed
MeSH terms
LinkOut - more resources
Full Text Sources
Other Literature Sources
