. 2021 Jan 27;11(1):2391.
doi: 10.1038/s41598-021-81351-z.

Salicylic diamines selectively eliminate residual undifferentiated cells from pluripotent stem cell-derived cardiomyocyte preparations

Affiliations

Salicylic diamines selectively eliminate residual undifferentiated cells from pluripotent stem cell-derived cardiomyocyte preparations

Karsten Burkert et al. Sci Rep. .

Abstract

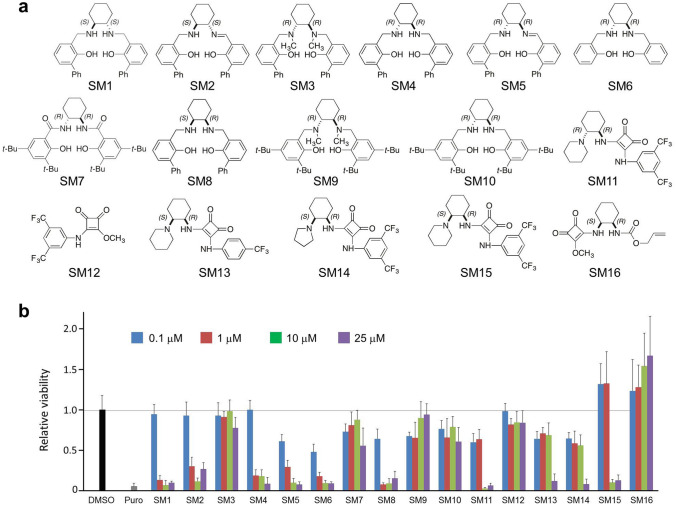
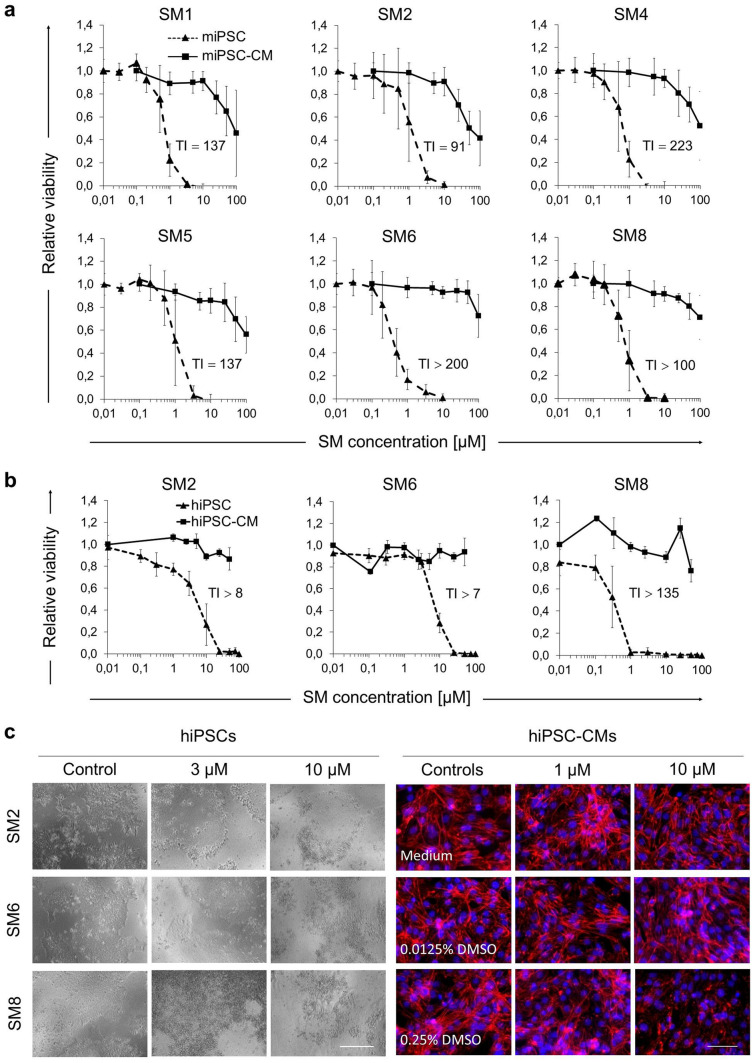
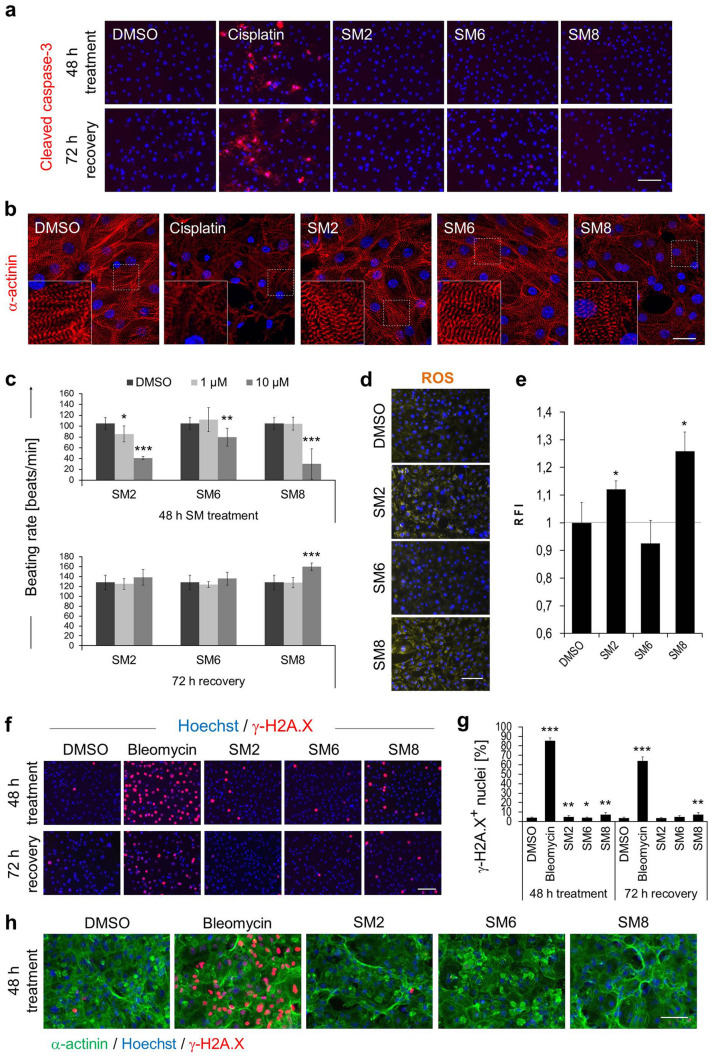
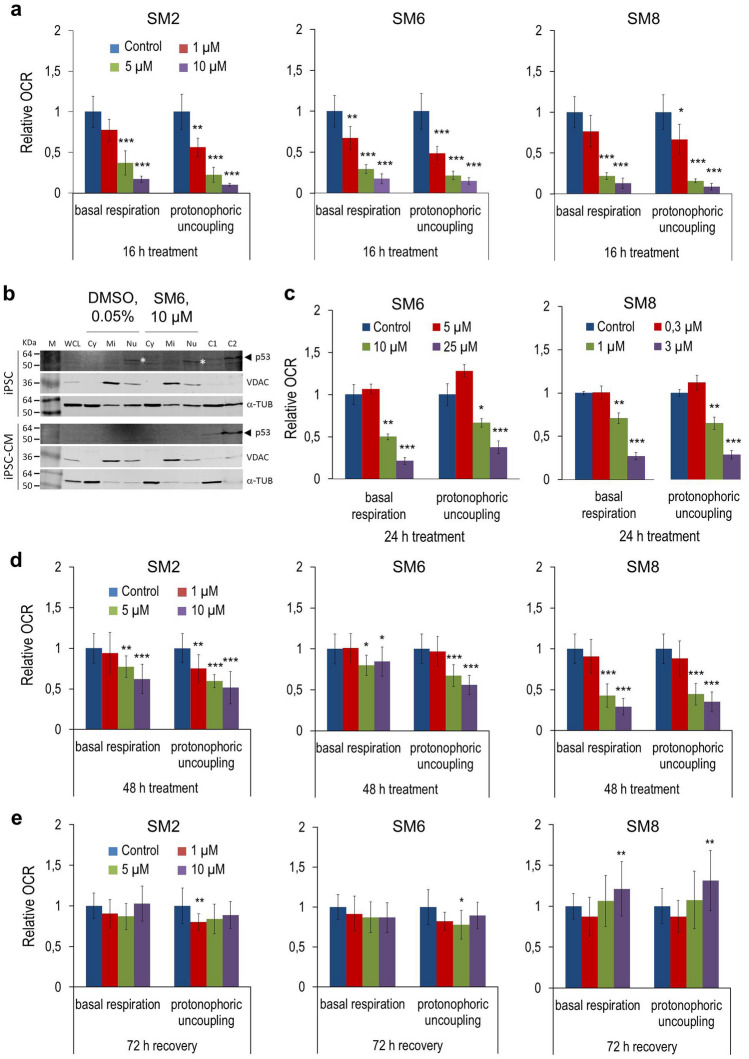
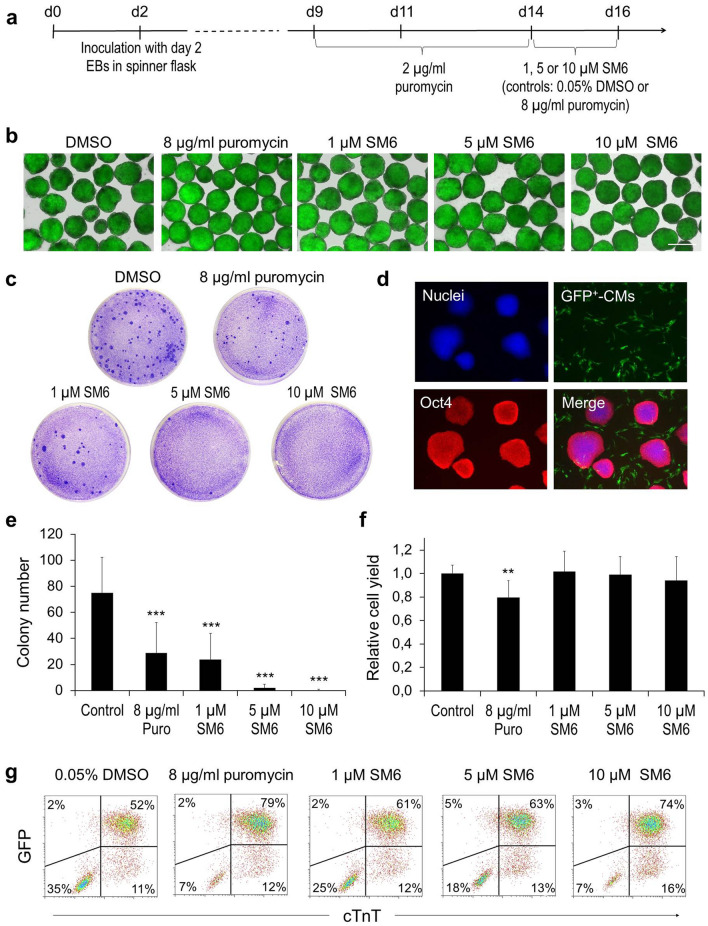
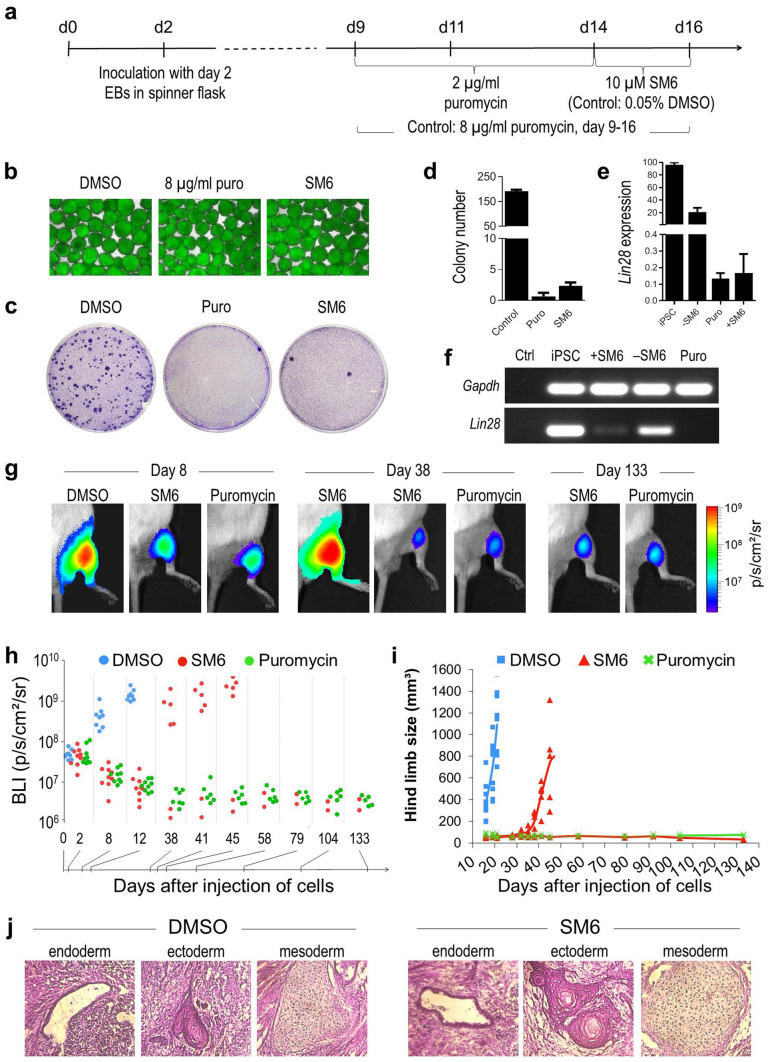
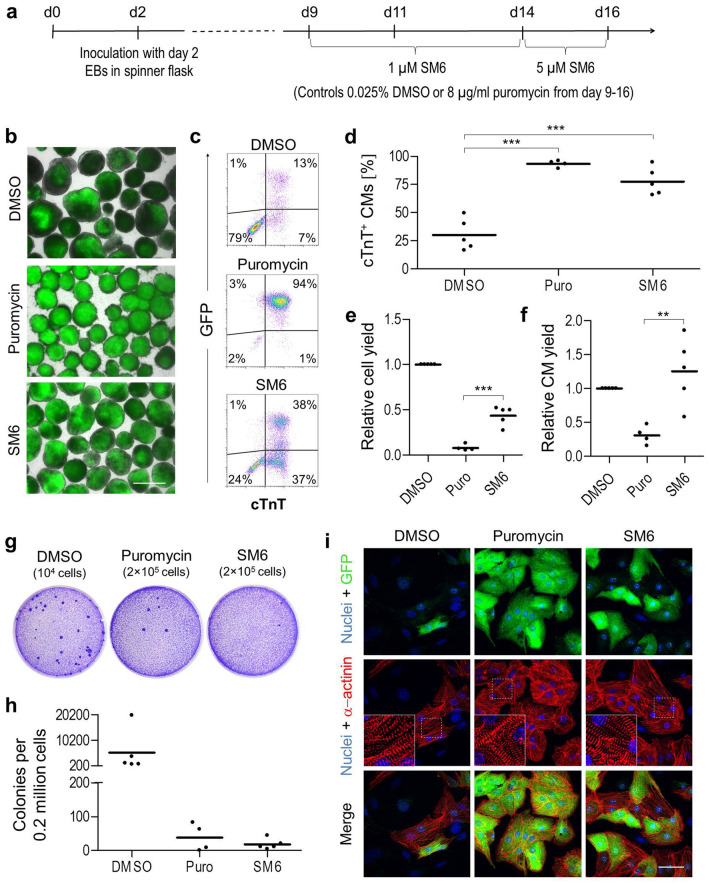
Clinical translation of pluripotent stem cell (PSC) derivatives is hindered by the tumorigenic risk from residual undifferentiated cells. Here, we identified salicylic diamines as potent agents exhibiting toxicity to murine and human PSCs but not to cardiomyocytes (CMs) derived from them. Half maximal inhibitory concentrations (IC50) of small molecules SM2 and SM6 were, respectively, 9- and 18-fold higher for human than murine PSCs, while the IC50 of SM8 was comparable for both PSC groups. Treatment of murine embryoid bodies in suspension differentiation cultures with the most effective small molecule SM6 significantly reduced PSC and non-PSC contamination and enriched CM populations that would otherwise be eliminated in genetic selection approaches. All tested salicylic diamines exerted their toxicity by inhibiting the oxygen consumption rate (OCR) in PSCs. No or only minimal and reversible effects on OCR, sarcomeric integrity, DNA stability, apoptosis rate, ROS levels or beating frequency were observed in PSC-CMs, although effects on human PSC-CMs seemed to be more deleterious at higher SM-concentrations. Teratoma formation from SM6-treated murine PSC-CMs was abolished or delayed compared to untreated cells. We conclude that salicylic diamines represent promising compounds for PSC removal and enrichment of CMs without the need for other selection strategies.


Conflict of interest statement

The use of the compounds described in this study for elimination of PSCs from their differentiated derivatives is covered by the Patent Application No. 18796954.8-1111. The authors A.B., T.Š., K.B. and J.H. are listed as inventors on this application. These authors declare no additional competing interests. The authors H.T., S.H., M.O., G.P., J.W.K., W.H. and K.P. declare no financial or non-financial conflicts of interest. Results described in this manuscript were used by K.B. in partial fulfillment of the requirements for the PhD degree at the University of Cologne.

Figures

Figure 1
Figure 1
Toxicity of small molecules SM1-SM16 against miPSC line aPIG-AT25. (a) Chemical structures of 10 salicylic diamines (SM1-10) and 6 square amides (SM11-16) used in a cytotoxicity screen. (b) Relative viability of miPSCs after 48 h of treatment with the indicated concentrations of SMs (mean ± SD; n = 4). Control cells were treated with 0.125% DMSO or 8 μg/ml puromycin (Puro). Similar results were obtained in two additional independent experiments.
Figure 2
Figure 2
Cytotoxic effects of selected SMs on undifferentiated murine iPSCs and purified murine and human iPSC-CMs. (a) Dose response curves for cytotoxicity of indicated SMs on miPSCs and miPSC-CMs after 48 h of treatment with various SM concentrations. Results are shown as relative values compared to 0.05% DMSO treated cells (mean ± SD). Data for miPSCs were pooled from two (SM1, SM4, SM5), three (SM2, SM8) or six (SM6) independent experiments with 4 replicates analyzed in each. Analyses with miPSC-CMs were performed in three independent experiments for each SM. Therapeutic index (TI) was calculated by dividing the IC50 of miPSC-CMs by the IC50 of miPSCs. (b) Dose response curves for cytotoxicity of indicated SMs on human iPSCs (NP0040 cell line) and human iPSC-CMs (day 46 of differentiation) after 48 h of treatment with various SM concentrations. Results are shown as relative values compared to 0.05% DMSO treated cells (mean ± SD). Data for hiPSCs-CMs were pooled from two independent experiments with 4 replicates analyzed in each. Therapeutic index (TI) was calculated by dividing the IC50 of hiPSC-CMs by the IC50 of hiPSCs. (c) Representative images of NP0040 hiPSCs (bright-field) and hiPSC-CMs (immunofluorescence) after 48 h treatment with controls and various concentrations of indicated SMs. At the end of the treatment, hiPSC-CMs were fixed with 3% PFA and stained with antibodies against sarcomeric α-actinin (red). Nuclei were counterstained with Hoechst 33342 (blue). Images shown are digitally magnified insets from the originals taken with the 20 × objective on Axiovert 200 M microscope. Scale bars: 50 μm. See also Supplementary Figs. S2, S3 and S4.
Figure 3
Figure 3
Effect of SM2, SM6 and SM8 on iPSC-CMs. (a, b) Representative images of active caspase-3 (a, red) and sarcomeric α-actinin (b, red) in αPIG-AT25-iPSC-derived CMs treated for 48 h with 10 µM of indicated SMs (in a, b) and after 72 h of recovery (in a). Insets in b: magnified views of boxed areas. (c) CM beating rates after 48 h of SM treatment and 72 h of subsequent recovery (mean ± SD; N = 8 pooled from two independent experiments). (d, e) ROS-levels in CMs after 48 h of 10 µM SM-treatment were visualized by fluorescence microscopy using CellROX reagent (d, yellow) and quantified by Image J (e). Data are presented as mean ± SD (n = 3). RFI: relative fluorescence intensity. Similar results were obtained in one additional independent experiment. (f, g) Representative images of miPSC-CMs (f) stained for a DNA damage marker γ-H2A.X (red) after 48 h of treatment with 10 µM of indicated SMs and 72 h of recovery (f). Quantification of γ-H2A.X positive nuclei in this experiment is shown in g (mean ± SD; n = 5 wells; on average, a total of 770 nuclei were scored per group). Similar results were obtained in one additional independent experiment. (h) ICC staining of α-actinin (green) and γ-H2A.X (red) after 48 h treatment of Cor.4U hiPSC-CMs provided by Axiogenesis with 10 µM SM2, 3.3 µM SM6 and 0.5 µM SM8. Negative controls in all experiments included 0.05% DMSO. Positive controls included 75 µg/ml cisplatin (A, B) or 20 µg/ml bleomycin (F, G). Nuclei in panels (a, b, d, f and h) were stained in blue with Hoechst 33,342. Scale bars: 25 µm (a), 100 µm (b, d, f, h). * p < 0.05, ** p < 0.01, *** p < 0.001. See also Supplementary Figs. S4, S5 and S6.
Figure 4
Figure 4
Salicylic diamines inhibit basal respiration and maximal respiratory capacity to a different extent in miPSCs, hiPSCs and miPSC-CMs. (a, ce) Basal respiration and OCR response to FCCP-induced (1 µM) protonophoric uncoupling in undifferentiated αPIG-AT25 miPSCs after 16 h of SM treatment (a), in undifferentiated NP0040 hiPSCs after 24 h of treatment (c) and in purified miPSC-CMs after 48 h of SM treatment (d) as well as after 72 h of recovery following treatment (e). Data are shown as relative values compared to 0.05% DMSO-treated control cells and are presented as mean ± SD of n = 3 measurements from one experiment in (a and c), and n = 6 measurements pooled from two independent experiments in d and e. Each measurement was performed with 7 replicates per group. See also Supplementary Fig. S5. (b) Immunoblot analysis. miPSCs and miPSC-CMs were treated with 10 µM SM6 or vehicle (0.05% DMSO) for 8 h and then fractionated into cytoplasmic (Cy), mitochondrial (Mi) and nuclear (Nu) fractions. Levels of p53, cytosolic marker α-tubulin (α-TUB), and mitochondrial marker voltage-dependent anion channel (VDAC) were determined in each fraction and compared with those from whole cell lysates (WCL) by immunoblotting. C1 and C2 indicate control WCLs prepared from, respectively, human HEK293 and HT29 cells in the panel for iPSCs, and HEK293 and COS9 cells in the panel for iPSC-CMs. They served as positive controls for p53. Molecular weight of human p53 is slightly higher than that of murine p53 which explains different positions of this protein in murine iPSC and iPSC-CM (*) and human control samples in C1 and C2 lanes (◄). Full-length immunoblots of all analyses are shown in Supplementary Figs. S8, S9 and S10. KDa kilodalton, M protein marker.
Figure 5
Figure 5
SM6 selectively eliminates undifferentiated PSCs in partially purified miPSC-CMs generated in suspension cultures as cardiac clusters. (a) Time course of αPIG-AT25 miPSC cardiogenic differentiation and drug treatment. (b) Representative bright field and GFP-fluorescence images (overlay) of miPSC-derived GFP-expressing cardiac clusters from day 16 of differentiation after 2 day treatment with indicated drugs. Scale bar: 100 µm. (c) Representative images of crystal-violet-stained PSC-colonies (dark blue spots) formed after growing 2 × 105 cells derived from day 16 cardiac clusters in one 6 cm plate for 7–10 days in mPSC culture conditions. (d) Oct4 expression (red) confirms the PSC identity of colonies detected by crystal violet in panel C. (e) Quantification of PSC-colonies per 2 × 105 cells/plate seeded as described in panel C (mean ± SD; n = 19 from five independent experiments). *** p < 0.001. (f) Total yield of cells harvested from day 16 cardiac clusters after treatment with indicated drugs. Results are shown as relative values compared to DMSO-treated control (mean ± SD; n = 9 from five independent experiments). ** p < 0.01. (g) Flow cytometric analysis of GFP-expressing day 16 CMs treated with indicated reagents and stained for cardiac troponin T (cTnT) in one representative differentiation experiment. See also Supplementary Fig. S7.
Figure 6
Figure 6
SM6 reduces the risk of teratoma formation from residual PSCs in miPSC-CM preparations. (a) Time course of cardiac differentiation of firefly luciferase (FLuc)-expressing αPIG-AT25 miPSCs and drug treatment schedule. (b) Representative images of day 16 cardiac clusters after treatment with indicated drugs. Scale bar: 100 µm. (c, d) Determination of miPSC contamination levels in control and drug treated day 16 cardiac clusters by crystal-violet staining. PSC-colonies were identified as dark blue spots (c) and quantified (d) after growing 2 × 105 cells derived from dissociated clusters for 7–10 days under mPSC culture conditions. The number of PSC-colonies found in each group is presented as mean ± SD of n = 3 plates. (e, f) Expression of Lin28 mRNA in αPIG-AT25 miPSCs and day 16 cardiac clusters after 48 h treatment with indicated drugs. RNA was isolated and RT-qPCR (e) and semi-quantitative RT-PCR (f) were performed. Gene expression levels in e were plotted relative to Lin28 expression in miPSCs. GAPDH was used as a reference gene. (g) Representative BL images of mice taken on day 8, 38 and 133 after injection into the right hind limb of 1 × 106 FLuc-expressing cells dissociated from day 16 cardiac clusters after treatment with indicated drugs. (h, i) BL signal intensities (h) and hind limb volumes (i) measured at the indicated time points after miPSC-CM transplantation. Each data point represents one animal (n = 6–9 mice per group). (j) Representative H&E-stained images of teratomas formed from DMSO- and SM6-treated miPSC-CMs in mice on day 21 and 42 after transplantation, respectively.
Figure 7
Figure 7
Selective elimination of PSCs and enrichment of CMs with SM6 alone. (a) Time course of cardiac differentiation of αPIG-AT25 miPSCs and drug treatment schedule. (b) Representative bright field and GFP-fluorescence images (overlay) of cell aggregates on day 16 of differentiation. Scale bar: 100 µm. (c, d) Flow cytometric analysis (c) and quantification (d) of CM purity in dissociated day 16 clusters after treatment with indicated drugs. CMs were identified based on expression of αMHC-driven GFP and endogenous cTnT. Each data point in d represents results from one independent experiment (n = 4–5). (e, f) Yields of all cells (e) and cTnT+ CMs (f) in puromycin- and SM6-treated day 16 cardiac clusters relative to DMSO-treated controls shown as individual data points from 4–5 independent experiments. (gh) Representative images (g) and quantification (h) of crystal-violet-stained PSC colonies formed after plating the indicated number of cells derived from day 16 clusters in each group onto one 6 cm plate and growing for 7 days under mPSC culture conditions. Individual data points represent average number of PSC-colonies detected in each of 4–5 independent differentiation experiments. (i) Representative confocal microscopic images of α-actinin-stained CMs derived from day 16 clusters in respective experimental groups. Scale bar: 50 µm. Insets: enlarged views of boxed areas. Horizontal lines in panels (d, e, f and h) indicate means. **p < 0.01, ***p < 0.001.

Similar articles

Cited by

References

    1. GBD 2019 Diseases and Injuries Collaborators Global burden of 369 diseases and injuries in 204 countries and territories, 1990-2019: a systematic analysis for the Global Burden of Disease Study 2019. Lancet. 2020;396:1204–1222. doi: 10.1016/S0140-6736(20)30925-9. - DOI - PMC - PubMed
    1. Zhao X, et al. Comparison of non-human primate versus human induced pluripotent stem cell-derived cardiomyocytes for treatment of myocardial infarction. Stem Cell Rep. 2018;10:422–435. doi: 10.1016/j.stemcr.2018.01.002. - DOI - PMC - PubMed
    1. Kashiyama N, et al. MHC-mismatched allotransplantation of induced pluripotent stem cell-derived cardiomyocyte sheets to improve cardiac function in a primate ischemic cardiomyopathy model. Transplantation. 2019;103:1582–1590. doi: 10.1097/TP.0000000000002765. - DOI - PubMed
    1. Liu YW, et al. Human embryonic stem cell-derived cardiomyocytes restore function in infarcted hearts of non-human primates. Nat. Biotechnol. 2018;36:597–605. doi: 10.1038/nbt.4162. - DOI - PMC - PubMed
    1. Ben-David U, Benvenisty N. The tumorigenicity of human embryonic and induced pluripotent stem cells. Nat. Rev. Cancer. 2011;11:268–277. doi: 10.1038/nrc3034. - DOI - PubMed

Publication types

LinkOut - more resources