. 2021 Jan 27;11(1):2335.
doi: 10.1038/s41598-021-81511-1.

Birth elicits a conserved neuroendocrine response with implications for perinatal osmoregulation and neuronal cell death

Affiliations

Birth elicits a conserved neuroendocrine response with implications for perinatal osmoregulation and neuronal cell death

Yarely C Hoffiz et al. Sci Rep. .

Abstract

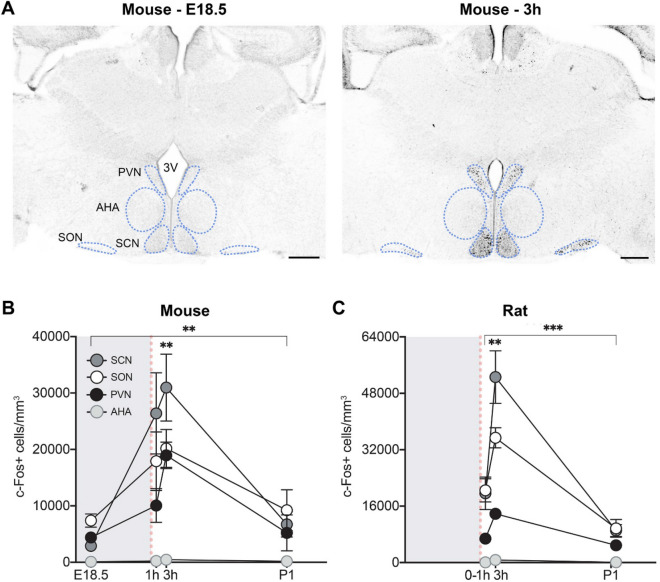
Long-standing clinical findings report a dramatic surge of vasopressin in umbilical cord blood of the human neonate, but the neural underpinnings and function(s) of this phenomenon remain obscure. We studied neural activation in perinatal mice and rats, and found that birth triggers activation of the suprachiasmatic, supraoptic, and paraventricular nuclei of the hypothalamus. This was seen whether mice were born vaginally or via Cesarean section (C-section), and when birth timing was experimentally manipulated. Neuronal phenotyping showed that the activated neurons were predominantly vasopressinergic, and vasopressin mRNA increased fivefold in the hypothalamus during the 2-3 days before birth. Copeptin, a surrogate marker of vasopressin, was elevated 30-to 50-fold in plasma of perinatal mice, with higher levels after a vaginal than a C-section birth. We also found an acute decrease in plasma osmolality after a vaginal, but not C-section birth, suggesting that the difference in vasopressin release between birth modes is functionally meaningful. When vasopressin was administered centrally to newborns, we found an ~ 50% reduction in neuronal cell death in specific brain areas. Collectively, our results identify a conserved neuroendocrine response to birth that is sensitive to birth mode, and influences peripheral physiology and neurodevelopment.


Conflict of interest statement

The authors declare no competing interests. All data needed to evaluate the conclusions of this paper are present in the Results and Supplementary Material sections. Additional data related to this paper may be requested from the authors.

Figures

Figure 1
Figure 1
Birth induces neural activation in specific hypothalamic regions of mice and rats. (A) Photomicrographs show that in comparison to 12 h before expected delivery (E18.5), there is elevated c-Fos immunoreactivity in the mouse SCN, SON, and PVN at 3 h after birth. 3V, third ventricle. Scale bar: 300 µm. (B) Quantification shows a significant main effect of age on c-Fos+ cell density in the SCN, SON, PVN, and AHA (asterisks over bracket, **P < 0.005), with neural activation peaking at 3 h post-delivery in all regions [**P < 0.004 compared to E18.5 and postnatal day (P) 1]. However, peak density of labeled cells in the AHA was less than one-fortieth of that in the other regions. (C) Similar effects of birth on c-Fos immunoreactivity were observed in the rat SCN, SON, PVN, and AHA [asterisk over bracket corresponds to main effect of age (***P < 0.0009 for all brain areas; post hocs: **P < 0.004 for 3 h compared to 0-1 h and P1)]. Gray shading indicates in utero timepoints; red dotted lines indicate the time of birth. Data are mean ± SEM. n = 10–12 animals per group.
Figure 2
Figure 2
Phenotyping of activated cells in the SCN, SON, and PVN in perinatal mice. (A–F) Percent of c-Fos+ cells at E18.5, 3 h postnatal and P1 that co-label for VP, OT, or CRH. The height of each bar reflects the c-Fos+ cell density at each age relative to 3 h. c-Fos+ cell density was higher at 3 h compared to E18.5 or P1 in all regions. (A) In the SCN, the majority of c-Fos+ cells at 3 h and P1 were VP + (green) and a smaller percentage were unidentified (gray). In the SON, the majority of c-Fos+ cells were VP + at all timepoints (B), and a smaller percentage were OT + (blue) (C). In the PVN, one third of all c-Fos+ cells were VP + (D), and a smaller percentage were OT + (E) or CRH + (red) (F) at 3 h; about half of the c-Fos+ cells were unaccounted for. (G–I) The percent of VP, OT, and CRH cells at each timepoint that were c-Fos+. In the SCN (G), SON (H) and PVN (I), significantly more VP neurons were c-Fos+ at 3 h postnatal than at E18.5 or P1. In the SON, OT neurons also had increased c-Fos labeling at 3 h compared to E18.5 and P1. Gray shading indicates in utero timepoints; red dotted line indicates the time of birth. Data are mean ± SEM. N at each age = 11–12 for VP and OT, and 6–8 for CRH. **P < 0.005, ****P < 0.0001.
Figure 3
Figure 3
Dual label immunofluorescence of c-Fos+ with vasopressin or oxytocin. In the PVN (A) and SON (B), many c-Fos+ cells (red, nuclear stain) are positive for vasopressin (green, cytoplasmic stain). A smaller number of c-Fos+ cells in the PVN (C) and SON (D) co-label for oxytocin. All images are from pups collected 3 h after birth. Arrows point to double-labeled cells. 3V, third ventricle. Scale bar: 50 µm (main images); 10 µm (insets).
Figure 4
Figure 4
Neural activation is independent of birth mode or birth timing. (A) c-Fos+ cell density in pups born vaginally or by C-section. Neural activation was higher at 3 h postnatal compared to E18.5 in the SCN, SON, and PVN, although this was significant only for the PVN and SON. In all three brain areas, the neural activation at 3 h postnatal was similar whether pups were delivered vaginally (black circles) or by C-section (open circles). (B) Phenotyping in the PVN showed that both VP (green) and OT (blue) neurons were activated at 3 h post-delivery compared to E18.5 (asterisk over bracket; P < 0.0001 for VP and P = 0.02 for OT), and this activation was similar whether pups were delivered vaginally or by C-section. (C) c-Fos+ cell density after an early birth. As was seen for on-time deliveries, the density of c-Fos+ cells was elevated at 3 h postnatal in the SCN, SON, and PVN in pups delivered one day early (P < 0.0001 in all cases). (D) Both VP and OT neurons in the PVN were activated 3 h after an early delivery (asterisks over bracket, ****P < 0.0001 in both cases), and the effect was greater for VP neurons (P < 0.0001). Gray shading indicates in utero timepoints; red dotted line indicates the timing of birth. Data are mean ± SEM. n = 11–13 animals per group.
Figure 5
Figure 5
Plasma copeptin and neural VP expression are elevated perinatally. (A) Plasma copeptin levels were extremely high in fetuses on E18.5. Levels dropped somewhat at birth (0 h) and further by 3 h postnatal. Copeptin levels decreased more abruptly in pups delivered by C-section than in those delivered vaginally, and differed significantly between the two birth-mode groups at 3 h (*P < 0.04). Copeptin was undetectable in non-pregnant adults (gray circles) and in all pregnant dams that delivered by C-section (open circles). Dams that delivered vaginally (black circles) had detectable copeptin levels that, nonetheless, were significantly lower than their pups at 0 h (P < 0.04). Number of samples per group: E18.5 = 6; 0 h vaginal = 4; 0 h C-section = 4; 3 h vaginal = 4; 3 h C-section = 4; non-pregnant adults = 3; dams = 6. (B) VP mRNA expression in the hypothalamus increases five-fold in the last few days of gestation. VP mRNA was low three days before expected delivery (E16.5), but increased markedly 12 h prior to birth (E18.5). VP expression remained elevated at E19 and 3 h postnatal, and dropped to prenatal levels by weaning (P23). ***P < 0.0003 vs. E16.5 and P23. Birth mode had no effect on VP expression at 3 h. Gray shading indicates in utero timepoints; red dotted line indicates the timing of birth. Data are mean ± SEM. n = 8–12 animals per group.
Figure 6
Figure 6
Plasma osmolality is acutely decreased after a vaginal, but not Cesarean, delivery. Relative to prenatal levels or levels at P1, plasma osmolality was decreased at 1 h (*P < 0.05) and 3 h (***P < 0.0002) after vaginal birth. This decrease was not observed in C-section-delivered pups, which had significantly higher plasma osmolality at 3 h postnatal than did vaginally-delivered pups (++++P < 0.0001). Red horizontal shading indicates normal osmolality range in mouse plasma. Gray shading indicates in utero timepoints; red dotted line indicates the timing of birth. Data are mean ± SEM. n = 6–12 per group.
Figure 7
Figure 7
Intracerebroventricular administration of VP at birth reduces neuronal cell death in the PVN and AHA three hours after C-section delivery. Cell death density (activated caspase-3 + cells per mm3) was not affected in the SON or LHb of the same animals. Data are mean ± SEM. n = 6 for vehicle and 7 for VP group. *P < 0.05.

Similar articles

Cited by

References

    1. Morton SU, Brodsky D. Fetal physiology and the transition to extrauterine life. Clin. Perinatol. 2016;43:395–407. doi: 10.1016/j.clp.2016.04.001. - DOI - PMC - PubMed
    1. Gluckman PD, Sizonenko SV, Bassett NS. The transition from fetus to neonate–an endocrine perspective. Acta Paediatr. Suppl. 1999;88:7–11. doi: 10.1111/j.1651-2227.1999.tb14344.x. - DOI - PubMed
    1. Spoljaric A, et al. Vasopressin excites interneurons to suppress hippocampal network activity across a broad span of brain maturity at birth. Proc. Natl. Acad. Sci. USA. 2017;114:E10819–E10828. doi: 10.1073/pnas.1717337114. - DOI - PMC - PubMed
    1. Tyzio R, et al. Maternal oxytocin triggers a transient inhibitory switch in GABA signaling in the fetal brain during delivery. Science. 2006;314:1788–1792. doi: 10.1126/science.1133212. - DOI - PubMed
    1. Onimaru H, Homma I. Spontaneous oscillatory burst activity in the piriform-amygdala region and its relation to in vitro respiratory activity in newborn rats. Neuroscience. 2007;144:387–394. doi: 10.1016/j.neuroscience.2006.09.033. - DOI - PubMed

Publication types

LinkOut - more resources