. 2021 Jan 27;11(1):2310.
doi: 10.1038/s41598-021-81866-5.

Vertical sleeve gastrectomy induces distinctive transcriptomic responses in liver, fat and muscle

Affiliations

Vertical sleeve gastrectomy induces distinctive transcriptomic responses in liver, fat and muscle

Chang Ho Ahn et al. Sci Rep. .

Abstract

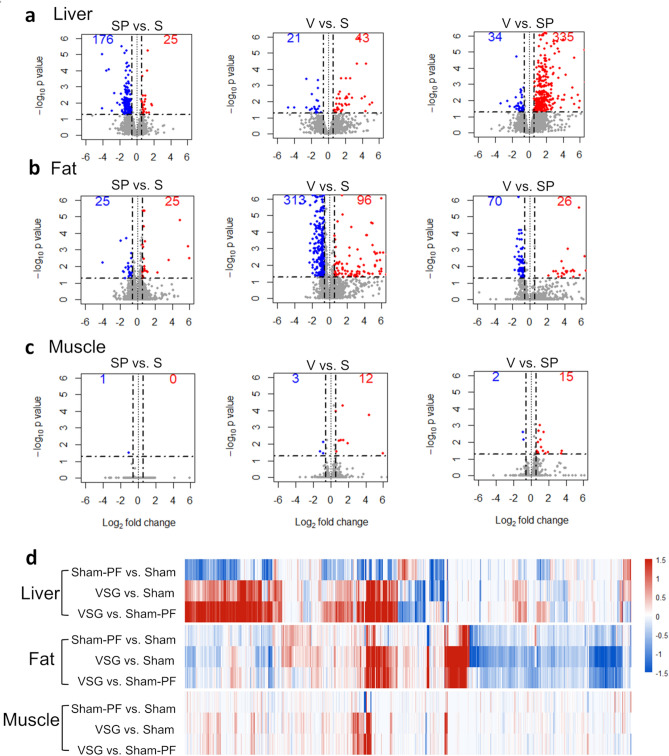
Vertical sleeve gastrectomy (VSG) is the most commonly performed bariatric/metabolic surgery, exhibiting a high rate of diabetes remission in humans. To elucidate the molecular mechanisms of VSG, we performed transcriptomic analysis of the liver, fat, and muscle in VSG mice. C57BL/6 mice fed a high-fat diet were randomly assigned to sham or VSG surgery. The sham-operated mice were fed ad libitum (sham group) or pair-fed (sham-PF group) matching their food intake to the VSG-operated mice. Comparative transcriptomic analysis of the liver, fat, and muscle using RNA sequencing was performed. VSG reduced body weight and improved glucose tolerance compared to the sham group, but not more than the sham-PF group. Improvement in fatty liver and adipose tissue inflammation was comparable between VSG and sham-PF. However, global gene expression profiles showed distinctive changes in the liver, fat, and muscle of the VSG group compared to both the sham or sham-PF groups. The liver showed the most prominent gene expression changes. Immune response-related pathways were commonly upregulated in the three organs of the VSG group compared to the sham or sham-PF. VSG induces organ-specific gene expression changes in the liver, fat, and muscle, which may play critical roles in metabolic improvements after VSG.


Conflict of interest statement

The authors declare no competing interests.

Figures

Figure 1
Figure 1
VSG induced sustained weight loss and improved glucose tolerance. (a) Body weight, (b) weekly food intake and (c) cumulative food intake during 7 weeks after surgery. (d) Blood glucose levels during the oral glucose tolerance test and the AUC of glucose levels (inset figure). (e) Blood glucose levels during the intraperitoneal glucose tolerance test and the AUC of glucose levels (inset figure). (f) The blood glucose levels during the insulin tolerance test and the decremental AUC, which is the area under the curve of the glucose levels below the baseline glucose level (inset figure). (g) HOMA-IR is defined as fasting glucose level (mg/dl) × fasting insulin level (μU/ml)/405. (h) The plasma insulin levels of fasted and 15 min after the oral glucose challenge. (i) Insulinogenic index is the increment of the insulin divided by the increment of the glucose level between fasting and 15 min after the oral glucose challenge. (j) The plasma GLP-1 levels of fasted and 15 min after the oral glucose challenge. N = 12 in each group. Comparison: Repeated measured ANOVA with Sidak’s post hoc test. *P < 0.05 for sham versus VSG. Data are mean with SEM. P < 0.05 for sham versus sham-PF. P < 0.05 for sham-PF versus VSG.
Figure 2
Figure 2
Histologic evaluation of the liver and fat. (a) The representative images of the H&E staining of the liver tissue. (b) The lipid droplet area of the liver, (c) NAFLD activity score and (d) liver weight. (e) The representative images of the H&E staining of the fat tissue. Arrows indicate crown-like structures. (f) The number of crown-like structure per high power field and (g) adipocyte size. N = 8 in each group. Comparison: ANOVA with Tukey’s post hoc test. *P < 0.05 for sham versus VSG. P < 0.05 for sham versus sham-PF.
Figure 3
Figure 3
Global gene expression profiles of the liver, fat and muscle. The volcano plot of (a) the liver, (b) fat and (c) muscle. The DEG was defined as adjusted P value < 0.05 and fold change ≥ 1.5. (d) Heatmap showing log2 fold change in the three comparison: sham-PF versus sham, VSG versus sham, and VSG versus sham-PF. Each column represent a gene and genes that showed adjusted P value < 0.05 in any of the three organs are included in the heatmap. The numbers of mice included in the RNA sequencing analysis were 4, 3, and 3 for the sham, sham-PF, and VSG group, respectively. S, Sham group; SP, sham-PF group, V, VSG group.
Figure 4
Figure 4
The comparison of gene expression profile between the VSG and RYGB model. (a) PCA plot of the VSG and RYGB model and their respective control groups. conRYGB, weight-matched control mice of the RYGB mice; conVSG, pair-fed control mice of the VSG mice. (b) Correlation between the gene expression changes of the VSG and RYGB model. Red indicates a positive correlation, while blue indicates a negative correlation. ‘*’ denotes significant by P value < 0.05. All other correlations were significant with P value < 0.001. The expression patterns of the genes of the (c) metabolic process and (d) the immune system process in the VSG and RYGB model. Heatmap shows log2 fold change. Each row represents a gene. Any genes that showed adjusted P value < 0.05 in any of the three organs are included in the heatmap.
Figure 5
Figure 5
Pathway analyses of the liver, fat and muscle in the VSG group. The enrichment analyses of gene ontology and KEGG pathways in (a) the liver, (b) fat, and (c) muscle in the VSG group compared to the sham-PF group and (d) the liver, (e) fat, and (f) muscle in the VSG group compared to the sham group are summarized. Top 5 gene ontologies or KEGG pathways with adjusted P value < 0.05 are shown.

References

    1. Madadi F, Jawad R, Mousati I, Plaeke P, Hubens G. Remission of type 2 diabetes and sleeve gastrectomy in morbid obesity: A comparative systematic review and meta-analysis. Obes. Surg. 2019;29:4066–4076. doi: 10.1007/s11695-019-04199-3. - DOI - PubMed
    1. The International Federation for the Surgery of Obesity and Metabolic Disorders. Fifth IFSO Global Registry Report 2019 (2019).
    1. Lee WJ, Aung L. Metabolic surgery for type 2 diabetes mellitus: Experience from Asia. Diabetes Metab. J. 2016;40:433–443. doi: 10.4093/dmj.2016.40.6.433. - DOI - PMC - PubMed
    1. Phillips BT, Shikora SA. The history of metabolic and bariatric surgery: Development of standards for patient safety and efficacy. Metab. Clin. Exp. 2018;79:97–107. doi: 10.1016/j.metabol.2017.12.010. - DOI - PubMed
    1. Madsbad S, Dirksen C, Holst JJ. Mechanisms of changes in glucose metabolism and bodyweight after bariatric surgery. Lancet Diabetes Endocrinol. 2014;2:152–164. doi: 10.1016/s2213-8587(13)70218-3. - DOI - PubMed

Publication types

LinkOut - more resources