

A candidate gene association analysis identifies SNPs potentially involved in drought tolerance in European beech (Fagus sylvatica L.)
- PMID: 33504857
- PMCID: PMC7840767
- DOI: 10.1038/s41598-021-81594-w
A candidate gene association analysis identifies SNPs potentially involved in drought tolerance in European beech (Fagus sylvatica L.)
Abstract
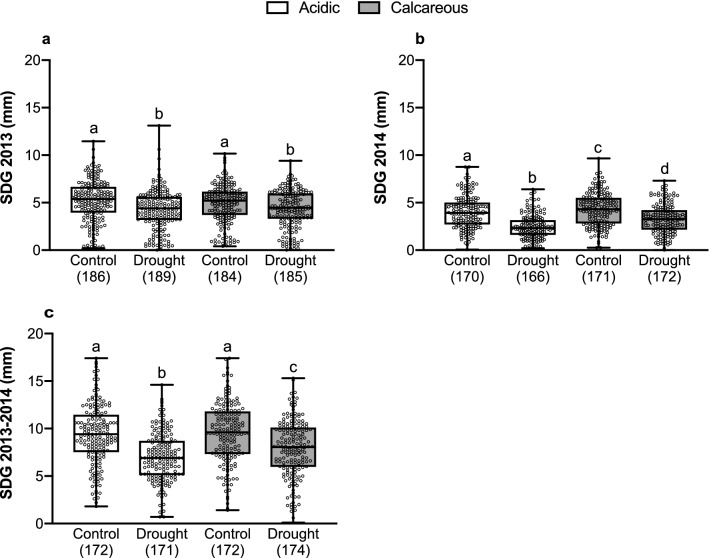
Studies of genetic variation underlying traits related to drought tolerance in forest trees are of great importance for understanding their adaptive potential under a climate change scenario. In this study, using a candidate gene approach, associations between SNPs and drought related traits were assessed in saplings of European beech (Fagus sylvatica L.) representing trees growing along steep precipitation gradients. The saplings were subjected to experimentally controlled drought treatments. Response of the saplings was assessed by the evaluation of stem diameter growth (SDG) and the chlorophyll fluorescence parameters FV/FM, PIabs, and PItot. The evaluation showed that saplings from xeric sites were less affected by the drought treatment. Five SNPs (7.14%) in three candidate genes were significantly associated with the evaluated traits; saplings with particular genotypes at these SNPs showed better performance under the drought treatment. The SNPs were located in the cytosolic class I small heat-shock protein, CTR/DRE binding transcription factor, and isocitrate dehydrogenase genes and explained 5.8-13.4% of the phenotypic variance. These findings provide insight into the genetic basis of traits related to drought tolerance in European beech and could support the development of forest conservation management strategies under future climatic conditions.
Conflict of interest statement
The authors declare no competing interests.
Figures


References
-
- Fang J, Lechowicz MJ. Climatic limits for the present distribution of beech (Fagus L.) species in the world. J. Biogeogr. 2006;33:1804–1819. doi: 10.1111/j.1365-2699.2006.01533.x. - DOI
-
- Ellenberg H. Vegetation ecology of Central Europe. Cambridge: Cambridge University Press; 1988.
-
- Trenberth K. Changes in precipitation with climate change. Clim. Res. 2011;47:123–138. doi: 10.3354/cr00953. - DOI
-
- Kovats RS, et al. et al. Europe. In: Barros VR, et al.et al., editors. Climate Change 2014: Impacts, Adaptation, and Vulnerability. Part B: Regional Aspects Contribution of Working Group II to the Fifth Assessment Report of the Intergovernmental Panel on Climate Change. Cambridge: Cambridge University Press; 2014. pp. 1267–1326.
-
- von Wühlisch G. EUFORGEN Technical Guidelines for Genetic Conservation and Use for European Beech (Fagus sylvatica) Rome, Italy: Bioversity International; 2008.
Publication types
MeSH terms
LinkOut - more resources
Full Text Sources
Other Literature Sources
Research Materials
Miscellaneous
