

Weighted gene co-expression network analysis identifies modules and functionally enriched pathways in the lactation process
- PMID: 33504890
- PMCID: PMC7840764
- DOI: 10.1038/s41598-021-81888-z
Weighted gene co-expression network analysis identifies modules and functionally enriched pathways in the lactation process
Erratum in
-
Author Correction: Weighted gene co-expression network analysis identifies modules and functionally enriched pathways in the lactation process.Sci Rep. 2021 Sep 8;11(1):18245. doi: 10.1038/s41598-021-97893-1. Sci Rep. 2021. PMID: 34497350 Free PMC article. No abstract available.
Abstract
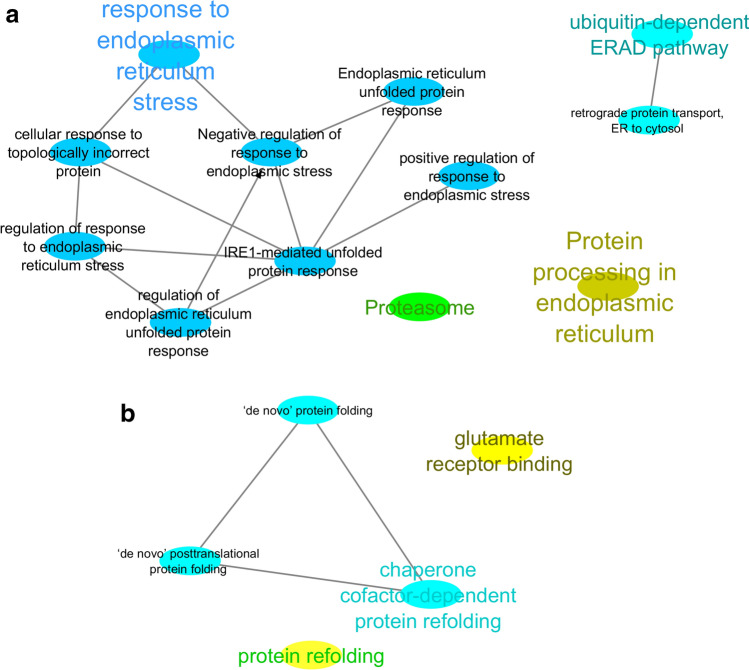
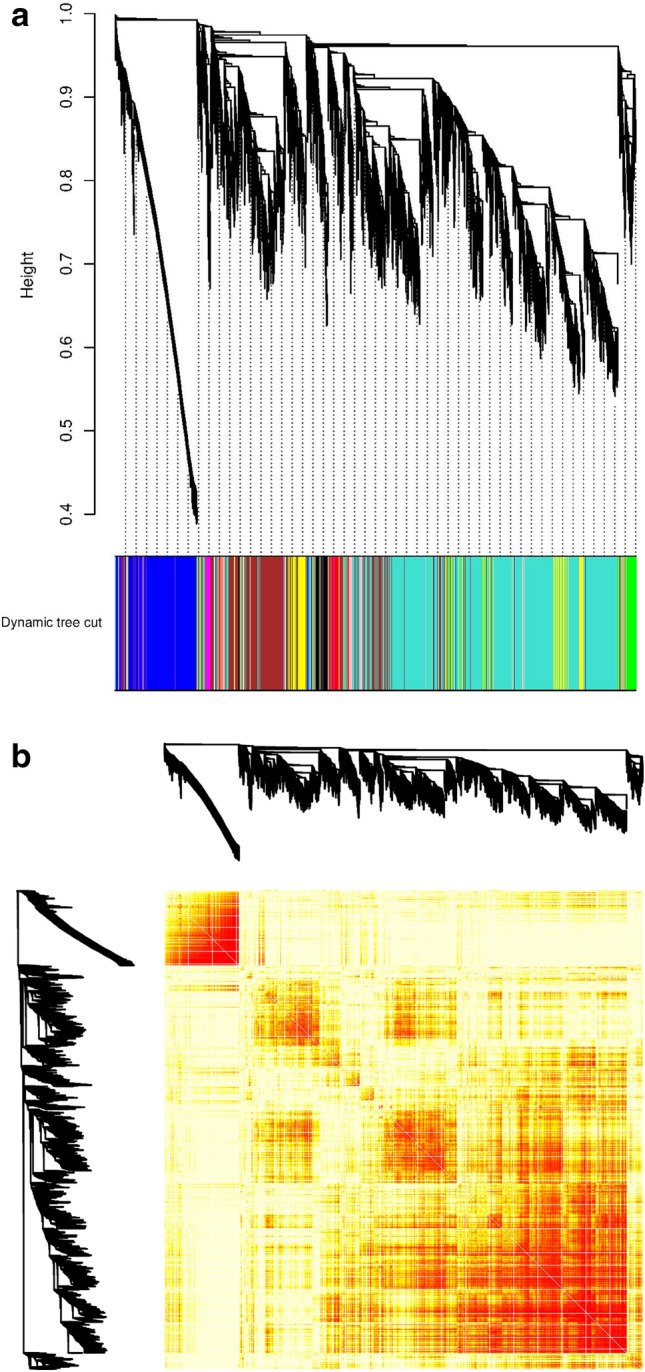
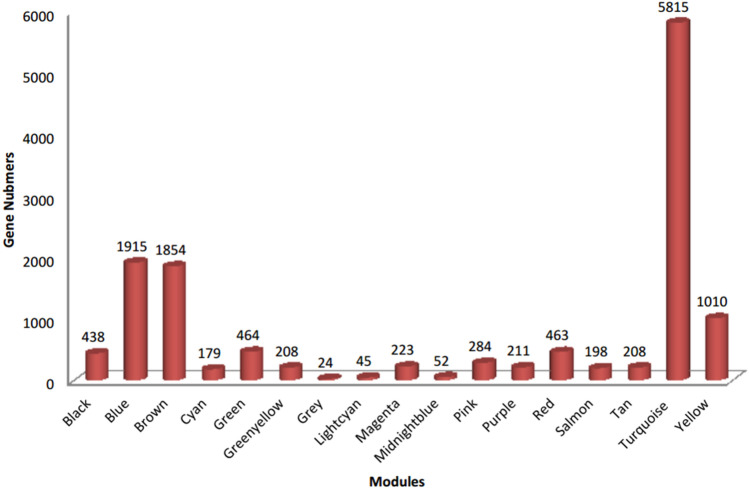
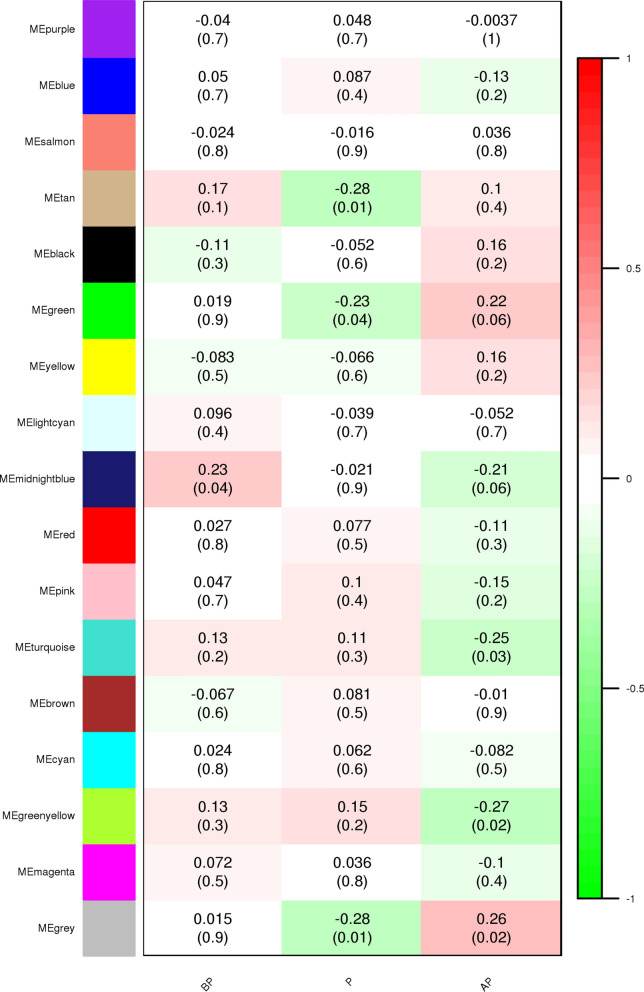
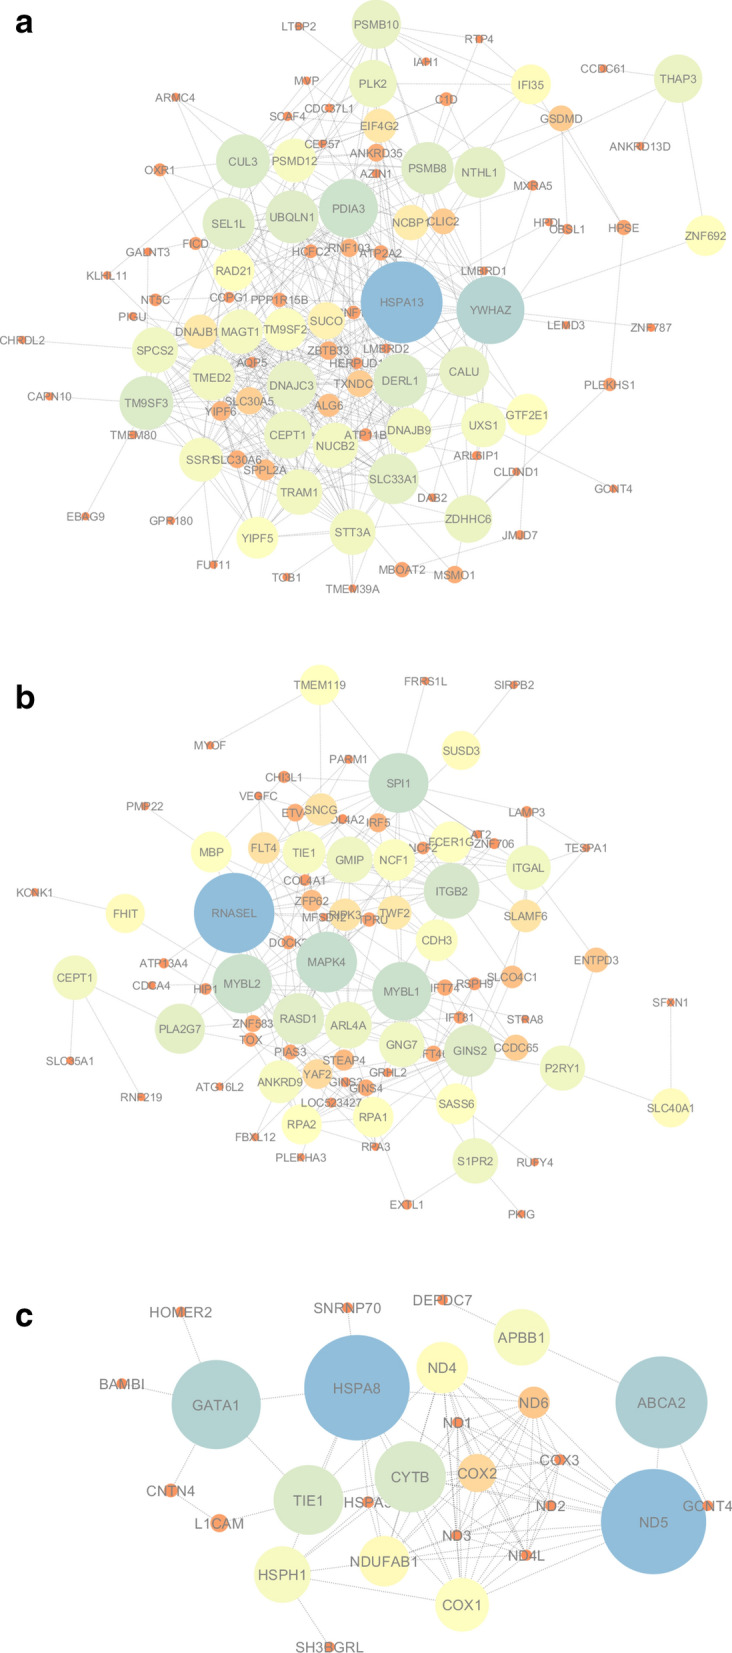
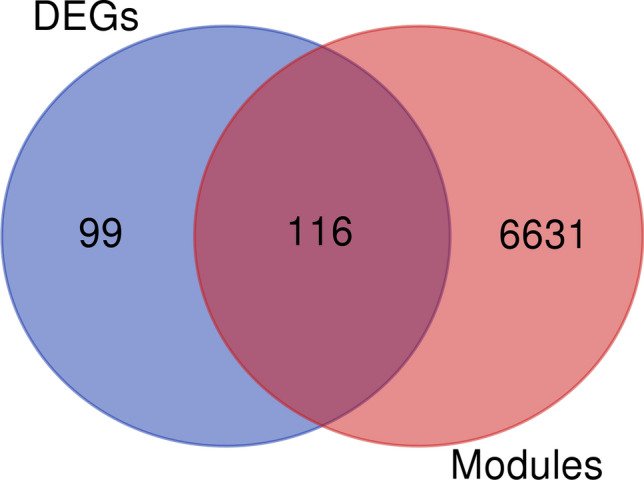
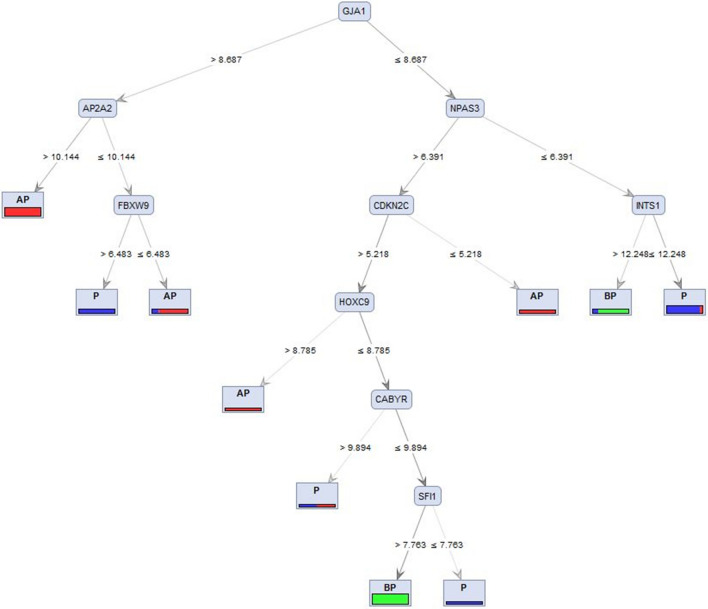
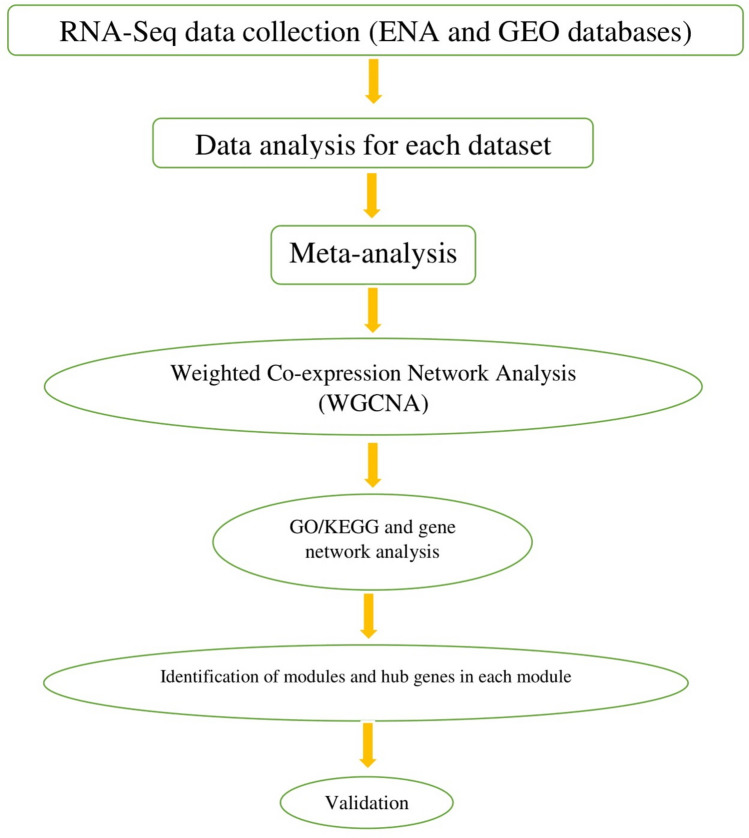
The exponential growth in knowledge has resulted in a better understanding of the lactation process in a wide variety of animals. However, the underlying genetic mechanisms are not yet clearly known. In order to identify the mechanisms involved in the lactation process, various mehods, including meta-analysis, weighted gene co-express network analysis (WGCNA), hub genes identification, gene ontology (GO), and Kyoto Encyclopedia of Genes and Genomes (KEGG) pathway enrichment at before peak (BP), peak (P), and after peak (AP) stages of the lactation processes have been employed. A total of 104, 85, and 26 differentially expressed genes were identified based on PB vs. P, BP vs. AP, and P vs. AP comparisons, respectively. GO and KEGG pathway enrichment analysis revealed that DEGs were significantly enriched in the "ubiquitin-dependent ERAD" and the "chaperone cofactor-dependent protein refolding" in BP vs. P and P vs. P, respectively. WGCNA identified five significant functional modules related to the lactation process. Moreover, GJA1, AP2A2, and NPAS3 were defined as hub genes in the identified modules, highlighting the importance of their regulatory impacts on the lactation process. The findings of this study provide new insights into the complex regulatory networks of the lactation process at three distinct stages, while suggesting several candidate genes that may be useful for future animal breeding programs. Furthermore, this study supports the notion that in combination with a meta-analysis, the WGCNA represents an opportunity to achieve a higher resolution analysis that can better predict the most important functional genes that might provide a more robust bio-signature for phenotypic traits, thus providing more suitable biomarker candidates for future studies.
Conflict of interest statement
The authors declare no competing interests.
Figures
Similar articles
-
Screening of key immune-related gene in Parkinson's disease based on WGCNA and machine learning.Zhong Nan Da Xue Xue Bao Yi Xue Ban. 2024 Feb 28;49(2):207-219. doi: 10.11817/j.issn.1672-7347.2024.230307. Zhong Nan Da Xue Xue Bao Yi Xue Ban. 2024. PMID: 38755717 Free PMC article. Chinese, English.
-
Application of Weighted Gene Coexpression Network Analysis to Identify Key Modules and Hub Genes in Systemic Juvenile Idiopathic Arthritis.Biomed Res Int. 2021 Aug 13;2021:9957569. doi: 10.1155/2021/9957569. eCollection 2021. Biomed Res Int. 2021. PMID: 34435051 Free PMC article.
-
Weighted gene co-expression network analysis combined with machine learning validation to identify key hub biomarkers in colorectal cancer.Funct Integr Genomics. 2022 Dec 28;23(1):24. doi: 10.1007/s10142-022-00949-2. Funct Integr Genomics. 2022. PMID: 36576616
-
Leveraging gene co-expression networks to pinpoint the regulation of complex traits and disease, with a focus on cardiovascular traits.Brief Funct Genomics. 2014 Jan;13(1):66-78. doi: 10.1093/bfgp/elt030. Epub 2013 Aug 19. Brief Funct Genomics. 2014. PMID: 23960099 Review.
-
Network medicine: a network-based approach to human disease.Nat Rev Genet. 2011 Jan;12(1):56-68. doi: 10.1038/nrg2918. Nat Rev Genet. 2011. PMID: 21164525 Free PMC article. Review.
Cited by
-
Cytokine interactions and chemokine dysregulations in mastitis immunopathogenesis: insights from transcriptomic profiling of milk somatic cells in tropical Sahiwal (Bos indicus) cows.Front Immunol. 2025 Mar 24;16:1554341. doi: 10.3389/fimmu.2025.1554341. eCollection 2025. Front Immunol. 2025. PMID: 40196120 Free PMC article.
-
In vitro atlas of dorsal spinal interneurons reveals Wnt signaling as a critical regulator of progenitor expansion.Cell Rep. 2022 Jul 19;40(3):111119. doi: 10.1016/j.celrep.2022.111119. Cell Rep. 2022. PMID: 35858555 Free PMC article.
-
ESRRG, ATP4A, and ATP4B as Diagnostic Biomarkers for Gastric Cancer: A Bioinformatic Analysis Based on Machine Learning.Front Physiol. 2022 Jun 23;13:905523. doi: 10.3389/fphys.2022.905523. eCollection 2022. Front Physiol. 2022. PMID: 35812327 Free PMC article.
-
The Skeletal Muscle Transcriptome Profile of Elderly Men with Metabolic Syndrome Based on Weighted Gene Co-Expression Network Analysis.Obes Facts. 2023;16(3):264-272. doi: 10.1159/000530216. Epub 2023 Apr 13. Obes Facts. 2023. PMID: 37054694 Free PMC article.
-
Effects of Methyl Farnesoate on the Growth and Antioxidant Capacity of Neocaridina denticulata.Antioxidants (Basel). 2025 May 25;14(6):635. doi: 10.3390/antiox14060635. Antioxidants (Basel). 2025. PMID: 40563269 Free PMC article.
References
-
- Farhadian M, Rafat SA, Hasanpur K, Ebrahimi M, Ebrahimie E. Cross-species meta-analysis of transcriptomic data in combination with supervised machine learning models identifies the common gene signature of lactation process. Front. Genet. 2018;9:235. doi: 10.3389/fgene.2018.00235. - DOI - PMC - PubMed
Publication types
MeSH terms
Substances
LinkOut - more resources
Full Text Sources
Other Literature Sources
