. 2021 Feb;590(7846):468-472.
doi: 10.1038/s41586-020-03146-y. Epub 2021 Jan 27.

Ebola virus antibody decay-stimulation in a high proportion of survivors

Collaborators, Affiliations

Ebola virus antibody decay-stimulation in a high proportion of survivors

Charlene Adaken et al. Nature. 2021 Feb.

Abstract

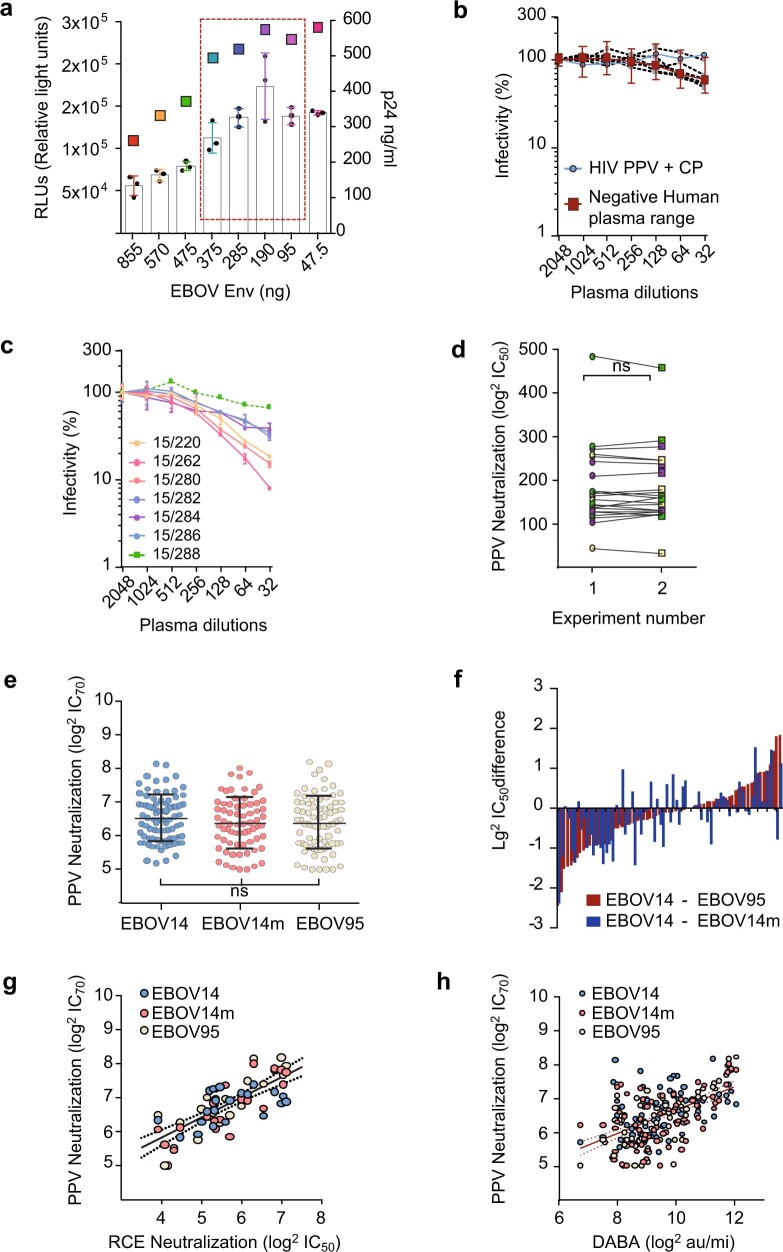
Neutralizing antibody function provides a foundation for the efficacy of vaccines and therapies1-3. Here, using a robust in vitro Ebola virus (EBOV) pseudo-particle infection assay and a well-defined set of solid-phase assays, we describe a wide spectrum of antibody responses in a cohort of healthy survivors of the Sierra Leone EBOV outbreak of 2013-2016. Pseudo-particle virus-neutralizing antibodies correlated with total anti-EBOV reactivity and neutralizing antibodies against live EBOV. Variant EBOV glycoproteins (1995 and 2014 strains) were similarly neutralized. During longitudinal follow-up, antibody responses fluctuated in a 'decay-stimulation-decay' pattern that suggests de novo restimulation by EBOV antigens after recovery. A pharmacodynamic model of antibody reactivity identified a decay half-life of 77-100 days and a doubling time of 46-86 days in a high proportion of survivors. The highest antibody reactivity was observed around 200 days after an individual had recovered. The model suggests that EBOV antibody reactivity declines over 0.5-2 years after recovery. In a high proportion of healthy survivors, antibody responses undergo rapid restimulation. Vigilant follow-up of survivors and possible elective de novo antigenic stimulation by vaccine immunization should be considered in order to prevent EBOV viral recrudescence in recovering individuals and thereby to mitigate the potential risk of reseeding an outbreak.


Conflict of interest statement

The authors declare no competing interests.

Figures

Fig. 1
Fig. 1. EBOV-GP HIV-1 pseudo-typed virus neutralization assay.
a, Virus produced in 10-cm culture dishes (n = 60) using 285 ng pEBOV14-GP, pEBOV14m or pEBOV95 plasmids. The infectivity of virus from each plate was assayed and plotted individually for the three virus strains (mean ± s.d. of duplicate measurements; Kruskal–Wallis test). b, Amino acid differences in the glycoproteins (yellow boxes) of the three virus isolates studied. The differences are found in the GP1 base (orange), GP1 head (blue), glycan cap (purple), mucin-like domain (green) and fusion loop (red). Black bars indicate potential N-linked glycosylation site modifications. In pEBOV14m-GP, the glycosylation at the 230 position is lost. c, Neutralization potential of CPs against three virus strains (pEBOV14-GP, n = 98; pEBOV95-GP, n = 80; pEBOV14m-GP, n = 79) expressed in IC50 (mean ± s.d. of duplicate measurements; Kruskal–Wallis test). NS, not significant. d, Differences in IC50 neutralization titres between virus strain pairs by each post-recovery study participant. e, Positive association between PPV IC50 titres and the live virus plaque reduction neutralization test (PRNT). f, Positive association between PPV IC50 neutralization titres and DABA. The simple linear regression is shown (solid line) with the 95% confidence interval (dotted line). AU, arbitrary units. Source data
Fig. 2
Fig. 2. Convalescent plasma neutralizing antibody titres.
a, b, nAb IC50 (a) and nAb IC70 (b) values against three PPV isolates (EBOV14 (n = 92), EBOV14m (n = 70) and EBOV95 (n = 76)) over time. c, nAb IC50 values against PRNT-EBOV14 (n = 30) over time. ac, Day 0 is defined as the day when the virus PCR test became negative or when the individual was declared Ebola-free and discharged from the Ebola treatment unit. Individual lines indicate individuals who donated sequential plasma samples, demonstrating non-canonical antibody titre variation. Dotted lines, 25th–75th quartiles; dashed lines, 5th–95th quartiles; red vertical lines, 95% confidence intervals (CI) of the linear association (red curve; calculated separately for each half of the observation period for PPV). d, Longitudinal post-cure antibody variation of donor CP-Pat-045 demonstrated by PPV neutralization of EBOV14 (light blue) and EBOV95 (dark blue) strains overlaid with virus neutralization using the RCE PRNT (green, top) or total antibodies measured by DABA (orange, bottom). e, f, Blocking EIAs using RCE were carried out to detect antibodies against the nucleoprotein (brown squares), the viral matrix protein 40 (VP40; purple squares) and the glycoprotein (green squares) using longitudinal plasma samples from donors CP-Pat-045 (e) and CP-Pat-049 (f). Source data
Fig. 3
Fig. 3. Rates of EBOV antibody decay and recovery following the 2013–2016 West Africa outbreak.
a, Schematic depicting the one-compartment model for first-order stimulation (based on a logistic growth model). It, antibody level at time t (the start of a stimulation or decay trend). b, Schematic depiction of the two-compartment decay and metabolism of IgG with saturable recycling. kend, endogenous decay rate. X1, kdecay and Kmax denote antibody level in the compartment, the empirically observed antibody level-dependent rate constant and the maximal antibody level at which stimulation plateaus, respectively. ch, Mean antibody stimulation (c, e, g) and decay (d, f, h) 25th, 50th and 75th percentile concentrations. Shaded areas surrounding percentile trajectories indicate 0.05 and 0.95 CI. c, d, Total anti-EBOV reactivity as measured by DABA. e, f, Neutralizing antibody titres against the EBOV14 virus strain. g, h, Neutralizing antibody titres against the EBOV95 Kikwit strain. Percentiles are calculated stimulation or decay profiles from Monte Carlo simulations of a population of 1,000 randomly sampled individuals. i, Graphic illustration of the post-infection acquired immune responses, illustrating the virus antigen stimulation hypothesis extrapolated from simulation of median fitted parameter values from the selected models. It depicts the acute sharp post-infection increase and the slow decrease following recovery. The observation period during this study is highlighted, demonstrating the increase in antibody reactivity after what is predicted to be a new antigenic stimulation occurring below a threshold of antibody protection. Source data
Extended Data Fig. 1
Extended Data Fig. 1. Development and characterization of Ebola pseudo-particle virus.
a, Variant pEBOV14-GP plasmid concentrations were transfected alongside 2000 ng of pSG3-HIV-1 backbone. The resulting pseudo-typed virus, quantified by a HIV-1-p24 capsid ELISA (squares), was tested for infectivity in TZM-bl cells as measured by luciferase activity (data are mean ± s.d.). The red marked square identifies the glycoprotein concentrations that can be used in the assay. b, Inhibition profiles with negative plasma donated from six individuals (grey squares), indicating no specific plasma inhibition during the neutralization assay. All negative assays and plasmas were combined to define the range within which negative plasma control were acceptable (red squares) thus defining a valid assay. The blue line shows the lack of reactivity on the HIV-1-enveloped pseudo-typed virus by EBOV neutralizing convalescent plasma (CP) (squares and circles indicate the median and the vertical lines the standard error). c, Neutralization profiles of pEBOV14-GP by the WHO reference panel of anti-EBOV CP. The standard identifiers are shown. d, Reproducibility of the neutralization assay determined by measuring the IC50 of CP on the three EBOV isolates (yellow-pEBOV14-GP, purple- pEBOV95-GP and green- pEBOV14m-GP). The two-tailed parametric paired t-test was used. e, Neutralization potential of CPs against three virus strains (pEBOV14-GP/n = 83, pEBOV95-GP/n = 69 and pEBOV14m-GP/n = 77) expressed in IC70 (data are presented as mean values ± s.d. Kruskal–Wallis test was performed). f, delta-IC70 neutralization titres between virus strain pairs by each post-cure study participant. g, Positive association between PPV IC70 titres the live virus plaque reduction neutralization test (PRNT). h, Positive association between PPV IC70 neutralization titres and the double antigen bridging assay (DABA). Source data
Extended Data Fig. 2
Extended Data Fig. 2. Pseudo-particle virus neutralization profiles by convalescent plasma.
ac, Anti-EBOV14-GP (an = 92), anti-EBOV14m-GP (bn = 70) and anti-EBOV95-GP (cn = 76) neutralization curves using serial dilutions of CP inhibiting PPV cell entry, as described in methods. The plasma samples were deciphered as possessing low (blue), intermediate (magenta) or high (orange) neutralization to demonstrate the similar profiles of the three virus glycoproteins studied. The red square curve indicates the range of inhibition by control plasma. d, Comparison of the analyses (n = 30) (i) considering the 0% inhibition value whenever two reciprocal consecutive high plasma dilutions produced equal infection levels, and (ii) considering 0% inhibition as the infection values of virus in the absence of convalescent plasma performed in each individual experiment. The Pearson correlation coefficients were computed. Source data
Extended Data Fig. 3
Extended Data Fig. 3. Association of IC50 and IC70 neutralizing dilutions of the post-cure plasma samples inhibiting cell entry of pseudotyped virus particles harbouring the variant EBOV GP molecules.
The Pearson correlation coefficients were computed. Source data
Extended Data Fig. 4
Extended Data Fig. 4. Longitudinal post convalescence nAb variation in the plasma of individuals 18, 19 and 21 demonstrated by pseudotyped virus particle neutralization.
Anti-EBOV14-GP (light blue) and anti-EBOV95-GP (dark blue) nAb titres were overlaid with the blocking EIAs carried out for the detection of antibody against the nucleoprotein [NP] (brown squares), the viral matrix protein 40 [VP40] (purple squares) and the glycoprotein [GP] (green squares). Source data
Extended Data Fig. 5
Extended Data Fig. 5. Longitudinal G-capture and competitive EIAs performed using plasma from individuals 18, 19, 21, 45 and 49 against the glycoprotein as previously described.
The longitudinal G-capture (pink) and competitive (green) EIAs were performed against the glycoprotein as previously described. The antibody reactivities were overlaid with pseudotyped virus particle IC50 neutralization values against EBOV14-GP (light blue) and EBOV95-GP (dark blue). Source data
Extended Data Fig. 6
Extended Data Fig. 6. Total antibody reactivity as measured by double antigen bridging assay (DABA) (average of a duplicate measurement) for the Ebola post-cure cohort participants with longitudinal follow up (≥2 data points, n = 51) demonstrating decline–restimulation–decline (in any order) of antibody reactivity over time.
Decline is indicated by a black line and restimulation by a yellow horizontal line. Source data
Extended Data Fig. 7
Extended Data Fig. 7. Total antibody reactivity as measured by double antigen bridging assay (DABA).
‘Lowest titre following decline’ is the last point in a participant presenting antibody titre decline, while ‘High titre upon stimulation’ is the subsequent point demonstrating antibody stimulation. Two-tailed parametric paired t-test (P = 0.0014). Source data
Extended Data Fig. 8
Extended Data Fig. 8. Observed versus predicted plots for the growth and decay models as determined by the DABA assay.
ab, Plots for selected logistic growth model for antibody stimulation. a, Population predicted values. b, Individual predicted values. c, d, Plots for selected two-compartment decay model with saturable recycling for antibody stimulation. c, Population predicted values. d, Individual predicted values. Solid red circles represent the individual observed or model-predicted Ab values. Solid blue line and dotted red line represent the line of regression and line of unity, respectively. Source data
Extended Data Fig. 9
Extended Data Fig. 9. Flow diagram describing the observed antibody decrease and increase events as measured by DABA.
These were used to develop the compartmental population pharmacodynamic models.

Comment in

References

    1. Kasangye, K. A. et al. in Advances in Ebola Control (ed. Okware, S. I.) (IntechOpen, 2017).
    1. Heeney JL. Ebola: hidden reservoirs. Nature. 2015;527:453–455. doi: 10.1038/527453a. - DOI - PubMed
    1. Sullivan NJ, Martin JE, Graham BS, Nabel GJ. Correlates of protective immunity for Ebola vaccines: implications for regulatory approval by the animal rule. Nat. Rev. Microbiol. 2009;7:393–400. doi: 10.1038/nrmicro2129. - DOI - PMC - PubMed
    1. Saphire EO, et al. Systematic analysis of monoclonal antibodies against Ebola virus GP defines features that contribute to protection. Cell. 2018;174:938–952.e13. doi: 10.1016/j.cell.2018.07.033. - DOI - PMC - PubMed
    1. Henao-Restrepo AM, et al. Efficacy and effectiveness of an rVSV-vectored vaccine expressing Ebola surface glycoprotein: interim results from the Guinea ring vaccination cluster-randomised trial. Lancet. 2015;386:857–866. doi: 10.1016/S0140-6736(15)61117-5. - DOI - PubMed

Publication types

MeSH terms