. 2021 Mar;591(7849):300-305.
doi: 10.1038/s41586-021-03231-w. Epub 2021 Jan 27.

AIM2 in regulatory T cells restrains autoimmune diseases

Affiliations

AIM2 in regulatory T cells restrains autoimmune diseases

Wei-Chun Chou et al. Nature. 2021 Mar.

Erratum in

  • Author Correction: AIM2 in regulatory T cells restrains autoimmune diseases.
    Chou WC, Guo Z, Guo H, Chen L, Zhang G, Liang K, Xie L, Tan X, Gibson SA, Rampanelli E, Wang Y, Montgomery SA, Brickey WJ, Deng M, Freeman L, Zhang S, Su MA, Chen X, Wan YY, Ting JP. Chou WC, et al. Nature. 2021 Apr;592(7856):E29. doi: 10.1038/s41586-021-03490-7. Nature. 2021. PMID: 33854241 No abstract available.

Abstract

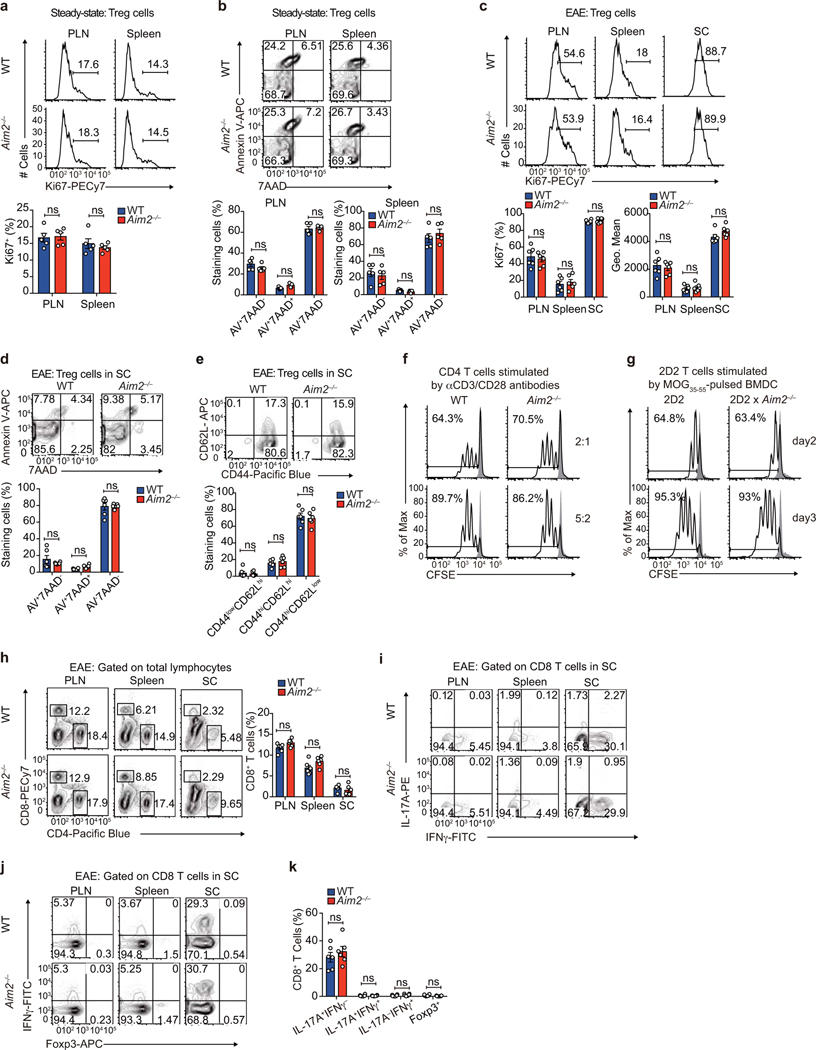
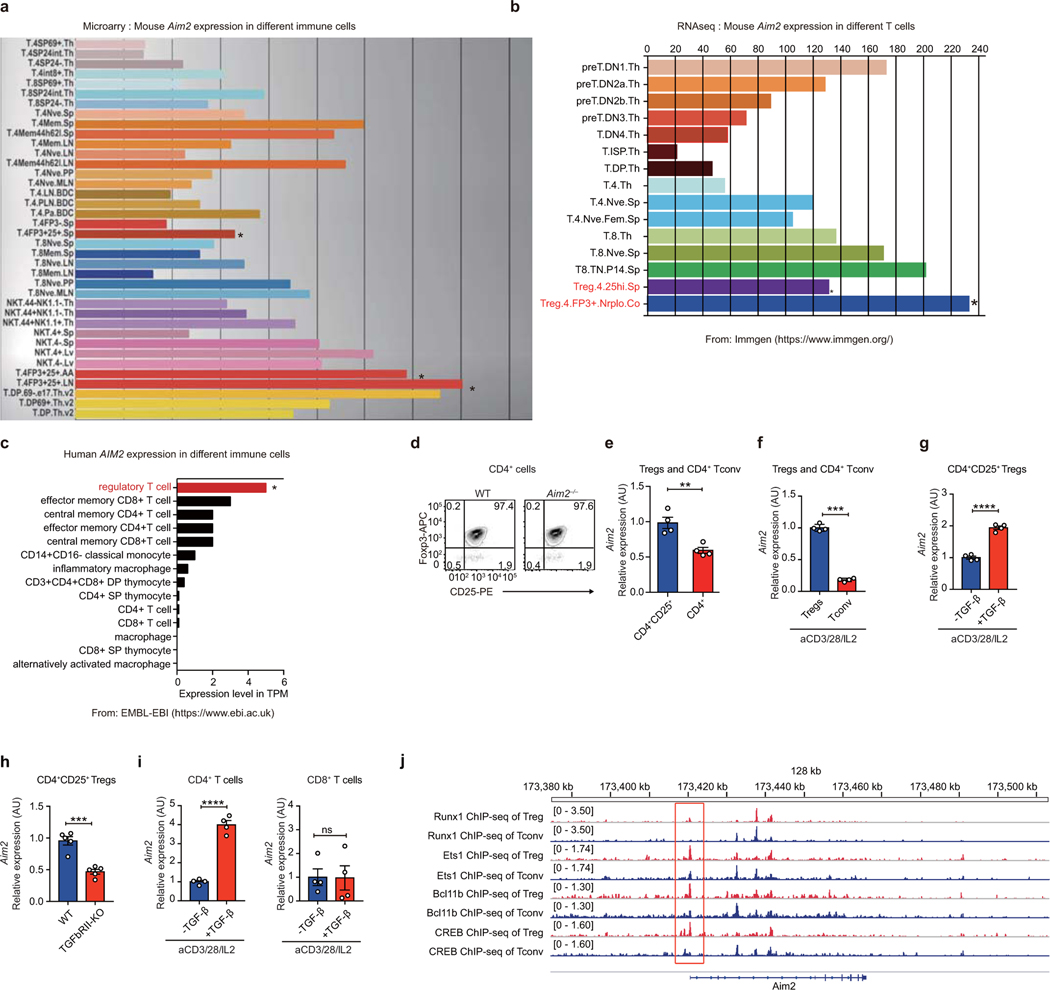
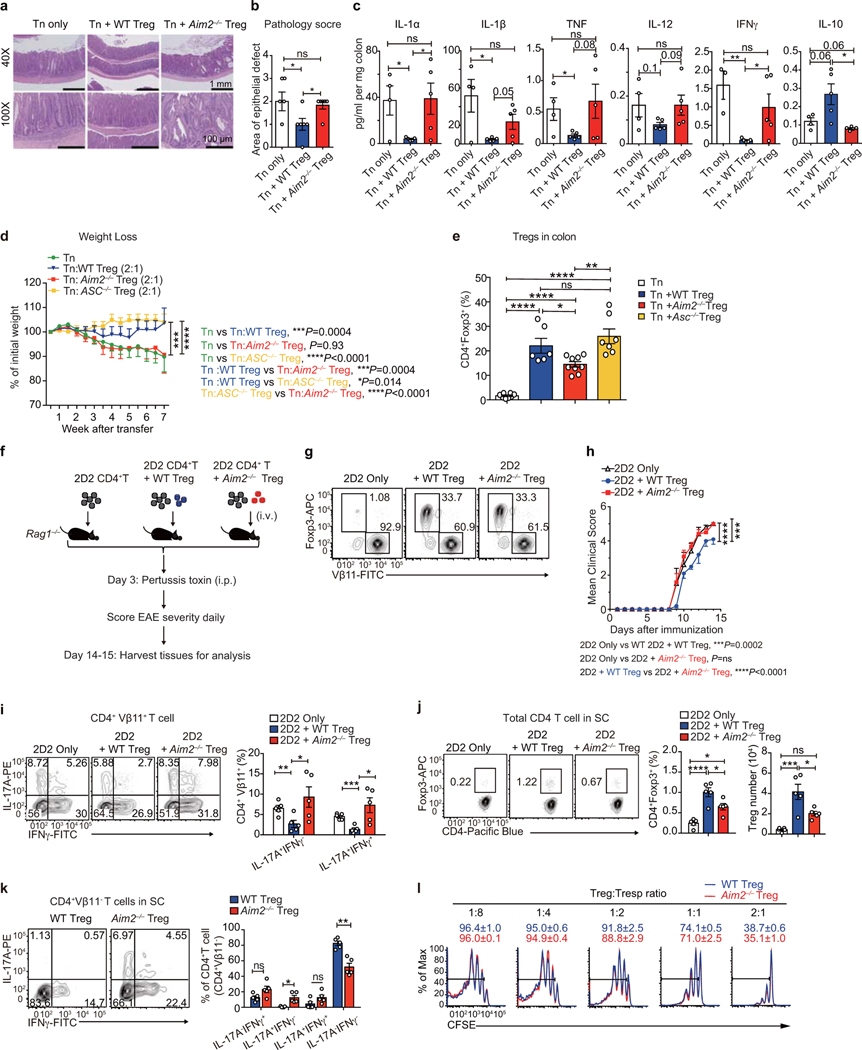
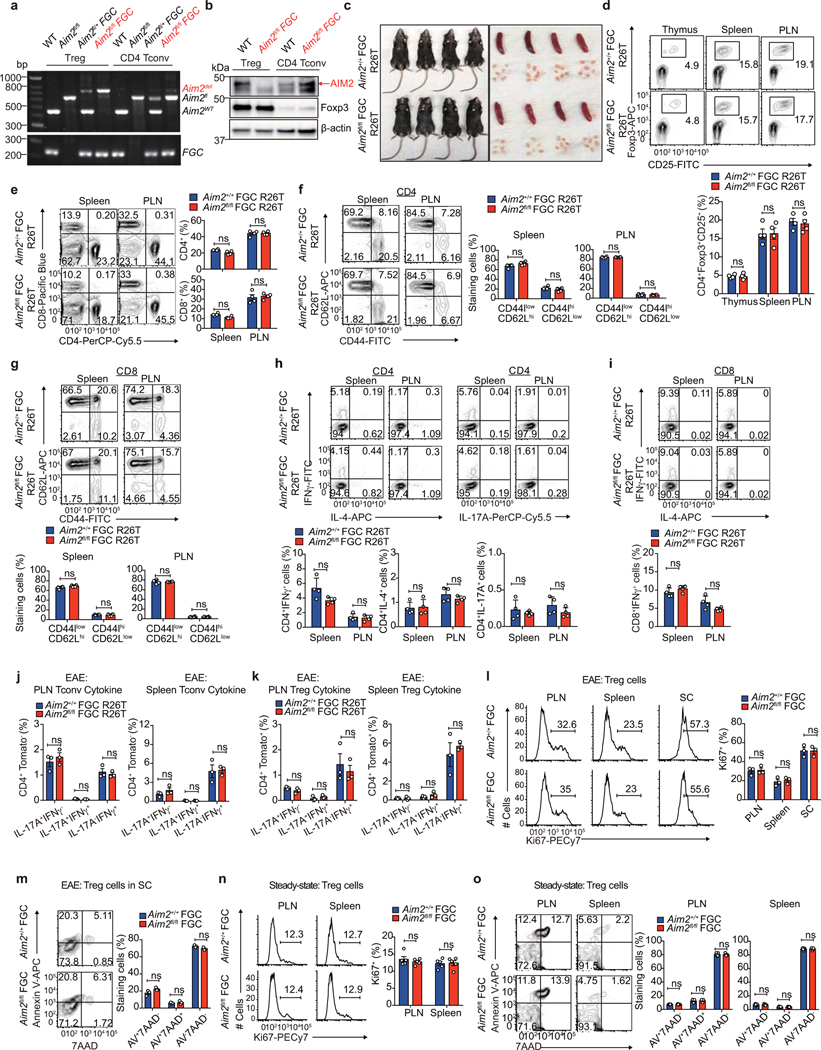
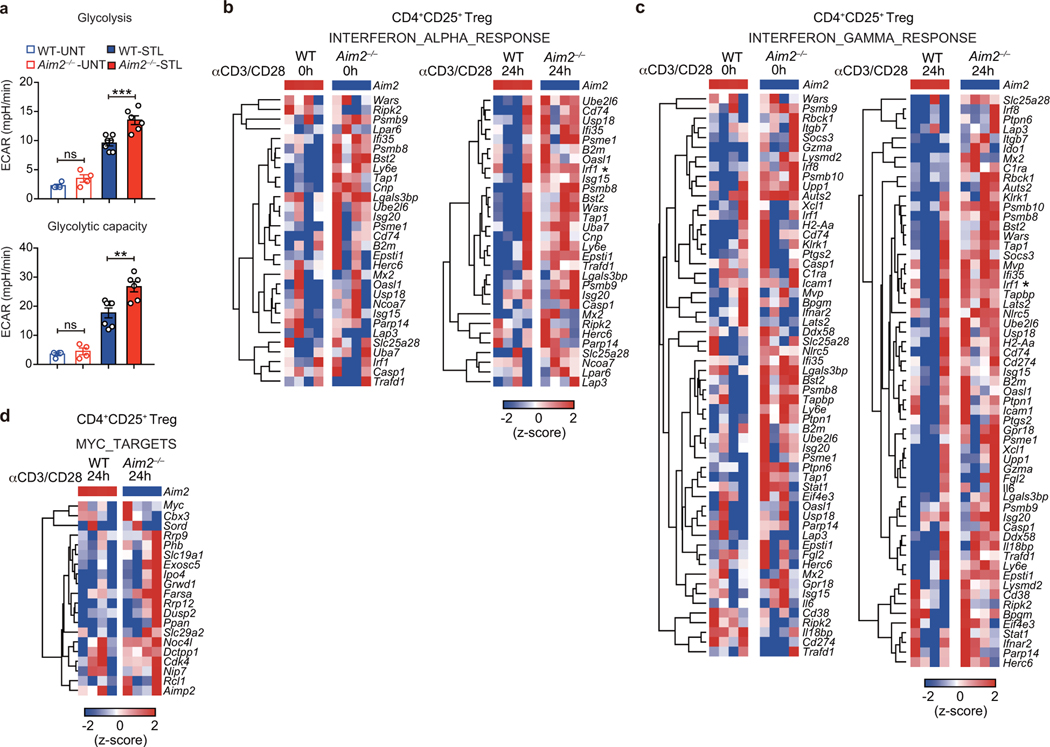
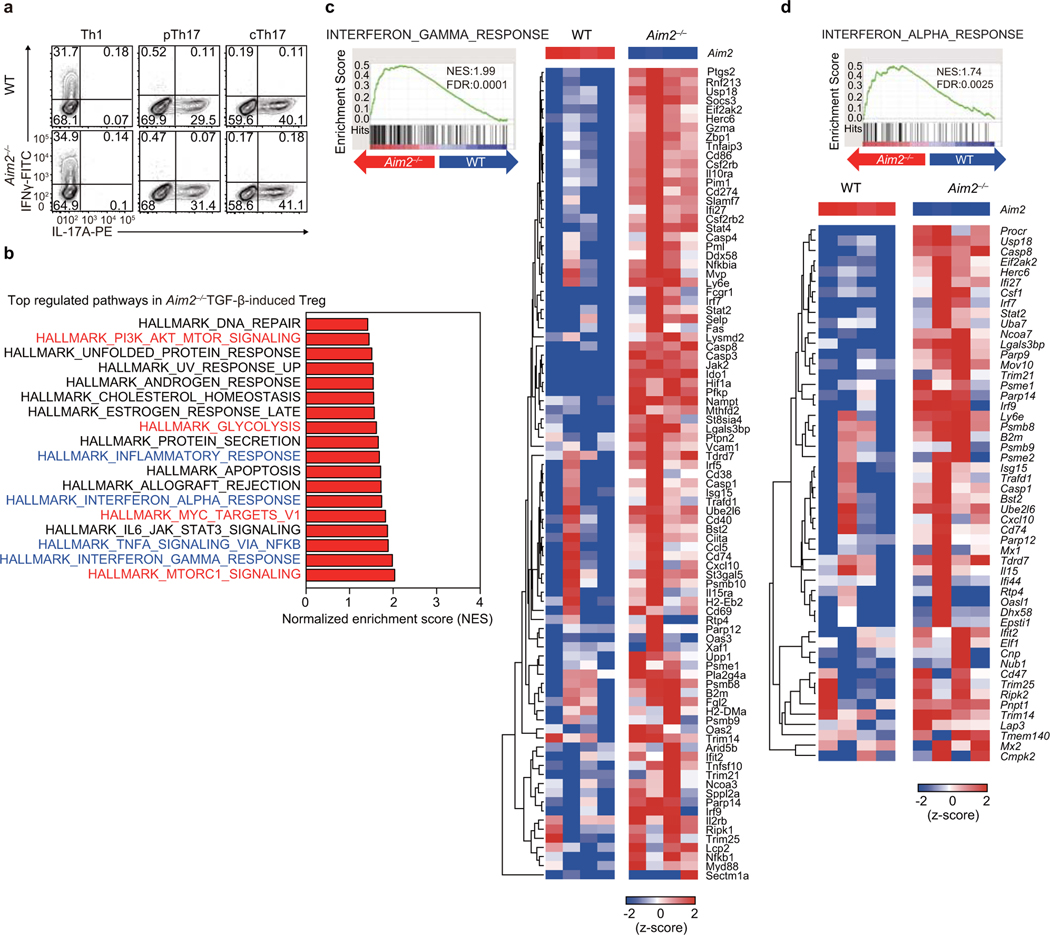
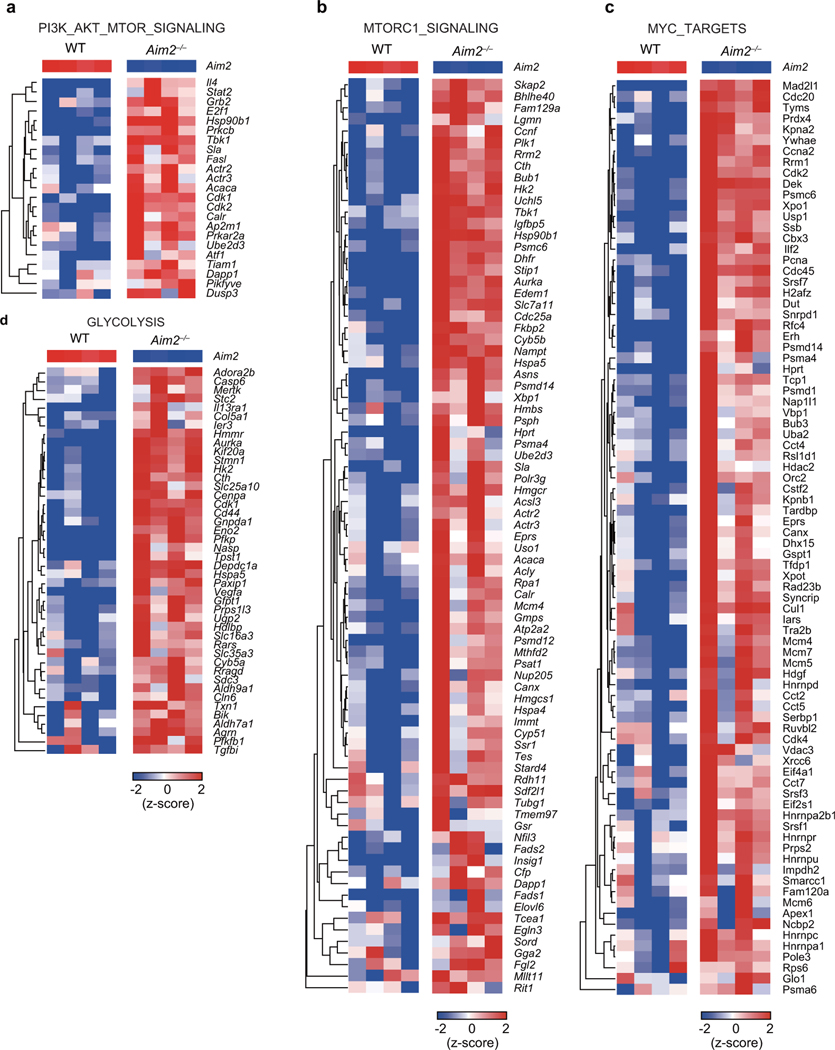
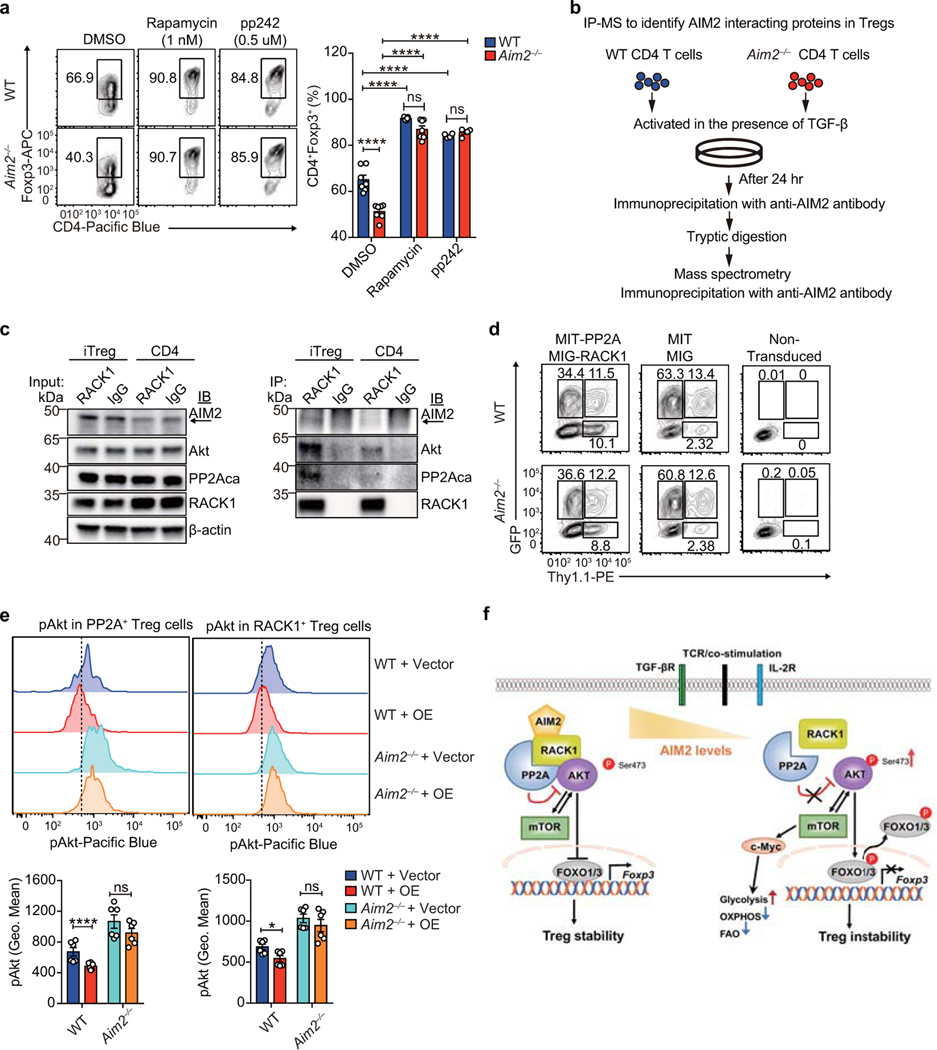
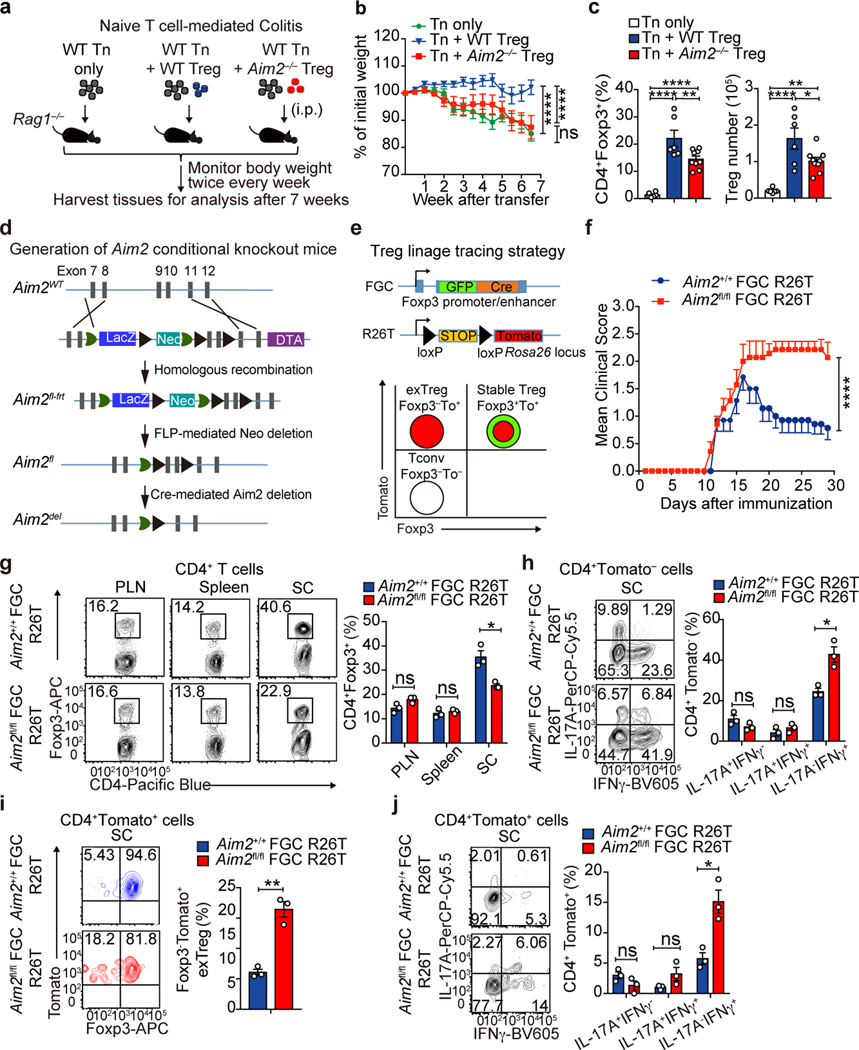
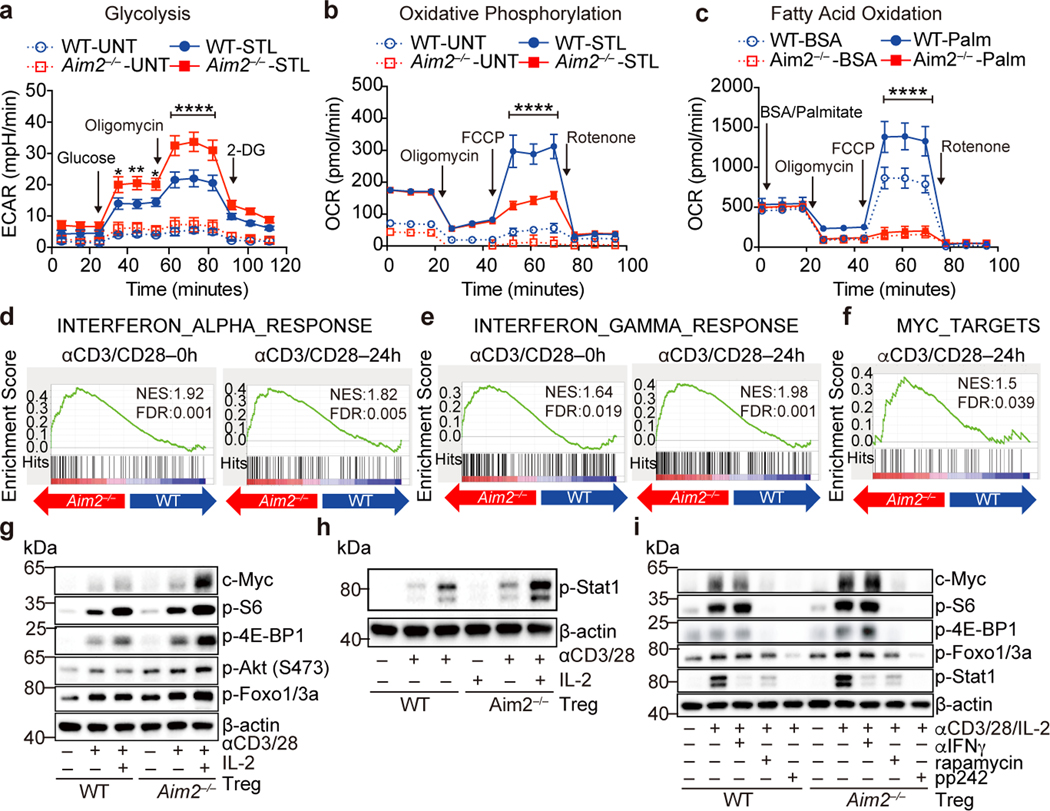
The inflammasome initiates innate defence and inflammatory responses by activating caspase-1 and pyroptotic cell death in myeloid cells1,2. It consists of an innate immune receptor/sensor, pro-caspase-1, and a common adaptor molecule, ASC. Consistent with their pro-inflammatory function, caspase-1, ASC and the inflammasome component NLRP3 exacerbate autoimmunity during experimental autoimmune encephalomyelitis by enhancing the secretion of IL-1β and IL-18 in myeloid cells3-6. Here we show that the DNA-binding inflammasome receptor AIM27-10 has a T cell-intrinsic and inflammasome-independent role in the function of T regulatory (Treg) cells. AIM2 is highly expressed by both human and mouse Treg cells, is induced by TGFβ, and its promoter is occupied by transcription factors that are associated with Treg cells such as RUNX1, ETS1, BCL11B and CREB. RNA sequencing, biochemical and metabolic analyses demonstrated that AIM2 attenuates AKT phosphorylation, mTOR and MYC signalling, and glycolysis, but promotes oxidative phosphorylation of lipids in Treg cells. Mechanistically, AIM2 interacts with the RACK1-PP2A phosphatase complex to restrain AKT phosphorylation. Lineage-tracing analysis demonstrates that AIM2 promotes the stability of Treg cells during inflammation. Although AIM2 is generally accepted as an inflammasome effector in myeloid cells, our results demonstrate a T cell-intrinsic role of AIM2 in restraining autoimmunity by reducing AKT-mTOR signalling and altering immune metabolism to enhance the stability of Treg cells.


Figures

Extended Data Figure 1.
Extended Data Figure 1.. Aim2–/– mice show normal T cell homeostasis.
a-b, Flow-cytometry of CD4+Foxp3+ Tregs (a) and IFNγ-, IL-17A-producing CD4+ T cells (b) in the spleen and peripheral lymph node (PLN) of WT and Aim2–/– mice at day 14 of an EAE course. Representative results (left) and statistical analysis (right) of six experiments are shown. c, Flow-cytometry of CD4+Foxp3+ Tregs in the thymus, spleen, and PLN of WT and Aim2–/– mice. Representative results (left) and statistical analysis (right) of three experiments are shown. d, Total number of cells isolated from the thymus, spleen, and peripheral lymph node of WT and Aim2–/– mice. Experimental design and statistical analysis performed as described in (c). e-f, Flow-cytometry of naïve, effector/memory CD4+ (e) and CD8+ T cells (f) in the spleen and PLN of WT and Aim2–/– mice (n=3/ group) analyzed by CD44 and CD62L expression. Experimental design and statistical analysis performed as described in (c). g-h, Flow-cytometry of IFNγ-, IL-4- or IL-17A-producing CD4+ cells (g) and IFNγ-producing CD8+ T cells (h) in WT and Aim2–/– mice (n=3/ group). Experimental design and statistical analysis performed as described in (c). Representative (upper) and composite (lower) data are shown. Data are means ± SEM; P values: ns, not significant, per two-sided t-test.
Extended Data Figure 2.
Extended Data Figure 2.. Aim2–/– mice show normal Treg proliferation, survival, and ratio of central/effector Tregs at steady state or during EAE in vivo, normal CD4 T cell proliferation in vitro, and normal CD8 T cells distribution and cytokine production during EAE.
a, Flow-cytometry of Ki67 to analyze proliferation of WT and Aim2–/– Tregs in the peripheral lymph node (PLN) and spleen at steady state. Representative results (upper) and statistical analysis (lower) of five experiments are shown. b, Apoptosis of WT and Aim2–/– Tregs in the PLN and spleen at steady state was analyzed by flow-cytometry using Annexin V and 7AAD staining. Representative results (upper) and statistical analysis (lower) of five experiments are shown. c, Flow-cytometry of Ki67 to analyze proliferation of WT and Aim2–/– Tregs in the PLN, spleen, and spinal cord (SC) during EAE. Representative results (upper) and statistical analysis (lower) of six experiments are shown. d, Apoptosis of WT and Aim2–/– Tregs in SC during EAE was analyzed by flow-cytometry using Annexin-V and 7AAD staining. Representative results (upper) and statistical analysis (lower) of six experiments are shown. e, Flow-cytometry of CD44 and CD62L in WT and Aim2–/– Tregs isolated from SC during EAE. Representative results (upper) and statistical analysis (lower) of six experiments are shown. f, Flow-cytometry of WT and Aim2–/– CD4+ T cell proliferation stimulated with different doses of anti-CD3/CD28, determined by CFSE dilution assay. Representative results of two independent experiments. g, Flow-cytometry of 2D2 and Aim2-deficient 2D2 (2D2 × Aim2–/–) CD4+ T cell proliferation stimulated with MOG35–55 peptide pulsed bone marrow-derived dendritic cells (BMDC) as determined by CFSE dilution assay. Representative of two independent experiments. h, Flow-cytometry of WT and Aim2–/– CD4+ or CD8+ T cells in the peripheral lymph node (PLN), spleen and spinal cord (SC) during EAE. Representative results (left) and statistical analysis (right) of six experiments are shown. i-k, Flow-cytometry of IFNγ-, IL-17A-producing (i) or Foxp3+, IFNγ-producing CD8+ T cells (j) in the PLN, spleen, and SC during EAE. Representative results (i, j) and statistical analysis (k) of six experiments are shown. Data are means ± SEM; P values: ns, not significant, by two-sided t-test.
Extended Data Figure 3.
Extended Data Figure 3.. Aim2 is highly expressed in Tregs and its promoter is bound by Treg-related transcription factors.
a-b, Mouse Aim2 gene expression in different T cell subsets from publicly available gene microarray (a) and RNAseq (b) databases (https://www.immgen.org/). c, Human Aim2 gene expression in T cell and macrophage subsets from the Expression Atlas of EMBL-EBI (https://www.ebi.ac.uk/). d, Purity of isolated CD4+CD25+ Tregs from WT and Aim2–/– mice. Flow-cytometry of CD4+CD25+Foxp3+ Tregs shows that more than 97% of isolated Tregs are Foxp3+ cells. e, Aim2 expression was assessed from isolated CD4+CD25+ Tregs and CD4+ T cells. Cells were freshly isolated from pooled spleens and lymph nodes and purified by MACS beads. Aim2 mRNA expression was examined by real-time PCR; n=4 experiments. f, The mRNA expression of Aim2 in Tregs and CD4+ T cells stimulated with anti-CD3/CD28 plus IL-2 (500 U/ml) for 24 hr; n=4 experiments. g, The mRNA expression of Aim2 in Tregs stimulated with anti-CD3/CD28 plus IL-2 (500 U/ml) in the absence (−) or presence (+) of TGF-β (1 ng/ml) for 24 hr; n=4 experiments. h, Aim2 expression was assessed in freshly isolated CD4+CD25+ Tregs from WT and Tgfbr2fl/fl CD4Cre (TGFbRII-KO) mice. Aim2 mRNA expression was examined by real-time PCR; n=5 experiments. i, The mRNA expression of Aim2 in naïve CD4+ or CD8+ T cells stimulated with anti-CD3/CD28 plus IL-2 (40 U/ml) in the absence or presence of TGF-β (1 ng/ml) for 24 hr; n=4 experiments. j, ChIP-seq analysis of Runx1, Ets1, Bcl11b and CREB binding to the Aim2 promoter region in Tregs and CD4 Tconv cells (NCBI SRA database number: DRP003376). Data are means ± SEM; P values: ns, not significant, **P<0.01, ***P<0.001, ****P<0.0001.
Extended Data Figure 4.
Extended Data Figure 4.. AIM2 is essential for Tregs to suppress T cell-mediated colitis and EAE.
a, H&E staining of colons from T cell-induced colitis mice transferred with WT CD4+CD45RBhi T cells (Tn) alone (n=5) or in combination with WT (n=6) or Aim2–/– (n=6) CD4+CD25+ Tregs, harvested 7 weeks after T cell transfer. Scale bars represent 1 mm for 40X and 100 μm for 100X. b, Statistical analysis of pathology score of colitis mice with biological replicates of each group is depicted in (a). Tn only: n=5; Tn+WT Treg: n=6; Tn+Aim2–/– Treg: n=6. c, Cytokine levels in the supernatants of colon tissue cultures from mice depicted in (a) measured by Millipore luminex assay, harvested 7 weeks after T cell transfer. Tn only: n=4; Tn+WT Treg: n=5; Tn+Aim2–/– Treg: n=5. d, Change of body weight of Rag1–/– recipients receiving WT naïve CD4+CD45RBhi T cells (Tn) alone or in combination with WT, Aim2–/– or Asc–/– CD4+CD25+ Tregs. Rag1–/– recipients of Tn (n=8), Tn+WT Treg (n=6), Tn+Aim2–/– Treg (n=9), Tn+Asc–/– Treg (n=7); composite of two independent experiments. P value by two-way ANOVA. e, Flow-cytometry of CD4+Foxp3+ Tregs in the colons of Rag1–/– recipients of Tn (n=8), Tn+WT Treg (n=6), Tn+Aim2–/– Treg (n=9), Tn+Asc–/– Treg (n=7), harvested 7 weeks after T cell transfer. P value by one-way ANOVA with Tukey’s multiple comparisons test. f, Schema of EAE induction in Rag1–/– mice transferred with either 2D2 CD4+ T cells alone or in combination with WT or Aim2–/– CD4+CD25+ Tregs. Lymphocytes and tissues were harvested 14–15 days after initial T cell transfer for further analysis. g, Flow-cytometry shows the distributions of 2D2 CD4+ T cells (Vβ11+) or Tregs (Foxp3+) before transfer to Rag1–/– recipient mice. h, Mean EAE clinical score of mice depicted in (f); n=5 mice per group. P value by two-way ANOVA and Holm -Sidak post-hoc test. Data are representative of three independent experiments. The difference between 2D2 alone and 2D2 with Aim2–/– Treg is not significant. i, Flow-cytometry of IFNγ+ or IL-17A+ CD4+Vβ11+ T cells in spinal cords (SC) from groups depicted in (f). Left, representative sample; right, composite data pooled of five mice per group from three independent experiments. j, Flow-cytometry of CD4+Foxp3+ Tregs from SC derived from mice depicted in (f).Left, representative sample; right, composite data pooled of five mice per group from three independent experiments. P value by one-way ANOVA with Tukey’s multiple comparisons test. k, Flow-cytometry of IFNγ+ or IL-17A+ CD4+Vβ11 T cells in SC from groups depicted in (f). Left, representative sample; right, composite data summarized from five biological replicates. l, CD25CD44lowCD62Lhi naive CD4+ T cells (Tresp) were isolated from WT mice and labelled with CFSE. CD4+CD25+ Tregs were isolated from WT or Aim2–/– mice by FACS. Tresp and Tregs of different genotypes were mixed at indicated ratios and stimulated with anti-CD3 in the presence of irradiated antigen-presenting cells from mixed spleens and lymph nodes. The suppressive activity of Tregs was assessed by CFSE dilution of responder T cells (Tresp). Data are means ± SEM, P values: ns, not significant, *P<0.05, **P<0.01, ***P<0.001, ****P<0.0001, analyzed by two-sided t test unless specified.
Extended Data Figure 5.
Extended Data Figure 5.. Aim2fl/fl FGC R26T mice show normal T cell homeostasis, normal Treg proliferation and survival at steady state and during EAE
a, Genotyping of FACS-sorted Treg (CD4+CD25+GFP+) and CD4 Tconv (CD4+CD25) cells showing efficient deletion of Aim2 genomic DNA in Tregs. The image is representative of three independent experiments. b, Immunoblot analysis of AIM2 protein in Tregs from Aim2+/+ FGC R26T and Aim2fl/fl FGC R26T mice. The image is representative of three independent experiments. c, Images of Aim2+/+ FGC R26T and Aim2fl/fl FGC R26T mice and corresponding lymphoid organs of spleen and lymph nodes. d, Flow-cytometry of CD4+Foxp3+CD25+Tregs in the thymus, spleen and peripheral lymph node (PLN) of Aim2+/+ FGC R26T and Aim2fl/fl FGC R26T mice Representative results (upper) and statistical analysis (lower) of four experiments are shown. e, Flow-cytometry of CD4+ or CD8+ T cells in the spleen and PLN of Aim2+/+ FGC R26T and Aim2fl/fl FGC R26T mice. Representative results (left) and statistical analysis (right) of four experiments are shown. f-g, Flow-cytometry of naïve, effector/memory CD4+ (f) and CD8+ T cells (g) in the spleen and PLN of Aim2+/+ FGC R26T and Aim2fl/fl FGC R26T mice by assessing CD44 and CD62L expression. Representative results (left for f, upper for g) and statistical analysis (right for f, lower for g) of four experiments are shown. h-i, Flow-cytometry of IFNγ-, IL-4- or IL-17A-producing CD4+ cells (h) and IFNγ-producing CD8+ T cells (i) in Aim2+/+ FGC R26T and Aim2fl/fl FGC R26T mice. Representative results (upper) and statistical analysis (lower) of four experiments are shown. j, Statistical summary of IFNγ-, IL-17A-producing CD4+Tomato Tconv cells in the peripheral lymph node (PLN; left) and spleen (right) of Aim2+/+ FGC R26T and Aim2fl/fl FGC R26T mice at day 28 of an EAE course. Composite data summarized from three biological replicates. k, Statistical summary of IFNγ-, IL-17A-producing CD4+Tomato+ Tregs in the PLN (left) and spleen (right) of Aim2+/+ FGC R26T and Aim2fl/fl FGC R26T mice at day 28 of EAE course. Composite data summarized from three biological replicates. l, Flow-cytometry of Ki67 to analyze proliferation of Aim2+/+ FGC and Aim2fl/fl FGC Tregs in the PLN, spleen, and spinal cord (SC) during EAE. Left, representative sample; right, composite data summarized from three biological replicates. m, Apoptosis of Aim2+/+ FGC and Aim2fl/fl FGC Tregs in SC during EAE was analyzed by flow-cytometry using Annexin-V and 7AAD staining. Left, representative sample; right, composite data summarized from three biological replicates. n, Flow-cytometry of Ki67 to analyze proliferation of Aim2+/+ FGC and Aim2fl/fl FGC Tregs in the PLN and spleen at steady state. Left, representative sample; right, composite data of five mice of two independent experiments. o, Apoptosis of Aim2+/+ FGC and Aim2fl/fl FGC Tregs in the PLN and spleen at steady state was analyzed by flow-cytometry using Annexin-V and 7AAD staining. Left, representative sample; right, composite data of five mice of two independent experiments. Data are means ± SEM, P values: ns, not significant, analyzed by two-sided t test unless specified.
Extended Data Figure 6.
Extended Data Figure 6.. Enhanced glycolytic, interferon and Myc target signatures are found in Aim2–/–Tregs isolated in vivo.
a, Glycolytic activity of WT (n=7 biological replicates/group) and Aim2–/– (n=6 biological replicates/group) Tregs with or without stimulation by anti-CD3/CD28 plus IL-2 (500 U/ml) for 24 hr. Statistics of glycolysis (ECAR rate after glucose addition) and glycolytic capacity (maximal ECAR after subtracting the ECAR rate following 2-DG exposure) calculated from (Fig. 3a). Data are means ± SEM; P values: ns, not significant; **P<0.01, ***P<0.001, by two-sided t-test. b, Heatmap of IFNα response signature of RNA-seq data from Aim2–/– compared to WT Tregs stimulated with anti-CD3/CD28 plus IL-2 (500 U/ml) at indicated time points (0 or 24 hr). c, Heatmap of IFNγ response signature as described in (b). d, Heatmap of Myc target profiles as described in (b).
Extended Data Figure 7.
Extended Data Figure 7.. Enhanced gene signature found in TGF-β-induced Aim2–/– Tregs using RNA-seq analysis.
a, Flow-cytometry of IFNγ+ or IL-17A+ CD4+ cells from WT and Aim2–/– mice after four days of differentiation under Th1, pathogenic Th17 (pTh17) and classic Th17 (cTh17) conditions respectively, as described in Fig. 4c. Data are representative of four independent experiments. b, Summary of top pathways positively enriched in anti-CD3/CD28 activated Aim2–/– CD4+ T cells in the presence of TGF-β (2 ng/ml) and IL-2 (40 U/ml) for 24 hr, by GSEA analysis of the RNA-seq dataset. c-d, Enrichment of IFNγ (c) and IFNα response pathways (d) by GSEA (left) and heatmap (right) of pathway related genes in Aim2–/– vs. WT CD4 T cells stimulated with anti-CD3/CD28 in the presence of TGF-β (2 ng/ml) and IL-2 (40 U/ml) for 24 hr.
Extended Data Figure 8.
Extended Data Figure 8.. RNA-seq analysis reveals enhanced mTOR, Myc and glycolytic signatures in TGF-β-induced Aim2–/– Tregs.
a, Heatmap of PI3K-Akt-mTORC related gene expression in WT and Aim2–/– CD4+ T cells stimulated with anti-CD3/CD28 in the presence of TGF-β (2 ng/ml) and IL-2 (40 U/ml) for 24 hr. b, Heatmap of mTORC1 signaling related gene expression, with samples described in (a). c, Heatmap of Myc targets related gene expression, with samples described in (a). d, Heatmap of glycolysis related gene expression, with samples described in (a).
Extended Data Figure 9.
Extended Data Figure 9.. Akt-mTOR signaling in WT and Aim2–/– Treg, CD4+ and CD8+ T cells.
a-b, Immunoblot analysis of p-Akt (S473), p-Foxo1/3a, p-S6, p-4E-BP1, c-Myc and β-actin in WT and Aim2–/– CD4+ T cells (a) or CD8+ T cells (b) stimulated with anti-CD3/CD28 plus IL-2 (40 U/ml) for 24 hr. c-e, Immunoblot analysis of p-Akt (S473), p-Foxo1/3a, p-S6, p-4E-BP1, c-Myc and β-actin in WT and Aim2–/– Tregs (c) stimulated with anti-CD3/CD28 plus IL-2 (500 U/ml), or CD4+ (d) and CD8+ (e) T cells stimulated with anti-CD3/CD28 plus IL-2 (40 U/ml) for indicated time points. Left: representative results; right: quantification for statistics by densitometric analysis using Image Lab software; n= 4 experiments (a-c); n=3 experiments (d,e); P values: ns, not significant, *P<0.05, **P<0.01, analyzed by two-sided paired t-test.
Extended Data Figure 10.
Extended Data Figure 10.. AIM2 interacts with RACK1/PP2A/Akt complex and is critical to regulate Akt-mTOR signaling for Treg cell generation.
a, Flow-cytometry analysis of Foxp3 in WT and Aim2–/– CD4+ T cells stimulated by anti-CD3/CD28 plus IL-2 (40 U/ml) and TGF-β (2 ng/ml) and then cultured with DMSO (n=4 biological replicates/group), rapamycin (1 nM) (n=7 biological replicates/group), or pp242 (0.5 μM) (n=7 biological replicates/group) for 96 hr. Results are representative of three independent experiments. P value by one-way ANOVA with Tukey’s multiple comparisons test. b, Schema of immunoprecipitation–mass spectrometry (IP-MS) approach to identify AIM2 interacting proteins in TGF-β-induced Tregs. WT and Aim2–/– naïve CD4+ T cells were activated with anti-CD3/CD28 in the presence of TGF-β (2 ng/ml) and IL-2 (40 U/ml) for 24 hr and protein lysates from each group were collected for further IP-MS analysis. c, Interaction of AIM2 and RACK1 detected by immunoprecipitation using anti-RACK1 antibody or anti-IgG as control in TGF-β-induced Tregs and CD4+ T cells, and immunoblotted with different antibodies, including anti-PP2Aca, anti-Akt, anti-RACK1 and anti-AIM2. Arrow points to the AIM2 protein. Results are representative of three independent experiments. d, WT and Aim2–/– CD4 T cells were stimulated with anti-CD3 and CD28 plus IL-2 (40 U/ml) and TGF-β (2 ng/ml) for 24 hr and transduced either with MIT-PP2A and MIG-RACK1, or with MIT and MIG vector controls. The cells were harvested 3 days after virus transduction. The populations expressing PP2A (Thy1.1+), RACK1 (GFP+) and both (Thy1.1+GFP+) were identified by flow-cytometry. e, Flow-cytometry of p-Akt of WT and Aim2–/– Tregs that overexpressed PP2A (Thy1.1+) or RACK1 (GFP+) compared to corresponding vector controls. Representative FACS plots (upper) and statistical analysis (lower) of six experiments are shown. P value by multiple unpaired t-test with Holm-Sidak method. f, Model for AIM2 function shows AIM2 facilitates the interaction between RACK1 and PP2A-phosphatase causing de-phosphorylation of Akt to restrain the activity of mTOR pathway, therein promoting Foxp3 expression and Treg stability. Data are means ± SEM, P values: ns, not significant, *P<0.05, ****P<0.0001.
Figure 1.
Figure 1.. Aim2–/– and Asc–/– mice have opposing responses to EAE.
a, EAE scoring of WT (n=46), Aim2–/– (n=45), Asc–/– (n=10) and ICE–/– (n=4) mice, three experiments. P value by two-way ANOVA and Holm-Sidak post-hoc test. b, Luxol fast blue and periodic acid-Schiff (LFB-PAS) staining of spinal cords. Scale bars indicated on the panels. WT (n=3), Aim2–/– (n=8) and Asc–/– (n=4) mice, day 22 of EAE. Representative of 3–8 mice/group, three experiments. c, Quantification of demyelination and inflammatory foci. WT (n=3), Aim2–/– (n=8) and Asc–/– (n=4) mice from (b). d. Infiltrating cells in spinal cords of WT and Aim2–/– mice, day 22 of EAE, n=6/group, two experiments. e, Spinal cord IL-1β, IL-18, IL-6, and TNFα analyzed by ELISA; WT (n=13) and Aim2–/– (n=16) for IL-1β (3 experiments), n=5 for other cytokines (2 experiments). f-g, Flow-cytometry of CD4+Foxp3+ Tregs (f), IFNγ+ or IL-17A+ CD4+ cells (g) in spinal cords of WT and Aim2–/– mice, days 14–15 during EAE, n=6/group, three experiments. h, RT-PCR of genes, n=3, 5 and 6 for WT, n=4, 6 and 8 for Aim2−/− samples, two experiments. i, IL-10 protein analyzed by ELISA; n=10 for WT and 11 for Aim2−/− samples, three experiments. j, Flow-cytometry of CD25+Foxp3+, Foxp3+IL-10+ and IL-17A+ CD4+ cells in WT and Aim2–/– spinal cords at days 22–23 of EAE, n=4 for WT, n=5 for Aim2−/− samples of CD25+Foxp3+ and IL-17A+ (2 experiments), n=13/group for Foxp3+IL-10+ (3 experiments). k, EAE scores of Rag1–/– mice that received WT (n=21) or Aim2–/– CD4+ T cells (n=19), three experiments. P value by two-way ANOVA and Holm -Sidak post-hoc test. l, Flow-cytometry of spinal cord CD4+Foxp3+ Tregs from (k), n=6/group, three experiments. Data are means ± SEM, P values: ns, not significant, *P<0.05, **P<0.01, ***P<0.001, ****P<0.0001, analyzed by two-sided t test unless specified.
Figure 2.
Figure 2.. AIM2 stabilizes Tregs to restrain autoimmunity.
a, Schematic of WT CD4+CD45RBhi T cells (Tn)-induced colitis, with or without Tregs. b, Body weight of Rag1–/– mice received Tn (n=8), Tn+WT Treg (n=8), Tn+Aim2–/– Treg (n=9); two experiments, P value by two-way ANOVA and Holm -Sidak post-hoc test. c, Flow-cytometry of CD4+Foxp3+ Tregs in colons of Rag1–/– mice that received Tn (n=6), Tn+WT Treg (n=6), Tn+Aim2–/– Treg (n=9), 7 weeks after transfer, two experiments. P value by one-way ANOVA with Tukey’s multiple comparisons test. d, Schema for gene targeting to generate floxed Aim2 mice. e, Schema for generating Foxp3 Treg lineage tracing mice (upper). Tconv, stable Treg, and exTreg based on Foxp3 and Tomato expression (lower). f, EAE scores of mice of indicated genotypes (n=7/group). Two experiments, P value by two-way ANOVA and Holm-Sidak post-hoc test. g, Flow-cytometry of Foxp3 expression in CD4+ cells in PLN, spleen, and spinal cord (SC) of mice of indicated genotypes at day 28 of EAE, n=3 experiments. P value by multiple t test corrected by the Holm-Sadik method. h, Flow-cytometry of IFNγ and IL-17A production in CD4+Tomato T cells in spinal cords of mice of indicated genotypes at day 28 of EAE, n=3 experiments. P value by Multiple t test corrected by Holm-Sadik method. i, Flow-cytometry of Foxp3 production in CD4+Tomato+ T cells in spinal cords of mice of indicated genotypes at day 28 of EAE, n=3 experiments. P value by unpaired t test. j, Flow-cytometry of IFNγ and IL-17A production in CD4+Tomato+ T cells in spinal cords of mice of indicated genotypes at day 28 of EAE, n=3 experiments. P value by Multiple t test corrected by Holm-Sadik method. Data are means ± SEM, P values: ns, not significant, *P<0.05, **P<0.01, ****P<0.0001.
Figure 3.
Figure 3.. AIM2 regulates immune metabolism, Akt-mTOR and IFN signaling in Tregs isolated in vivo.
a, Glycolytic activity of WT (n=7 experiments) and Aim2–/– (n=6 experiments) CD4+CD25+ Tregs with or without anti-CD3/CD28 plus IL-2 (500 U/ml), 24 hr. P value by two-way ANOVA. b, Oxidative consumption rate (OCR) of WT (n=3 experiments) and Aim2–/– (n=4 experiments) CD4+CD25+ Tregs with or without anti-CD3/CD28 plus IL-2 (500 U/ml) for 24 hr. P value by two-way ANOVA. c, Fatty acid oxidation (FAO) of WT (n=5 experiments) and Aim2–/– (n=6 experiments) CD4+CD25+ Tregs with or without anti-CD3/CD28 plus IL-2 (500 U/ml) for 24 hr. Cells were starved in substrate-limited medium and given only BSA or palmitate-BSA in FAO assay media and OCR was measured to indicate oxidation of fatty acids according to the Agilent FAO guideline. P value by two-way ANOVA. d-f, Enrichment of IFNα response signatures (d), IFNγ response signatures (e), and Myc-related targets (f) by Gene Set Enrichment Analysis (GSEA) of RNA-seq datasets from Aim2–/– and WT Tregs stimulated with anti-CD3/CD28 antibodies plus IL-2 (500 U/ml). g, Immunoblot analysis of indicated proteins in WT and Aim2–/– CD4+CD25+ Tregs with or without anti-CD3/CD28 plus IL-2 (500 U/ml) for 24 hr. Data are representative of three experiments. h, Immunoblot analysis of p-Stat1and β-actin in WT and Aim2–/– CD4+CD25+ Tregs treated as described in (g). Data are representative of three experiments. i, Immunoblot analysis of indicated proteins in WT and Aim2–/– CD4+CD25+ Tregs stimulated with anti-CD3/CD28 plus IL-2 (500 U/ml) in the presence of rapamycin (1 nM), pp242 (0.5 μM) or anti-IFNγ antibody (XMG1.2, 10 μg/ml) for 24 hr. Data are representative of three experiments. Data are means ± SEM, P values: *P<0.05, **P<0.01, ****P<0.0001.
Figure 4.
Figure 4.. AIM2 promotes Treg in vitro and restrains Akt-mTOR via the RACK1/PP2A complex.
a, b, RT-PCR (a) and flow-cytometry (b) of Foxp3 in WT and Aim2–/– CD4+ T cells activated with the indicated amounts (a) or 2 ng/ml (b) of TGF-β for 4 days; n=5 experiments in a and n=4 experiments in b. c, Flow-cytometry of IFNγ+ or IL-17A+ CD4+ T cells of indicated genotypes, 4 days after differentiated under indicated polarizing conditions; n=4 experiments. d-g, WT and Aim2–/– CD4+ T cells were stimulated as in (b). Enrichment scores of indicated gene sets, based on RNA-seq datasets (d). ECAR (e) and OCR (f) levels during glycolysis, and OCR levels during FAO (g), by Seahorse analysis; n=10 experiments for e; n=5 experiments for f, and n=3 experiments for g; P values by two-way ANOVA (e left panel, f, g) or two-sided t-test (e right panel). h, immunoblotting of indicated proteins in WT and Aim2–/– CD4+ T cells stimulated as in (b) with indicated treatment for 24 hr. Representative of three experiments. i, Volcano plot of AIM2 interacting proteins by IP-MS analysis. Red indicates significantly enriched proteins (log2FC > 1; t-test adjusted P<0.05). j-k, The interactions of indicated proteins determined by immunoprecipitation using anti-AIM2 (j) or anti-Rack1 (k), in WT and Aim2–/– CD4+ T cells activated with TGF-β for 24 hr. Representative of three experiments. l, Flow-cytometry of p-Akt levels (Geo. Mean) in WT and Aim2–/– Tregs transduced with PP2A+RACK1 expressing vector (OE) or vector; n=6 experiments, P value by multiple unpaired t-test with Holm-Sidak method. m, Flow-cytometry of p-Akt in spinal cord Tregs from mice of indicated genotypes, 28 days after EAE induction, n=3 experiments. Data are means ± SEM, P values: ns, not significant, *P<0.05, **P<0.01, ***P<0.001 ****P<0.0001, analyzed by two-sided t test unless specified.

References

    1. Guo H, Callaway JB & Ting JP Inflammasomes: mechanism of action, role in disease, and therapeutics. Nature medicine 21, 677–687, doi:10.1038/nm.3893 (2015). - DOI - PMC - PubMed
    1. Broz P. & Dixit VM Inflammasomes: mechanism of assembly, regulation and signalling. Nat Rev Immunol 16, 407–420, doi:10.1038/nri.2016.58 (2016). - DOI - PubMed
    1. Gris D. et al. NLRP3 plays a critical role in the development of experimental autoimmune encephalomyelitis by mediating Th1 and Th17 responses. J Immunol 185, 974–981, doi:10.4049/jimmunol.0904145 (2010). - DOI - PMC - PubMed
    1. Lalor SJ et al. Caspase-1-processed cytokines IL-1beta and IL-18 promote IL-17 production by gammadelta and CD4 T cells that mediate autoimmunity. J Immunol 186, 5738–5748, doi:10.4049/jimmunol.1003597 (2011). - DOI - PubMed
    1. Shaw PJ et al. Cutting edge: critical role for PYCARD/ASC in the development of experimental autoimmune encephalomyelitis. J Immunol 184, 4610–4614, doi:10.4049/jimmunol.1000217 (2010). - DOI - PMC - PubMed

Extended References:

    1. Zhou X. et al. Selective miRNA disruption in T reg cells leads to uncontrolled autoimmunity. J Exp Med 205, 1983–1991, doi:10.1084/jem.20080707 (2008). - DOI - PMC - PubMed
    1. Madisen L. et al. A robust and high-throughput Cre reporting and characterization system for the whole mouse brain. Nature neuroscience 13, 133–140, doi:10.1038/nn.2467 (2010). - DOI - PMC - PubMed
    1. Miller SD & Karpus WJ Experimental autoimmune encephalomyelitis in the mouse. Current protocols in immunology Chapter 15, Unit 15 11, doi:10.1002/0471142735.im1501s77 (2007). - DOI - PMC - PubMed
    1. Matsushita T, Yanaba K, Bouaziz JD, Fujimoto M. & Tedder TF Regulatory B cells inhibit EAE initiation in mice while other B cells promote disease progression. J Clin Invest 118, 3420–3430, doi:10.1172/JCI36030 (2008). - DOI - PMC - PubMed
    1. Erben U. et al. A guide to histomorphological evaluation of intestinal inflammation in mouse models. International journal of clinical and experimental pathology 7, 4557–4576 (2014). - PMC - PubMed

Publication types

MeSH terms