. 2021 Mar;591(7848):147-151.
doi: 10.1038/s41586-021-03211-0. Epub 2021 Jan 27.

Systematic analysis of binding of transcription factors to noncoding variants

Affiliations

Systematic analysis of binding of transcription factors to noncoding variants

Jian Yan et al. Nature. 2021 Mar.

Abstract

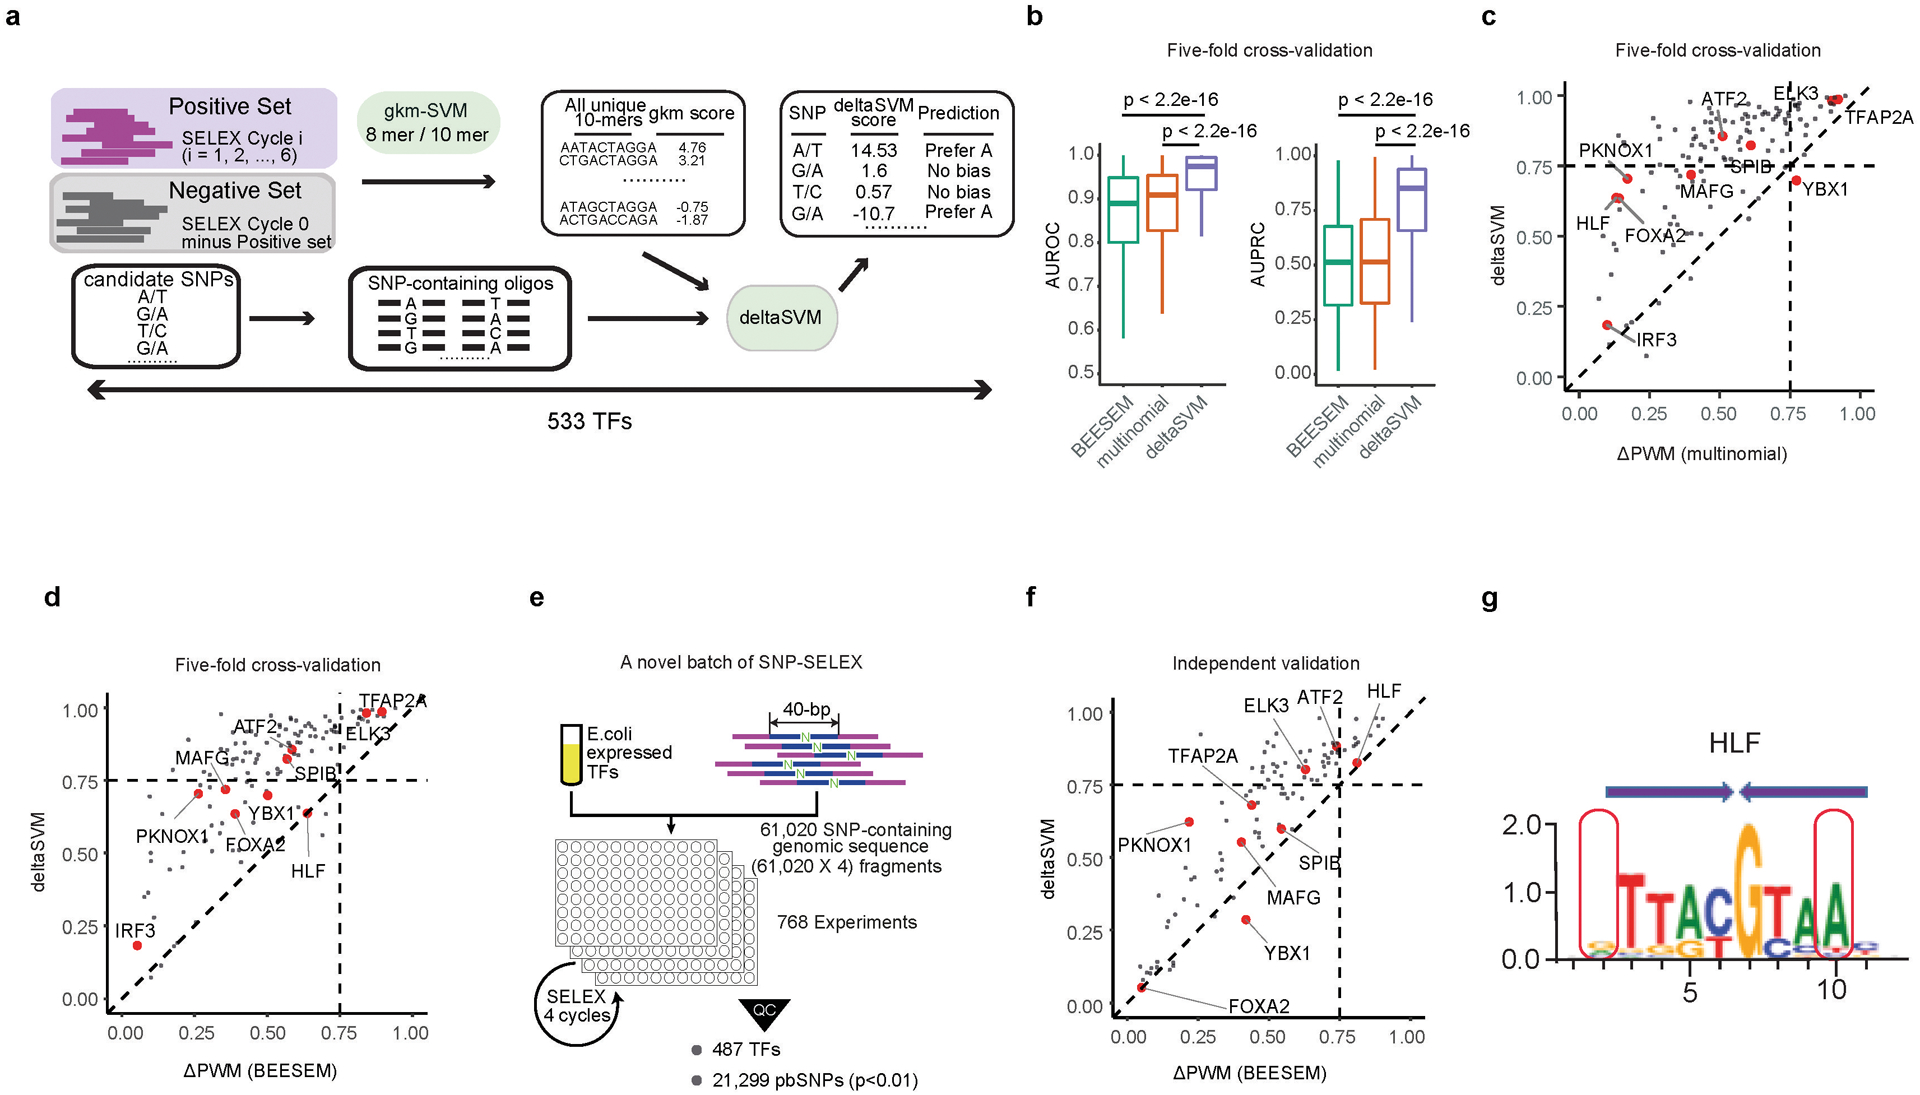
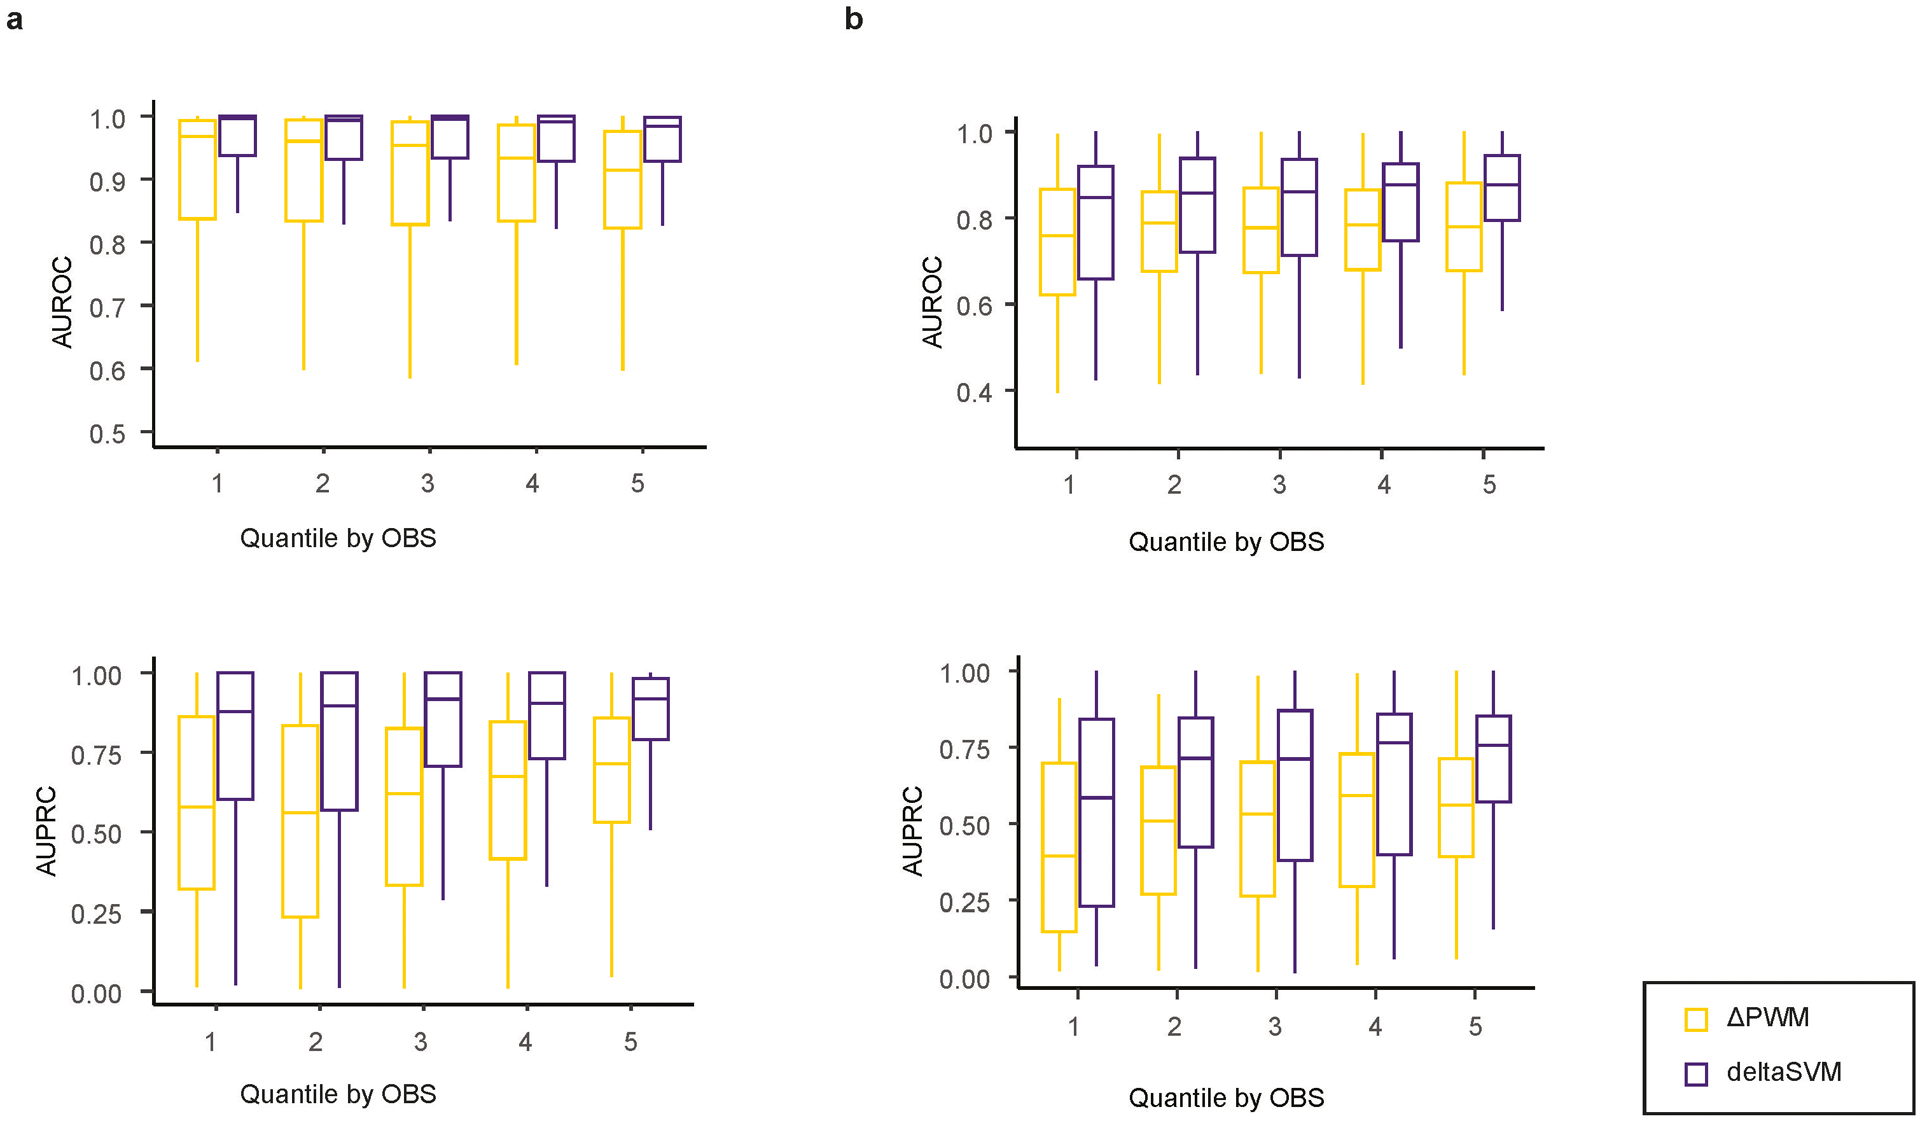
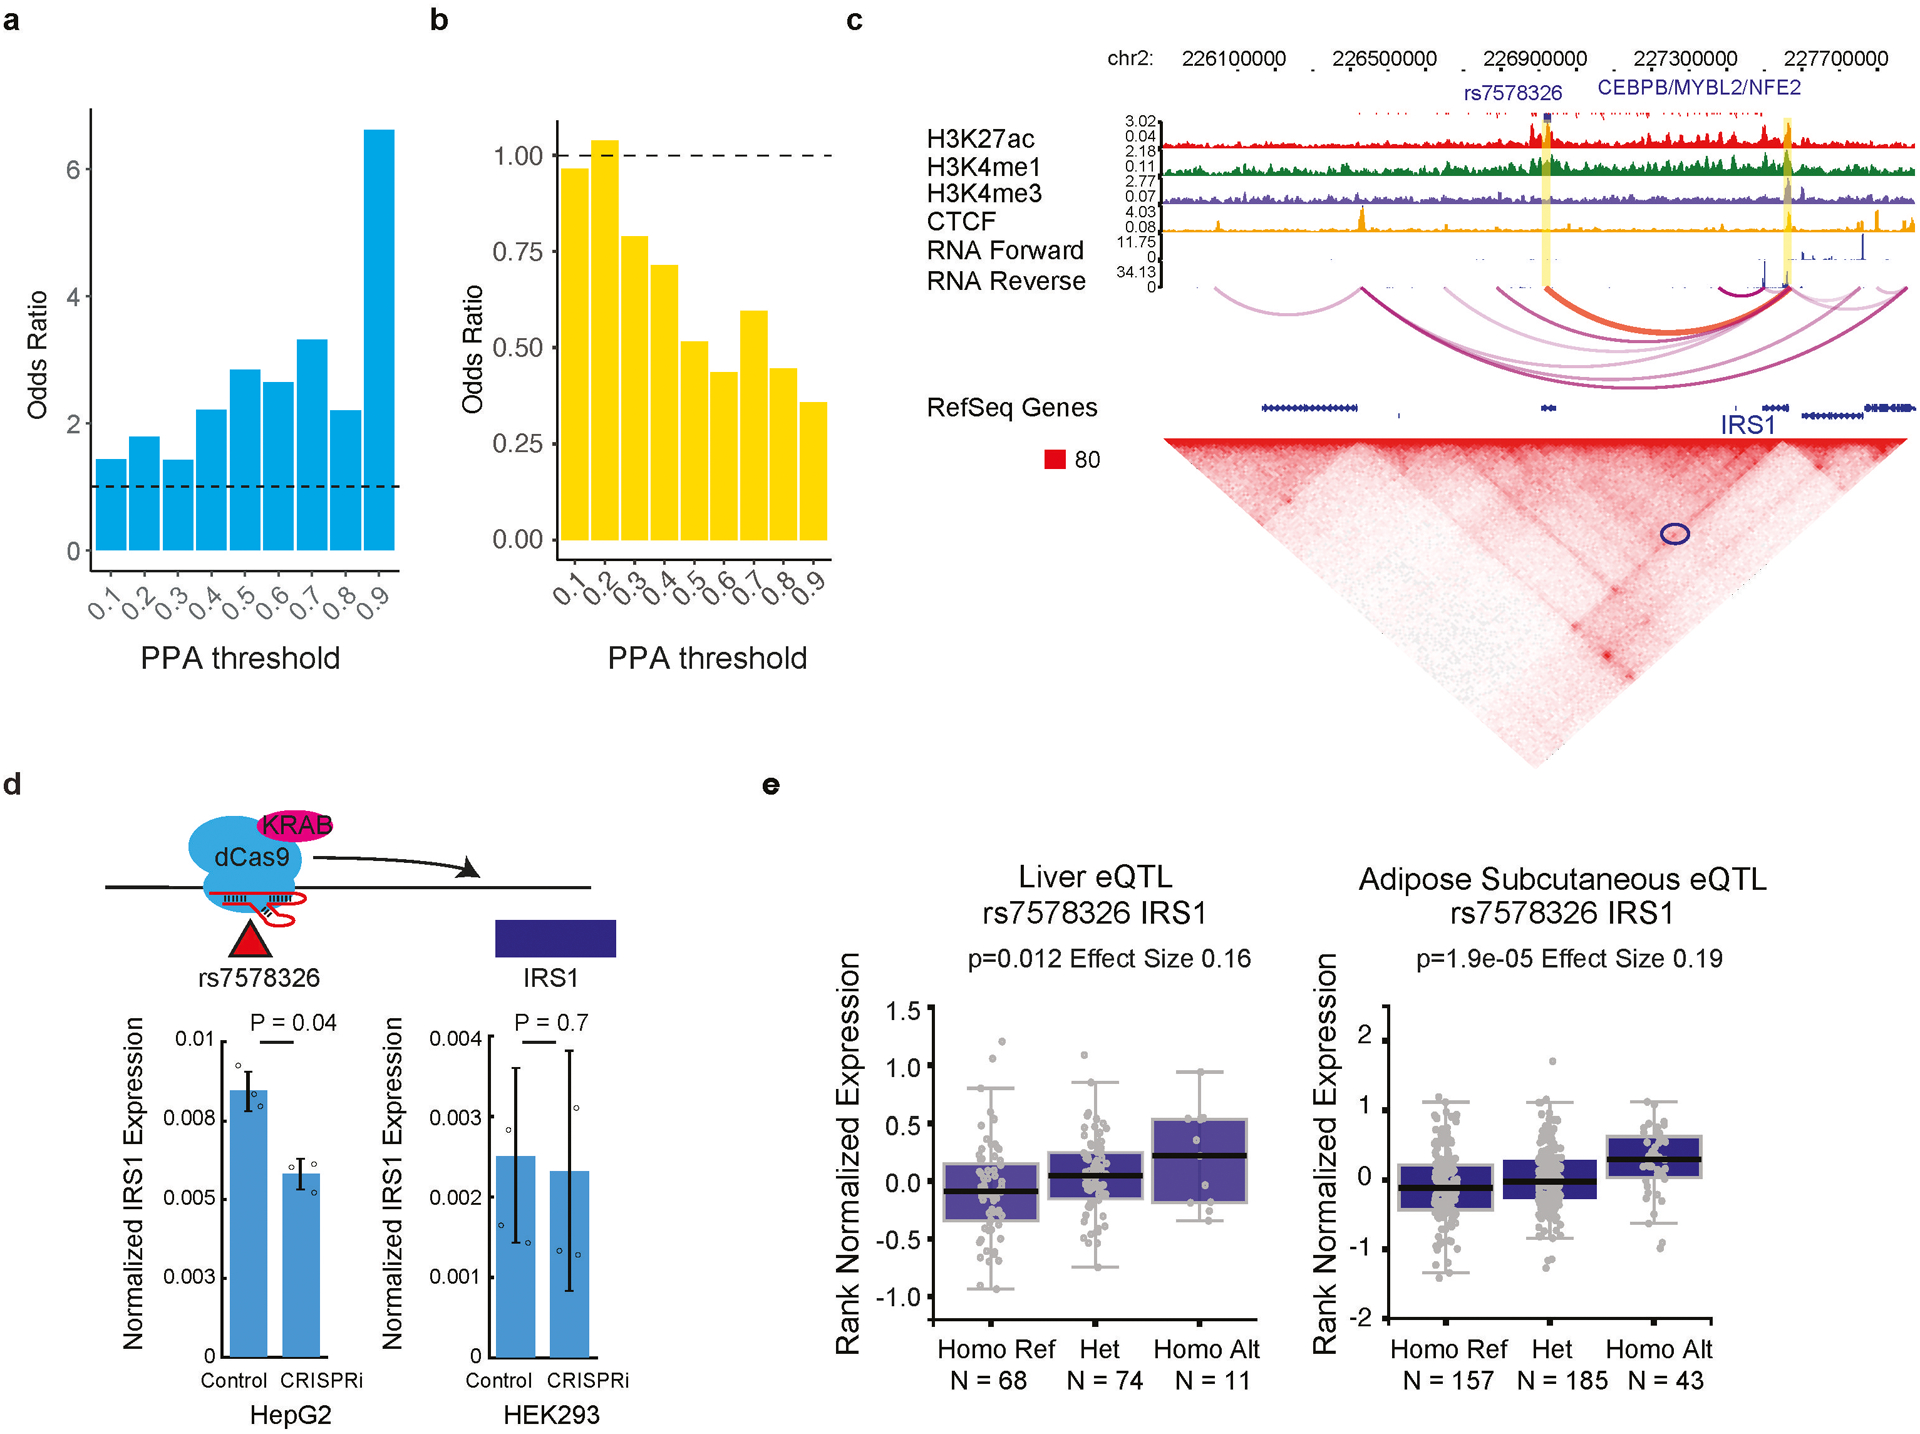
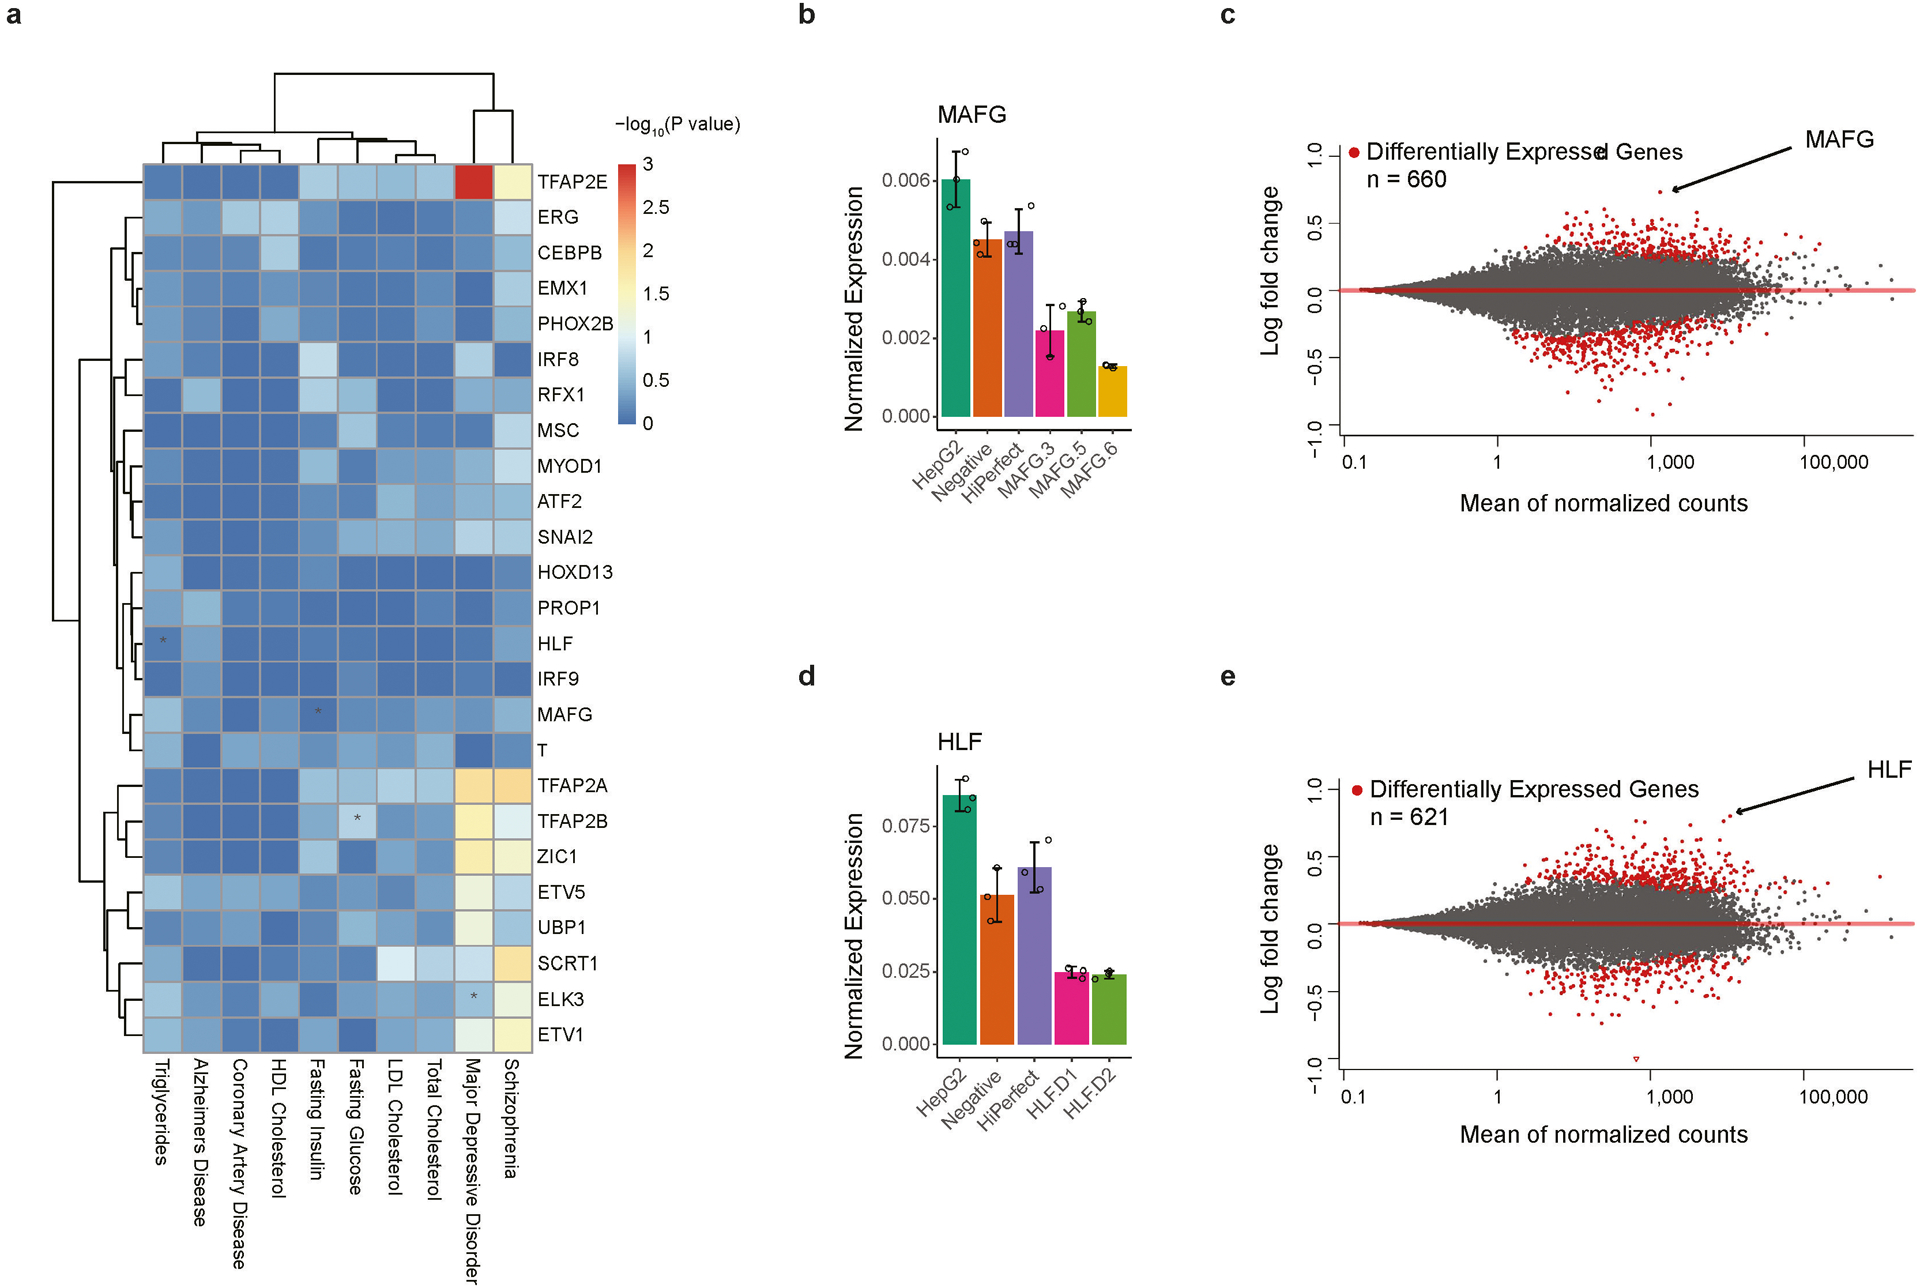
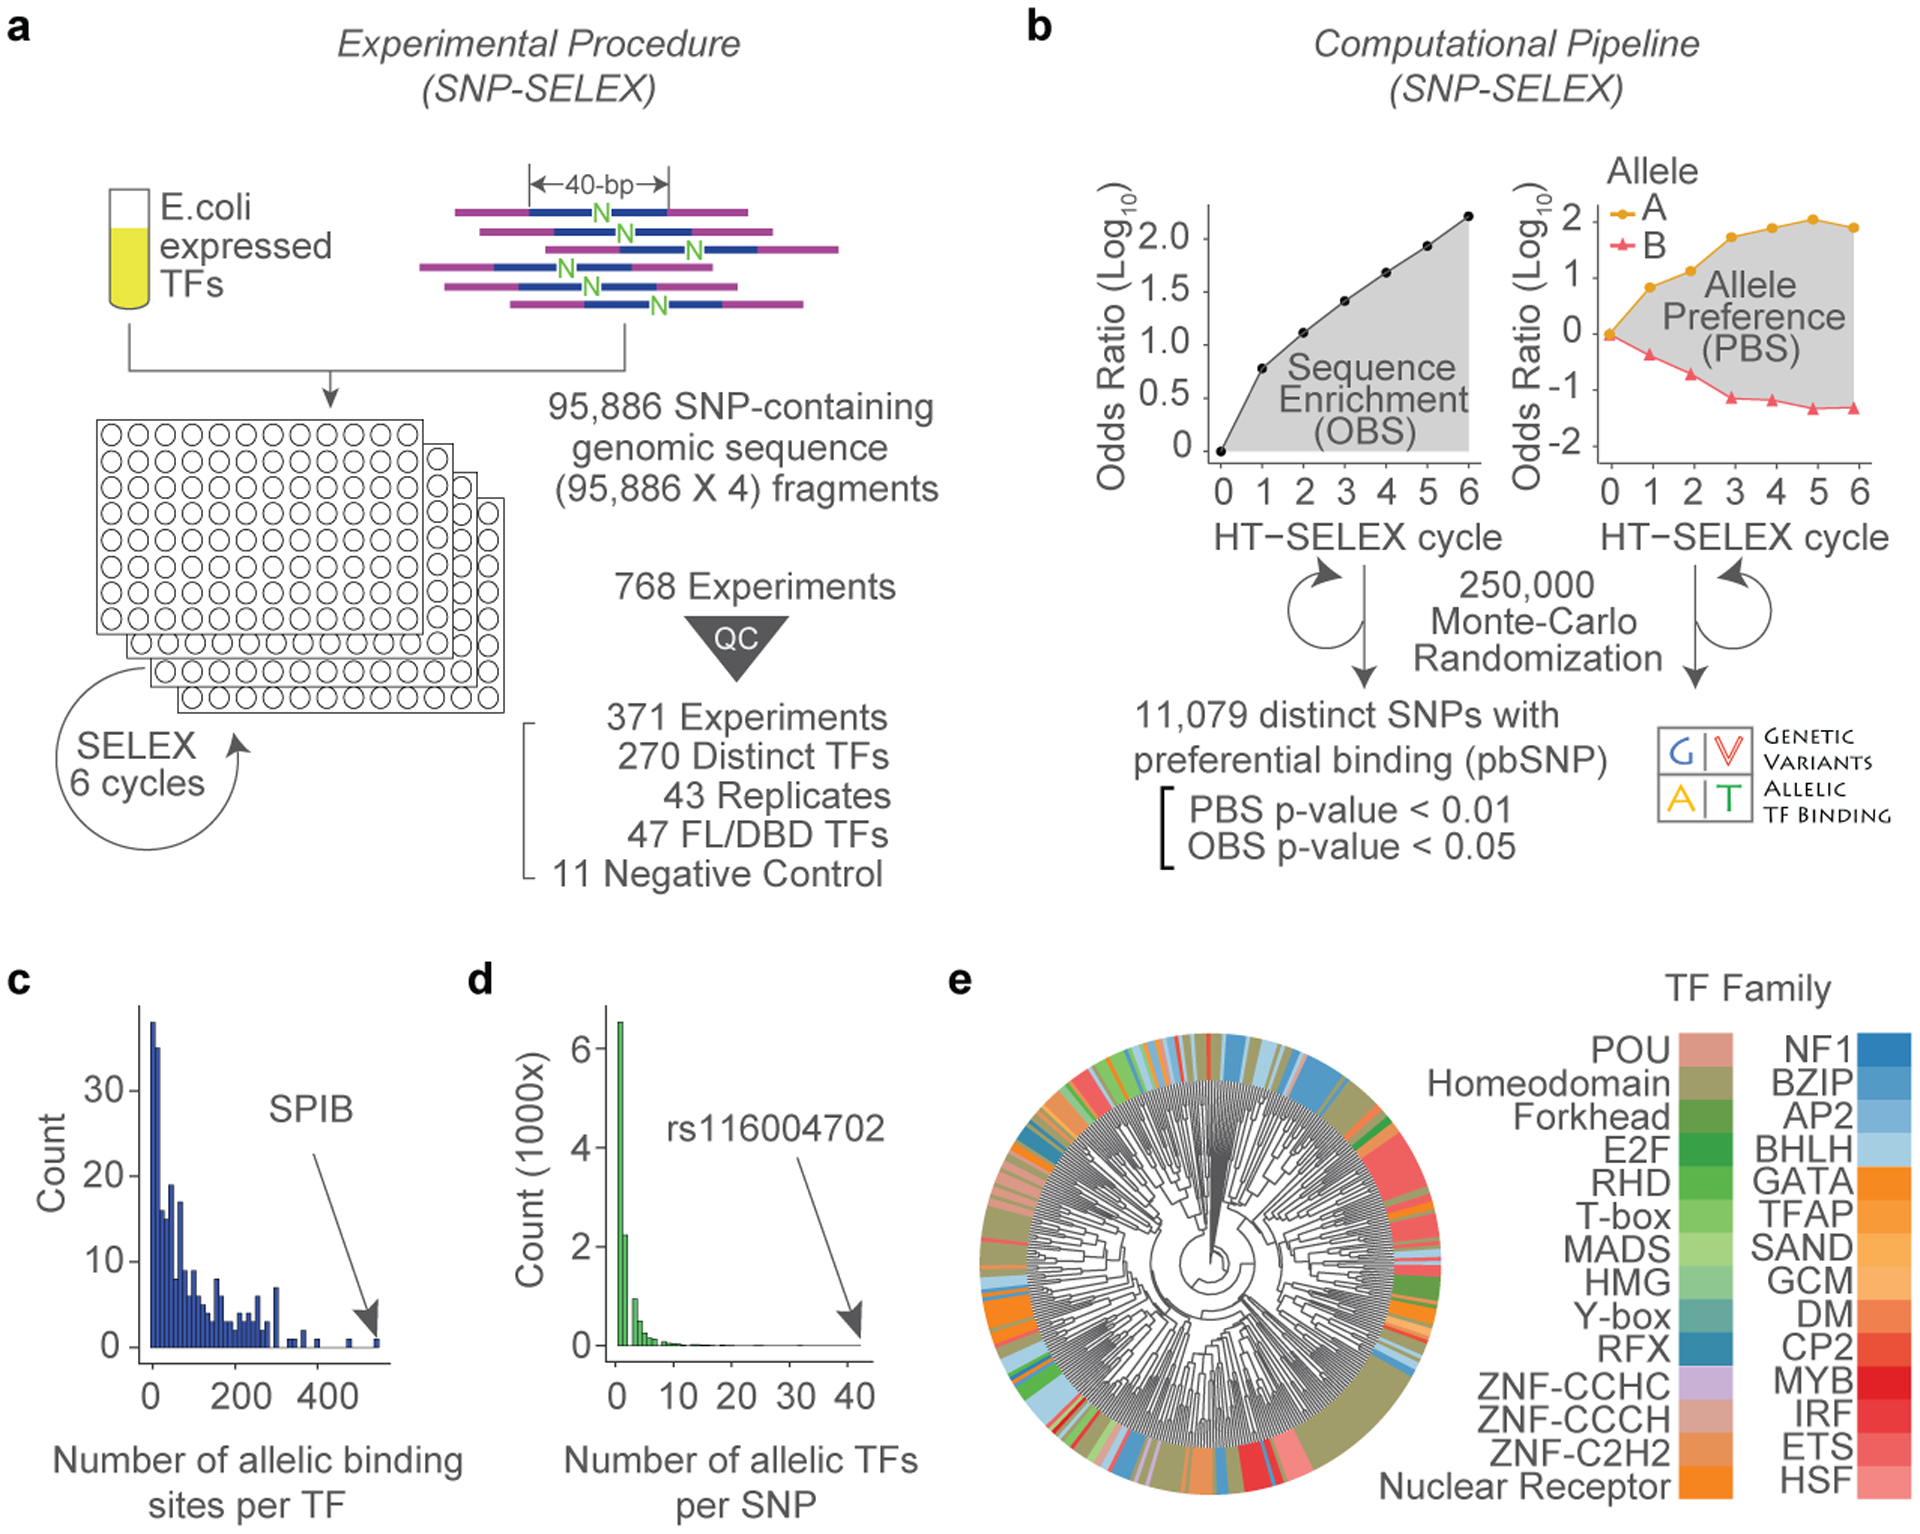
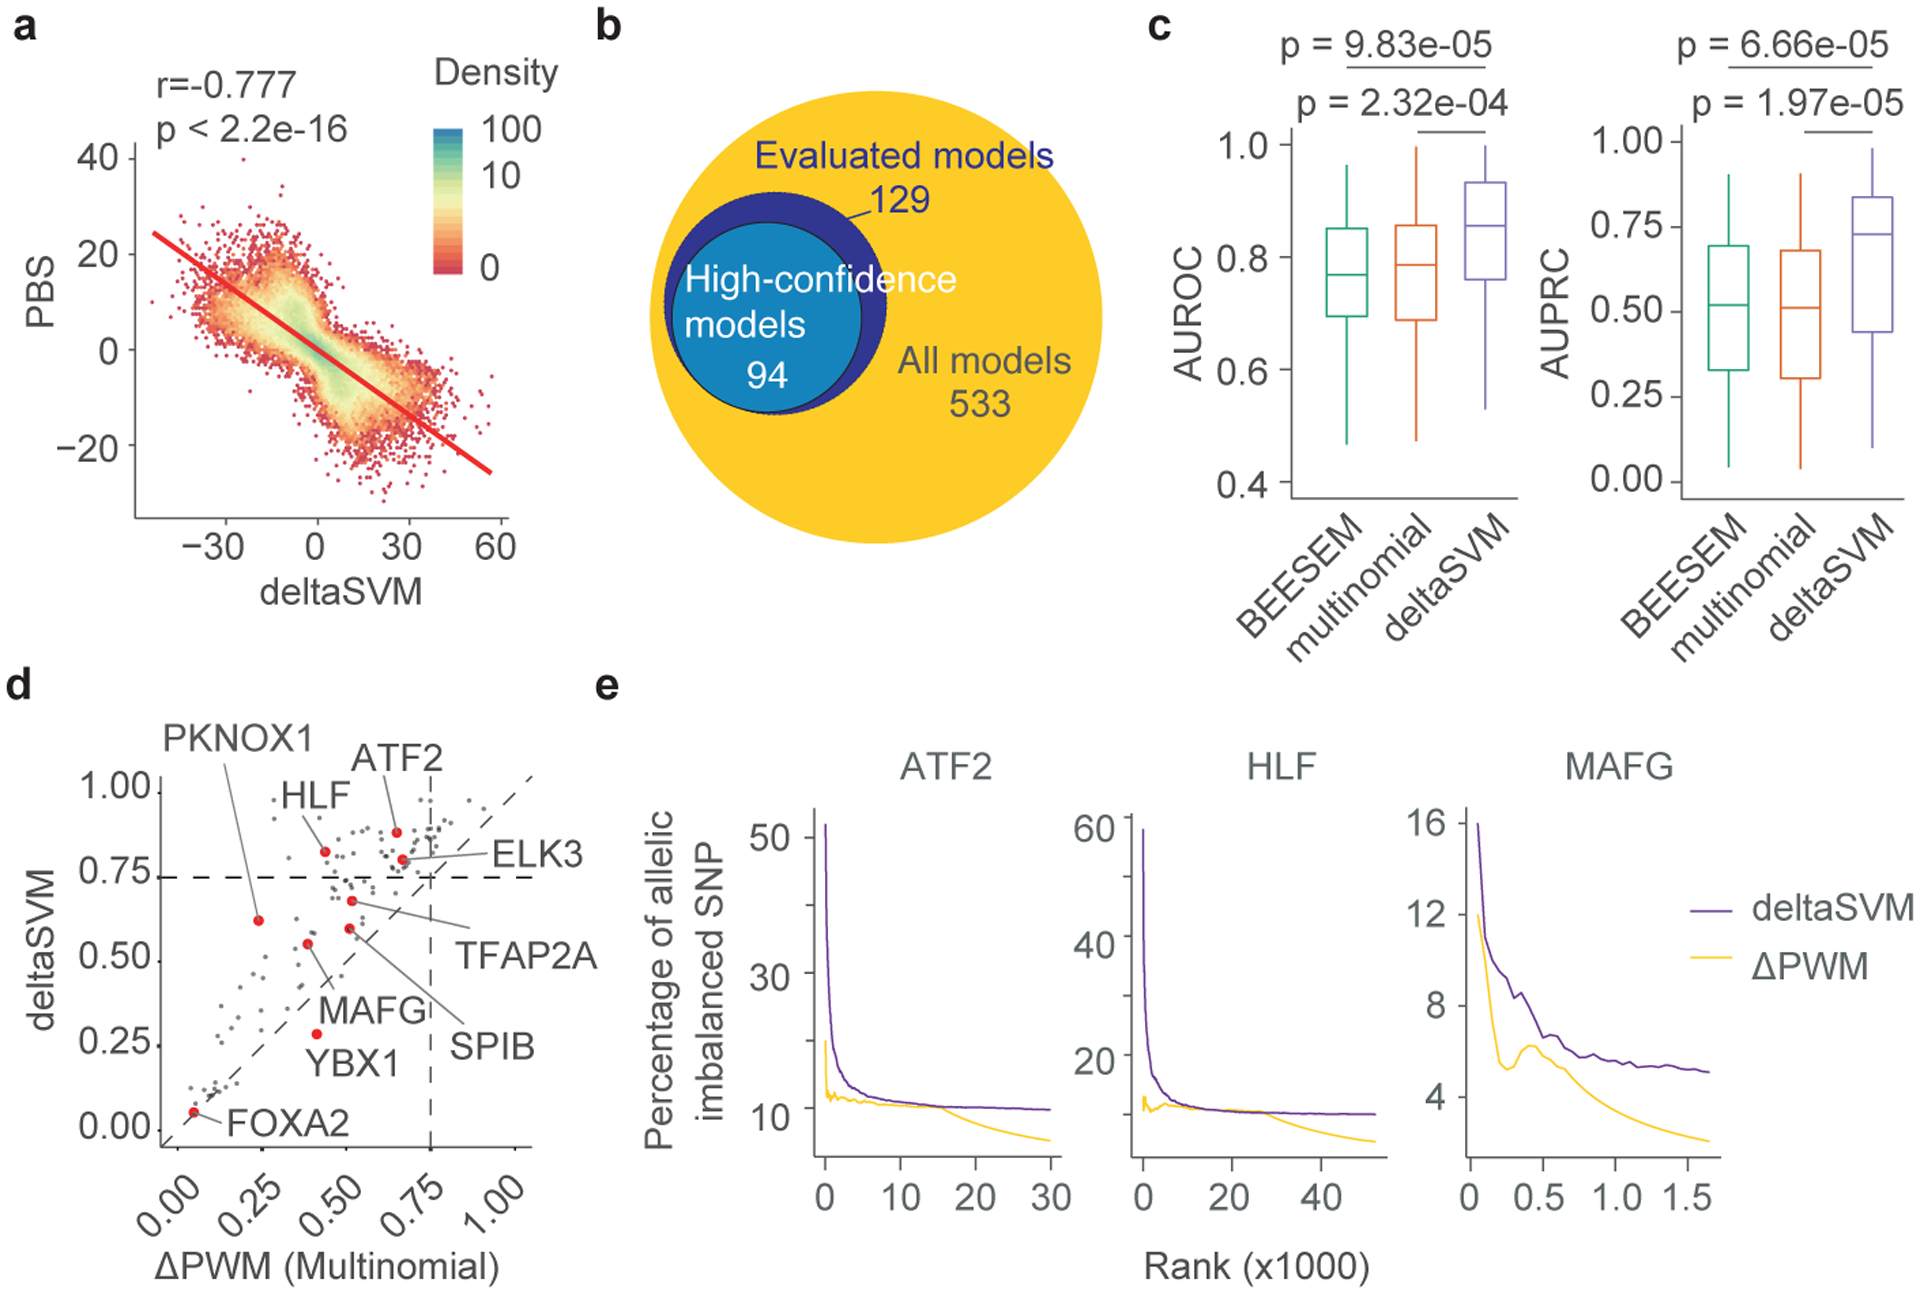
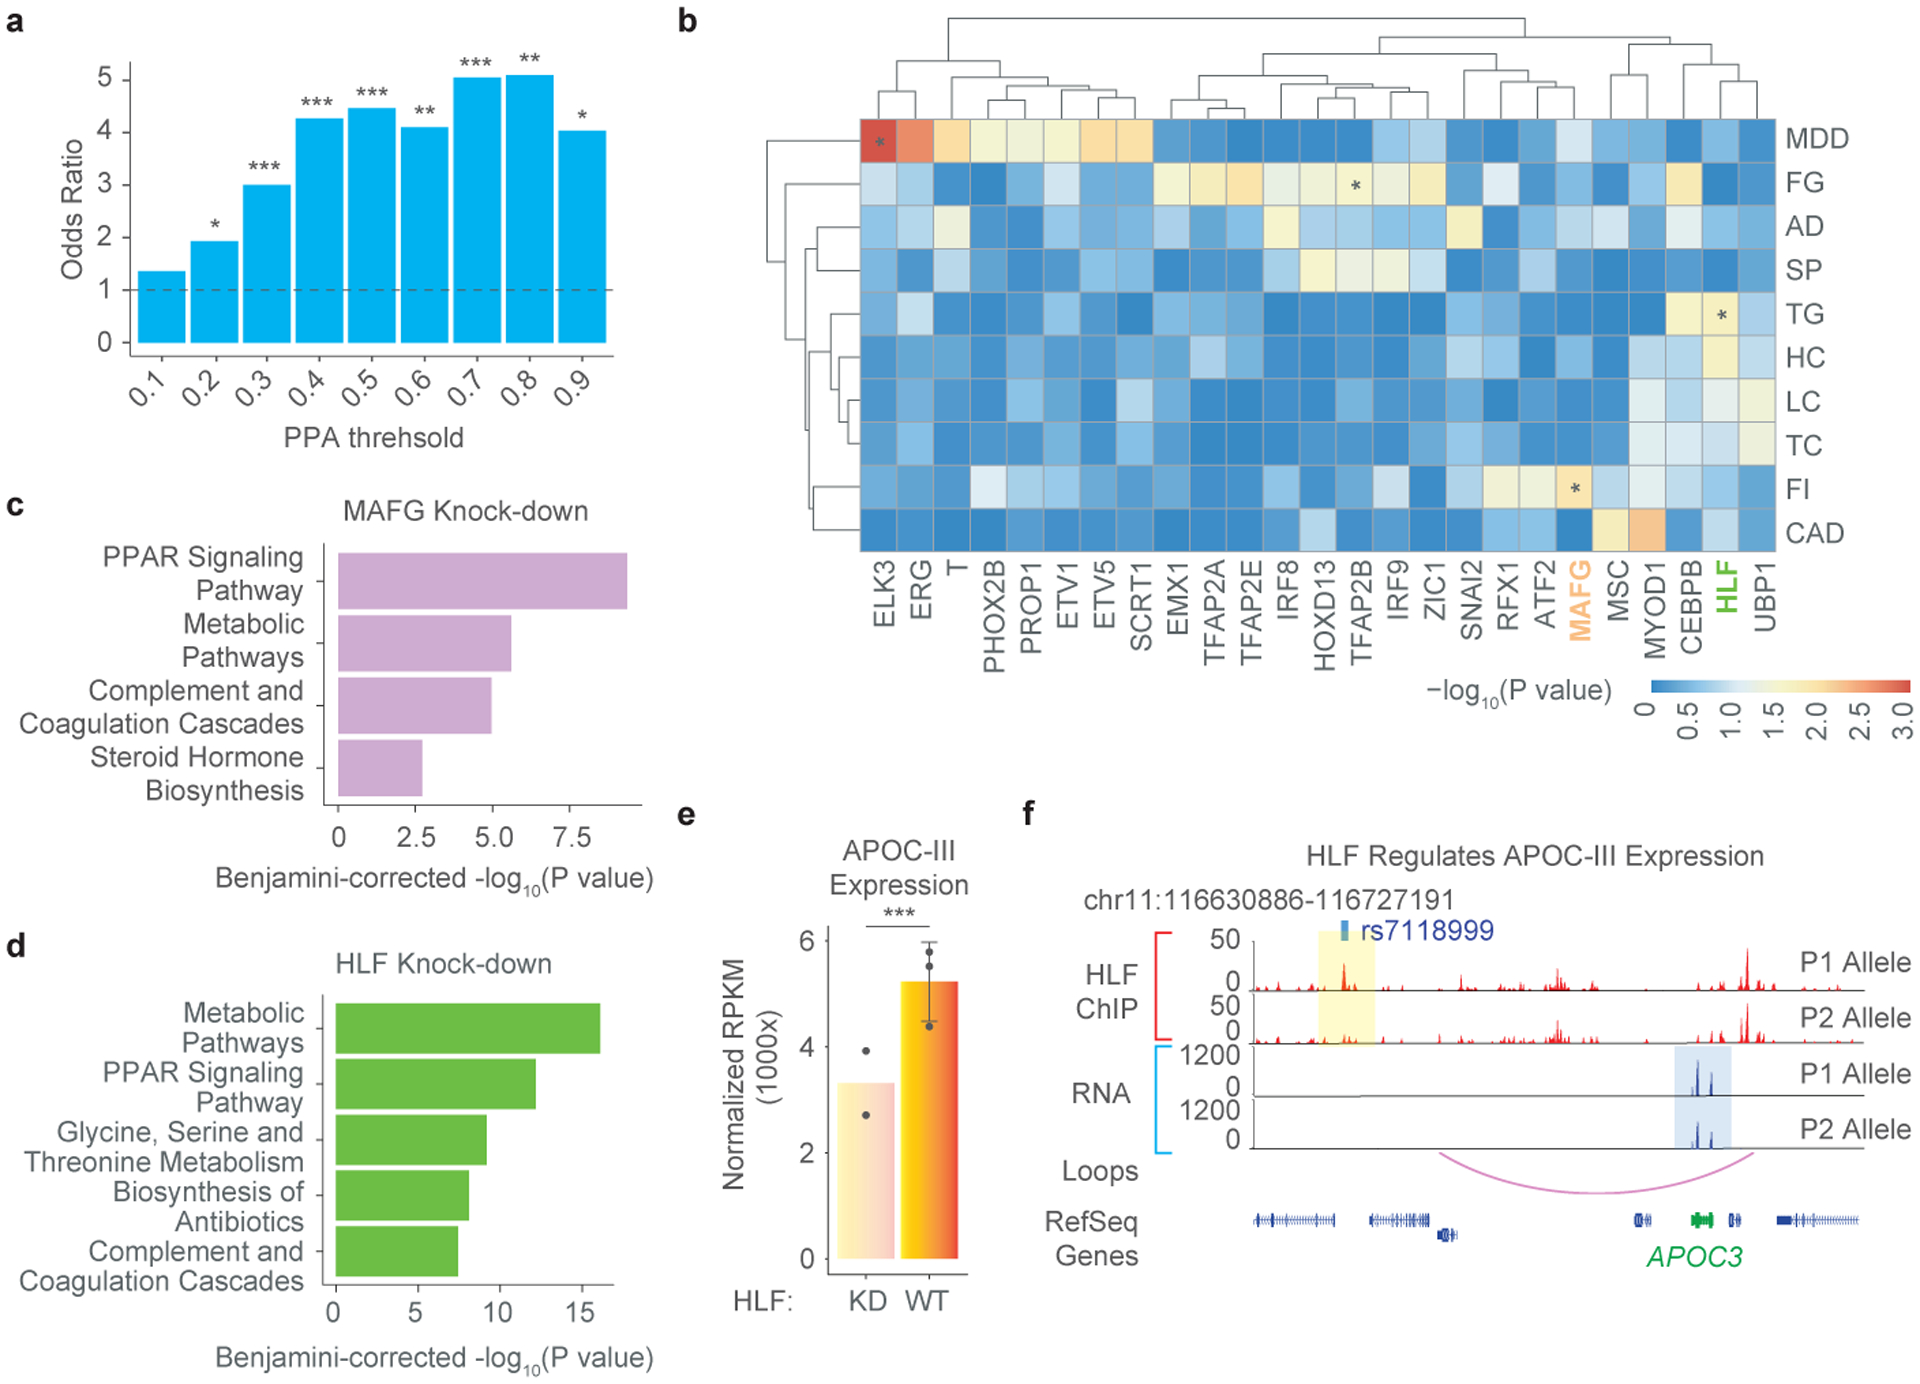
Many sequence variants have been linked to complex human traits and diseases1, but deciphering their biological functions remains challenging, as most of them reside in noncoding DNA. Here we have systematically assessed the binding of 270 human transcription factors to 95,886 noncoding variants in the human genome using an ultra-high-throughput multiplex protein-DNA binding assay, termed single-nucleotide polymorphism evaluation by systematic evolution of ligands by exponential enrichment (SNP-SELEX). The resulting 828 million measurements of transcription factor-DNA interactions enable estimation of the relative affinity of these transcription factors to each variant in vitro and evaluation of the current methods to predict the effects of noncoding variants on transcription factor binding. We show that the position weight matrices of most transcription factors lack sufficient predictive power, whereas the support vector machine combined with the gapped k-mer representation show much improved performance, when assessed on results from independent SNP-SELEX experiments involving a new set of 61,020 sequence variants. We report highly predictive models for 94 human transcription factors and demonstrate their utility in genome-wide association studies and understanding of the molecular pathways involved in diverse human traits and diseases.


Figures

Extended Data Figure 1 |
Extended Data Figure 1 |. The sequence features of input oligonucleotides.
(a) An example of the oligo design for SNP-SELEX. Two random nucleotides were added to each end of the oligos as unique molecule identifiers (UMIs) to remove over-represented PCR duplicates. Illumina TruSeq dual-index system was adapted for oligo design. (b) The GC content (left) and CpG frequency (right) of SNP-SELEX input were more similar to those of TF binding sites in the human genome (TFBS), open chromatin (DHS) and the entire human genome in general (hg19) than random sequences used in HT-SELEX. (c) Comparison of k-mer coverage (left) and sequencing depth (right) of libraries between SNP-SELEX and HT-SELEX.
Extended Data Figure 2 |
Extended Data Figure 2 |. Derivation of OBS and PBS.
(a) Equations demonstrate the relationships between OBS and the association constant (Ka) of TF-DNA interactions. (b) An example of how oligonucleotides were evolutionarily selected during SNP-SELEX. Table of counts for oligonucleotide chr6:31171810–31171850 is shown at left and the OBS curve is shown on the right. (c-d) Histograms show the number of oligonucleotide sequence bound by each TF (c), the number of binding TFs for each oligonucleotide sequence (d). (e) An example of how the abundance of SNPs varies in the course of a SNP-SELEX experiment. The table of counts for SNP rs9263880 is shown at the left and PBS curve is shown on the right. The orange line inside the black boxes indicates the reads of T-allele-containing fragment and the blue line shows the reads of C-allele-containing fragment.
Extended Data Figure 3 |
Extended Data Figure 3 |. Reproducibility of SNP-SELEX data.
(a) Density plots show an example of the distribution of OBS of all oligos assayed in ELK SNP-SELEX replicative experiments. Vertical dashed lines indicate the cutoff for significant binding sequences (p=0.05 by Monte Carlo randomization). The 40-bp genomic sequences with OBS that is over the indicated values are recognized as significant binding sites of ELK1 or ELK4. DBD: DNA binding domain. FL: full-length protein. (b) Density plots show an example of the distribution of PBS of all oligos assayed in ELK SNP-SELEX replicative experiments. Vertical dashed lines indicate the cutoff for significantly differential binding (p=0.01 by Monte Carlo randomization). The 40-bp SNP-containing genomic sequences with PBS over the indicated values are recognized as significantly differential (allelic) binding sites of ELK1 or ELK4. DBD: DNA binding domain. FL: full-length protein. (c) An example illustrating differential DNA binding at six SNPs, in four SNP-SELEX experiments, including (i) two full-length ELK1 replicates, on the first two lines; (ii) one DNA binding domain (DBD) ELK1, on the third line; and one full-length ELK4 TF which belongs to the same structure family, on the last line. Each panel represents the logarithmic odds-ratio (y-axis) of observing the reference allele (REF), represented by a triangle, and the alternative allele (ALT), represented by a circle, over SNP-SELEX cycles (x-axis). The two alleles of each SNP are colored according to their nucleotides, where A is red, C is green, G is blue, and T is yellow. The figure shows that SNP-SELEX experiments of both replicates, full-length, DBD, and same structure TF family presents the same allelic preference. (d, e) Comparison of oligonucleotide enrichment (d) and allele preference (e) between different biological replicates (replicates), full-length (FL), and DNA Binding Domain (DBD), members of the same structural family (family), and random pairs (others). For each pair of experiments, we compared the oligonucleotides that display binding in both experiments for binding oligonucleotides and compared Pearson Correlation Coefficients (PCC) between the PBS from each experiment. Horizontal line is median; hinges are 25th and 75th percentile; whiskers are most extreme value no further than 1.5 * IQR.
Extended Data Figure 4 |
Extended Data Figure 4 |. SNP-SELEX results are correlated with TF binding in vitro and in vivo.
(a) Comparison of the SNPs with differential TF binding determined by SNP-SELEX and ΔPWM. An error matrix table showing the number of SNPs for which the same allele was identified as the preferred allele by both methods (Agreed), SNPs for which one allele was determined as preferential substrate by one method but no allele was called by the other (PWM+/ SNP-SELEX− and PWM−/ SNP-SELEX+), and SNPs where different alleles were called as preferential bound by each method (Contradictory). Note that the vast majority of the results agreed, with the most disagreement coming from PWM+/ SNP-SELEX−. (b) Comparison of the PWM scores (left) and the OBS scores (right) between SNPs with concordant and discordant predictions. Note that discordant predictions mostly come from weak binding sites with low PWM scores and low OBS scores. Two-sided Mann-Whitney U test p-value is shown on the top. Horizontal line is median; hinges are 25th and 75th percentile; whiskers are most extreme value no further than 1.5 * IQR. (c) Boxplots show performance of ΔPWM in predicting pbSNPs grouped by DNA binding domain structural families (left) and information content of motifs for each corresponding TF family (right). AUPRC (area under the precision-recall curve) is used to evaluate the performance of ΔPWM. Horizontal line is median; hinges are 25th and 75th percentile; whiskers are most extreme value no further than 1.5 * IQR. (d) Boxplots show Pearson Correlation Coefficients (PCC) between PBS and ΔPWM (left) and information content (right) for each TF family. PCCs for some TF families are higher than others, independent of the information content (IC) of corresponding PWM models. Horizontal line is median; hinges are 25th and 75th percentile; whiskers are most extreme value no further than 1.5 * IQR. (e) A scatterplot shows the correlation of PBS and allelic binding ratio derived from SNP-SELEX and ChIP-seq in GM12878 cells respectively. The PCCs and p-values calculated based on t-test are shown on the lower right corner. The allelic binding ratio is computed as the log10 odd ratio over input (see Methods for details). In total, 341 TF-SNP pairs including 269 unique SNPs and six TFs were plotted. TFs used include ATF2, PKNOX1, IRF3, NR2F1, YBX1, and TBX21.
Extended Data Figure 5 |
Extended Data Figure 5 |. SNP-SELEX results are correlated with allelic enhancer activities detected using high-throughput reporter assays.
(a) A schematic diagram shows the strategy of using STARR-seq to assess the impact of SNPs in enhancer activity in HepG2 and HEK293T cells. (b) Heatmap shows pair-wise Pearson’s Correlation Coefficients (PCCs) calculated among STARR-seq datasets. The read counts of each SNP in the starting reporter library, in the mRNA pools in three HepG2 replicates, and three HEK293T replicates were used for PCC calculation. (c) MA plot of the logarithmic fold-change (y-axis) of read counts of SNP-containing mRNA over that of the input library expressed as logarithmic counts per million (CPM) (x-axis) for HEK293T, on the top panel, and HepG2, on the bottom panel. Each dot on the plot corresponds to an oligonucleotide, and the oligonucleotides showing enrichment (empirical FDR<0.05) are colored in red. (d) Barplots comparing the fractions of paSNPs determined using STARR-seq in pbSNPs and non-pbSNPs by SNP-SELEX. Odds Ratio (OR) is shown between imbalanced and balanced SNPs, and the p-value is calculated by Fisher exact test. Error bars denote the 95% confidence interval calculated by Wilson method (Methods). Only pbSNPs corresponding to the highly expressed TFs (RPKM > 3) in the cell lines are considered for the analysis. n=167 SNP-cell pairs for pbSNPs; n=509 SNP-cell pairs for non-pbSNPs. (e) Barplots comparing the fractions of paSNPs determined using STARR-seq in pbSNPs and non-pbSNPs predicted by ΔPWM. SNPs with p-value < 0.01 by atSNP were considered as pbSNPs. Odds Ratio (OR) is shown between imbalanced and balanced SNPs, and the p-value is calculated by Fisher exact test. Error bars denote the 95% confidence interval calculated by Wilson method (Methods). Only pbSNPs by highly expressed TFs (RPKM > 3) in the corresponding cell lines are considered for the analysis. n=564 SNP-cell pairs for pbSNPs; n=112 SNP-cell pairs for non-pbSNPs.
Extended Data Figure 6 |
Extended Data Figure 6 |. deltaSVM more accurately predicts impacts of noncoding variants on TF binding in vivo than ΔPWM.
(a) A schematic graph for the training of deltaSVM models for 533 TFs. Data from previously reported HT-SELEX experiments using random DNA oligonucleotide sequences were used to derive these models. To develop deltaSVM models for each TF, the reads in each HT-SELEX cycle beyond cycle 0 reads were used as positive training sets, and the reads not enriched were used as negative training sets. All unique 10-mers were scored using gapped-kmer models to compute weights for deltaSVM. The two alleles of the 40-bp SELEX oligos were then scored using deltaSVM models to generate deltaSVM scores. (b) Boxplots compare the performance of deltaSVM, PWM derived from HT-SELEX with the multinomial or BEESEM algorithms in predicting pbSNPs for 129 TFs. The results from five-fold cross-validation were shown. Two statistical evaluations were used, including area under the Receiver Operator Curve (AUROC, left) and area under the Precision-Recall Curve (AUPRC, right). P-values by two-sided Mann-Whitney U test are shown on the top. Horizontal line is median; hinges are 25th and 75th percentile; whiskers are most extreme value no further than 1.5 * IQR. (c, d) Scatterplots compare the performance between deltaSVM (y-axis) and ΔPWM (x-axis) derived by multinomial models (c) and BEESEM models (d) by in predicting allelic binding of 129 TFs for which both models were available. Results from five-fold cross-validation were shown. The values in both axes were AUPRC. (e) An overview of the SNP-SELEX experimental procedure describing the novel batch of SNP-SELEX. (f) A scatterplot compares the performance between deltaSVM (y-axis) and BEESEM-generated ΔPWM (x-axis) in predicting allelic binding of 87 TFs for which both models are available by the novel batch of SNP-SELEX. The values in both axes are AUPRC. (g) The logo describes the PWM model of a homodimeric binding pattern of TF HLF, with the monomeric half-site indicated by the purple arrows. The red boxes indicate the positions at which the SNP rs79124498 is located (left) and its co-dependent base position (right). The y-axis corresponds to the information content at each position of the PWM (x-axis).
Extended Data Figure 7 |
Extended Data Figure 7 |. Comparison of deltaSVM models and ΔPWM in predicting allelic TF binding in weak and strong TF binding sites.
SNPs are categorized into five quantiles based on the OBS of the 40-bp DNA fragments. The performance of ΔPWM (green) and deltaSVM (orange) in predicting allelic binding of TFs was evaluated for SNPs in each category. Two batches of pbSNPs were used as gold standards for performance assessment: the pbSNPs from the initial SNP-SELEX experiments, with five-fold cross-validation (a) and the novel batch SNP-SELEX data (b). Both AUROC (upper) and AUPRC (lower) are shown for statistic assessment of the model performance. The first quantile represents SNPs with the weakest binding strength and the fifth quantile represents SNPs with the strongest binding strength. Horizontal line is median; hinges are 25th and 75th percentile; whiskers are most extreme value no further than 1.5 * IQR.
Extended Data Figure 8 |
Extended Data Figure 8 |. deltaSVM models predict more accurately the noncoding variants affecting TF binding in vivo than ΔPWM.
(a) DeltaSVM models outperform ΔPWM in predicting differential DNA binding in vitro. Precision-Recall curves were used to assess the performance of either model in predicting allelic binding events identified in SNP-SELEX for three TFs, including ATF2, HLF, and MAFG. In all three cases, the performance of deltaSVM models (purple) was much better than that of ΔPWM (yellow). The area under the curve (AUC) used for quantitative comparison was shown within each plot. (b) Barplots show the fractions of pbSNPs exhibiting allelic imbalance in TF ChIP-seq assays in HepG2 cells among all SNPs that were predicted to be differentially bound by a TF according to the deltaSVM models (purple) or the ΔPWM (yellow). The same datasets as in Fig. 3e were used. Only SNPs that were predicted to be bound by the TF were used in the comparison. The threshold for oligonucleotide binding and for the predicted pbSNPs was determined as the median score for the bound oligonucleotides and pbSNPs respectively. Error bars centered with mean percentage denote the 95% confidence interval calculated by Wilson method (Methods). For ΔPWM, n=2872(ATF2); n=4134(HLF); n=100(MAFG). For deltaSVM, n=115(ATF2); n=355(HLF); n=16(MAFG). (c) Barplots show the fractions of pbSNPs exhibiting allelic imbalance in TF ChIP-seq assays in GM12878 cells among all SNPs that were predicted as differentially bound by a TF according to the deltaSVM models (purple) or the ΔPWM (yellow). Three TFs were included in the analyses, ATF2, NR2F1, and PKNOX1. Only SNPs that were predicted to be bound by the TF were used in the comparison. The threshold for oligonucleotide binding and the predicted pbSNPs was determined as the median scores for the bound oligos and pbSNPs respectively. Error bars centered with mean percentage denote the 95% confidence interval calculated by Wilson method (Methods). For ΔPWM, n=4318(ATF2); n=673(NR2F1); n=225(PKNOX1). For deltaSVM, n=142(ATF2); n=229(NR2F1); n=142(PKNOX1). (d) Similar to Fig. 3e, deltaSVM models outperform ΔPWM in predicting differential DNA binding in vivo. Three TF ChIP-seq datasets from GM12878 cells were used for the comparison, including the same dataset as shown in panel b. Elbow plots show that for each TF, the top-ranked allelic SNPs predicted by deltaSVM models were found to have allelic imbalance in ChIP-seq assays performed in GM12878 cells (purple). By contrast, for allelic SNPs predicted by ΔPWM, only a small fraction showed allelic imbalance in vivo (yellow).
Extended Data Figure 9 |
Extended Data Figure 9 |. T2D risk SNPs are enriched for pbSNPs.
(a) Barplots show the enrichment of pbSNPs in T2D risk SNPs identified from an independent study (Greenwald, et al.). The levels of enrichment were displayed for different groups risk SNPs categorized based on the PPA (Posterior Probability of Association). Note that SNPs with stronger PPAs and thus higher likelihood of being causal for T2D are more likely to be pbSNPs. (b) Barplots show the enrichment of T2D risk SNPs in allelic TF binding SNPs predicted by PWM models using the same credible sets as Fig. 4a (Mahajan, et al.). Specifically, SNPs with p-value < 0.01 by atSNP were used as allelic TF binding SNPs. The level of association is categorized according to PPA as in (a). Note that the likely causal SNPs with stronger T2D risk association no longer display higher enrichment for ΔPWM-predicted allelic SNPs. (c) A T2D GWAS leading SNP rs7578326 and a pbSNP differentially bound by TFs CEBPB, CEBPE, MYBL2, and NFE2, is predicted to target the IRS1 gene based on Hi-C analysis (circled in blue in bottom panel) in HepG2 cells. The locus around the SNP is enriched for H3K27ac and H3K4me1. (d) CRISPRi using dCas9 fused with repressive KRAB domain and guide RNA targeting the locus of SNP rs7578326 (upper) leads to reduced expression of IRS1 gene in HepG2 but not in HEK293T cells. qPCR results from three biological replicates in HepG2 (left) and HEK293 (right) cells are plotted in the bottom panel. Y-axis shows the power transformed values of expression presented as mean values +/− SD. Raw data are shown as small black circles for clarification. P-values computed using two-sided t-test are noted on the top. (e) SNP rs7578326 is an eQTL in liver and adipose tissues. Normalized expression value from GTEx project for IRS1 gene is grouped based on individuals’ genotype of SNP rs7578326. Linear regression p-values and effect sizes are noted on the top. Horizontal line is median; hinges are 25th and 75th percentile; whiskers are most extreme value no further than 1.5 * IQR.
Extended Data Figure 10 |
Extended Data Figure 10 |. Candidate TFs involved in complex traits and diseases identified by enrichment of TF binding alone.
(a) A heatmap shows the significant enrichment of SNPs predicted to be located within TF-DNA binding sites among traits- or disease-associated SNP. The color key is shown, and the value represents the −log10 p-value. TF-trait pairs mentioned in the text were marked with *. Note that the SNPs here do not necessarily affect TF binding affinity. The candidate regulator we observed and validated (Fig. 4b) could not be identified here if we only use the presence of SNPs at the binding sites without taking into account the impact of SNP on binding affinity. (b, d) qPCR results from three biological replicates of MAFG (b) and HLF (d) in WT (HepG2), Control (Negative and HiPerfect), and cells treated with different siRNAs. Expression values are presented as mean values +/− SD. (c, e) MA-plot showing differentially expressed genes comparing MAFG knockdown (c) and HLF knockdown (e) versus controls. Significant differentially expressed genes (FDR<0.2) were marked in red.
Figure 1 |
Figure 1 |. High throughput analysis of the binding of human TFs to common sequence variants by SNP-SELEX.
(a) An overview of the SNP-SELEX experimental procedure. (b) The data obtained from each SELEX cycle was analyzed to determine OBS and PBS. Two alleles of the SNP are shown in different colors and shapes, solid circle for the alternative allele, and solid triangle for the reference allele. Differential binding information for all SNPs tested is publicly available from the GVAT database. (c-d) Histograms show the number of pbSNPs bound by each TF (c), and the number of TFs showing allelic binding for each pbSNP (d). (e) A clustering diagram of TFs tested in this study was generated based on the pairwise Pearson correlation of their DNA binding specificity from the SNP-SELEX data. For each pair of experiments, we computed the Pearson Correlation Coefficient (PCC) and dissimilarity (1 - PCC) of PBS between significantly enriched oligos in both experiments and clustered them using the UPGMA algorithm.
Figure 2 |
Figure 2 |. Evaluation of the current PWM models using the SNP-SELEX data.
(a) A scatterplot shows PBS on y-axis and ΔPWM scores on x-axis. The red line denotes a linear regression of PBS as a function of ΔPWM. The Pearson Correlation Coefficient (PCC) and p-values calculated based on two-sided t-test are shown on the upper left corner. The color key for the dot density is shown. (b) Examples of the Precision-Recall Curve show the variation of performance of different PWM models in predicting pbSNPs. (c) A scatterplot ranks the predictive performance of 129 PWMs. Note that AUPRC of only 24 TFs exceeded 0.75. TFs shown in (b) were highlighted in red dots. (d) A scatterplot shows the correlation of allelic biases of DNA binding detected from ChIP-seq experiments in HepG2 cells and those predicted by PBS (blue) and ΔPWM (yellow). The PCC and p-value calculated based on two-sided t-test are shown. The allelic binding ratio is computed as log10 OR over input. In total, 193 TF-SNP pairs involving 147 unique SNPs and six TFs were plotted, including ATF2, FOXA2, HLF, MAFG, YBX1, and FOXA1. (e) Comparison of PBS and ΔPWM in predicting the impact of SNPs in differential enhancer activity. The SNPs were categorized into five quantiles according to their effect size in affecting TF binding based on PBS (blue) or ΔPWM (yellow) accumulatively. Note that quantile 1 includes the SNPs that display the largest effect size in contributing to differential TF binding.
Figure 3 |
Figure 3 |. DeltaSVM models outperform ΔPWM in predicting differential TF binding to noncoding variants in vitro and in vivo.
(a) A scatterplot shows correlation between PBS and deltaSVM scores. The red line denotes a linear regression of the two scores. The PCC and the p-value calculated based on two-sided t-test are shown. Each dot represents one TF-SNP pair. The color key was shown for the dot density. (b) Venn diagrams show the number of TFs with differential DNA binding models or experimental data defined by deltaSVM. (c) Boxplots show the comparison of the performance of deltaSVM, PWM originally derived in HT-SELEX (multi-nominal), or derived with BEESEM algorithm (BEESEM) in predicting pbSNPs of novel SNP-SELEX batch for 87 TFs. Two statistical evaluation methods were used, including AUROC (left) and AUPRC (right). P-values by two-sided Wilcox-test are shown. Horizontal line is median; hinges are 25th and 75th percentile; whiskers are most extreme value no further than 1.5 * IQR. (d) A scatterplot shows the comparison of performance between deltaSVM (y-axis) and multinomial-generated ΔPWM (x-axis) in predicting pbSNPs identified in the novel batch of SNP-SELEX. The values in both axes are AUPRC. (e) Elbow plots show that the top-ranked allelic SNPs by deltaSVM models were mostly allelic TF binding SNPs in vivo identified by ChIP-seq in HepG2 cells (purple). For allelic SNPs predicted by ΔPWM, only a very small fraction showed allelic binding in vivo (yellow).
Figure 4 |
Figure 4 |. deltaSVM models predict TFs likely involved in complex traits and diseases.
(a) Barplot shows the enrichment of pbSNPs in reported T2D candidate causal SNPs. The level of association is categorized according to the PPA (Posterior Probability of Association) threshold. P-values for the enrichment by Fisher’s exact test are indicated, * p<0.05, ** p<0.01, and *** p<0.001. (b) A heatmap shows the significance of enrichment of SNPs with differential binding to TFs among traits- or disease-associated SNPs. Only TFs showing significant enrichment ratios in at least one trait are shown for clarity. The color key is shown for −log10 p-value. TF-trait pairs mentioned in the current study were highlighted with *. The traits analyzed included major depression disorder (MDD), fasting glucose (FG), Alzheimer’s Disease (AD), Schizophrenia (SP), Triglycerides (TG), HDL Cholesterol (HC), LDL Cholesterol (LC), Total Cholesterol (TC), Fasting Insulin (FI), and Coronary Artery Disease (CAD). (c-d) Barplots show enriched KEGG pathways significantly affected by MAFG (c) and HLF (d) knockdown in HepG2 cells. The BH corrected p-values were shown in y-axis (−log10 p-value). (e) Barplots show normalized gene expression for APOC-III in HLF KO and WT HepG2 cells. P-value is 6.67e-05 (***) as computed by DESeq2. Expression values are presented as mean values +/− SD. (f) Genome browser shot shows that differential HLF binding to rs7118999 is linked to allelic gene expression of APOC-III, which is predicted to be targeted by the SNP locus based on a chromatin loop in HepG2 cells (purple curve). The top two tracks (red) showed the binding of HLF by ChIP-seq with two alleles separated by haplotypes. Allelic expression (blue) of nearby genes was shown below. Note that stronger binding of HLF in P1 alleles corresponded to higher expression of APOC-III on the same allele.

Similar articles

Cited by

References

    1. Buniello A et al. The NHGRI-EBI GWAS Catalog of published genome-wide association studies, targeted arrays and summary statistics 2019. Nucleic Acids Res 47, D1005–D1012, doi:10.1093/nar/gky1120 (2019). - DOI - PMC - PubMed
    1. Weirauch MT et al. Evaluation of methods for modeling transcription factor sequence specificity. Nat Biotechnol 31, 126–134, doi:10.1038/nbt.2486 (2013). - DOI - PMC - PubMed
    1. Yin Y et al. Impact of cytosine methylation on DNA binding specificities of human transcription factors. Science 356, doi:10.1126/science.aaj2239 (2017). - DOI - PMC - PubMed
    1. Jolma A et al. DNA-binding specificities of human transcription factors. Cell 152, 327–339, doi:10.1016/j.cell.2012.12.009 (2013). - DOI - PubMed
    1. Ruan S, Swamidass SJ & Stormo GD BEESEM: estimation of binding energy models using HT-SELEX data. Bioinformatics 33, 2288–2295, doi:10.1093/bioinformatics/btx191 (2017). - DOI - PMC - PubMed

Publication types