. 2021 Feb;590(7846):492-497.
doi: 10.1038/s41586-020-03133-3. Epub 2021 Jan 27.

Whole-genome doubling confers unique genetic vulnerabilities on tumour cells

Affiliations

Whole-genome doubling confers unique genetic vulnerabilities on tumour cells

Ryan J Quinton et al. Nature. 2021 Feb.

Erratum in

Abstract

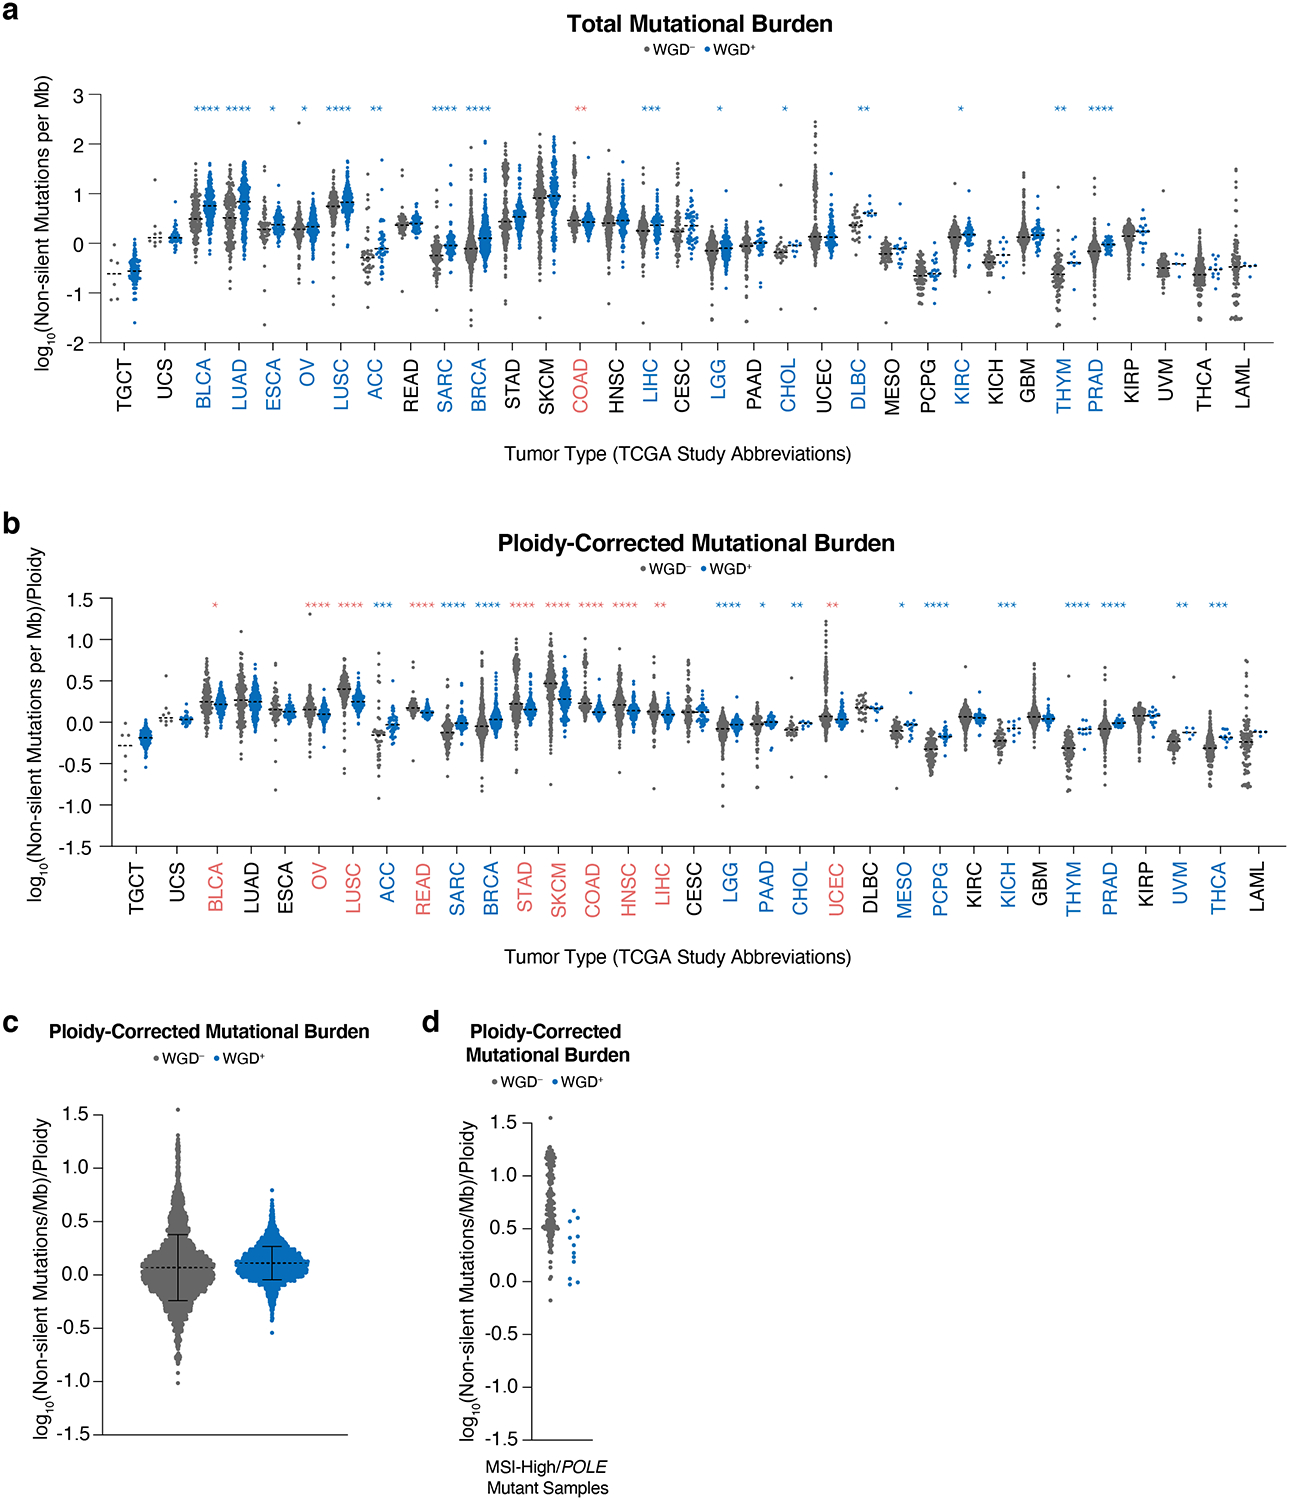
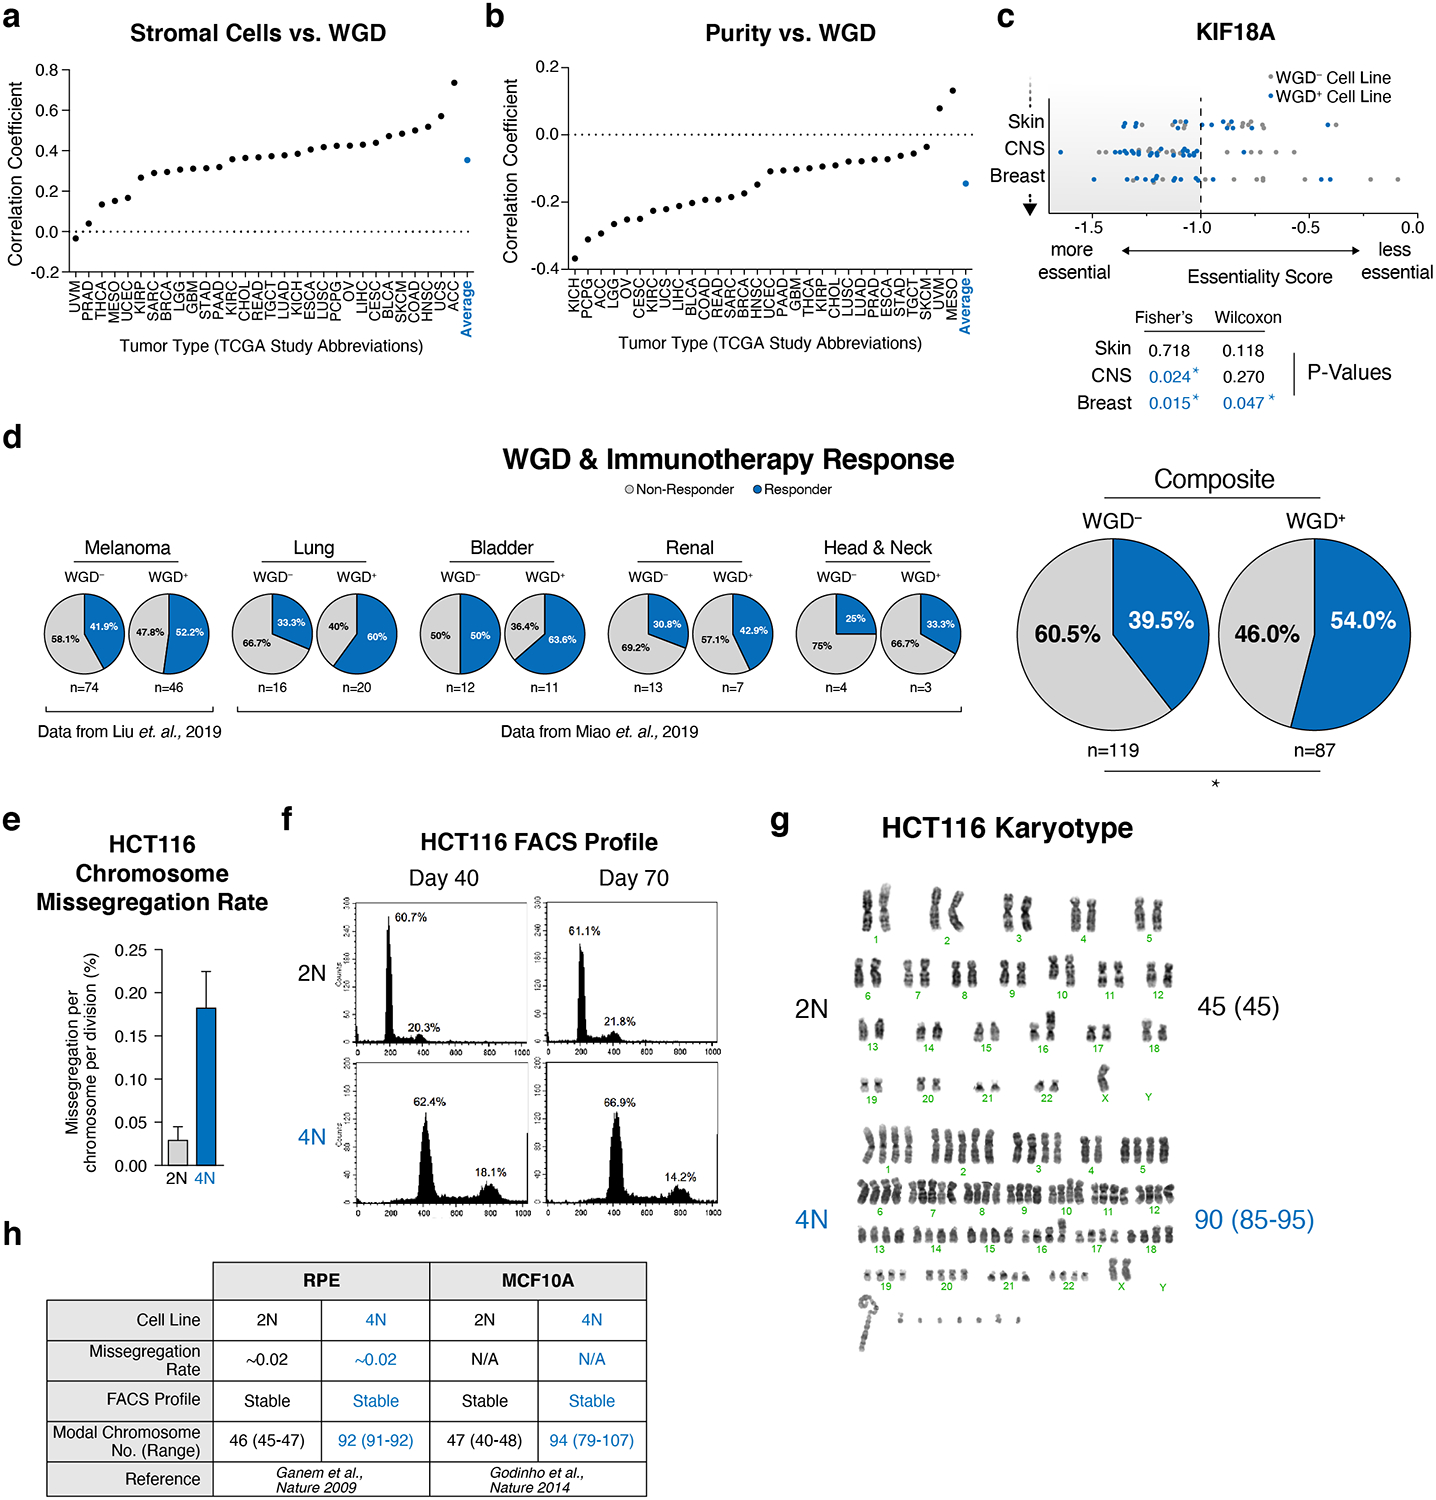
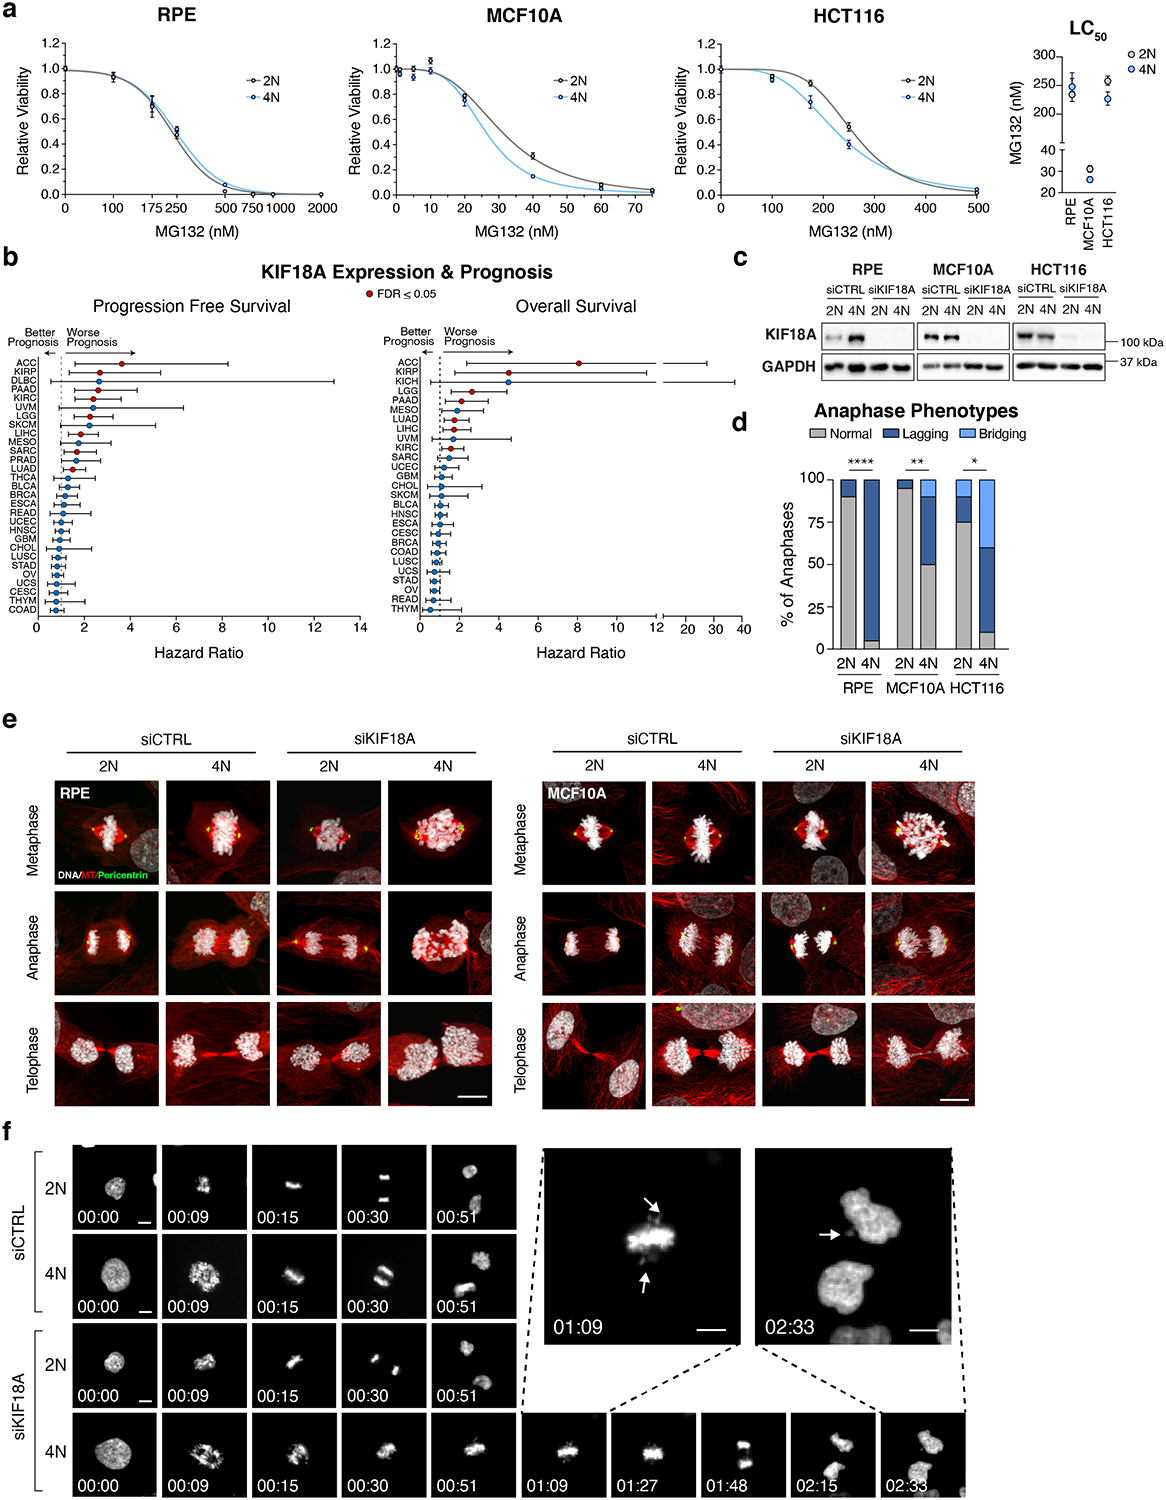
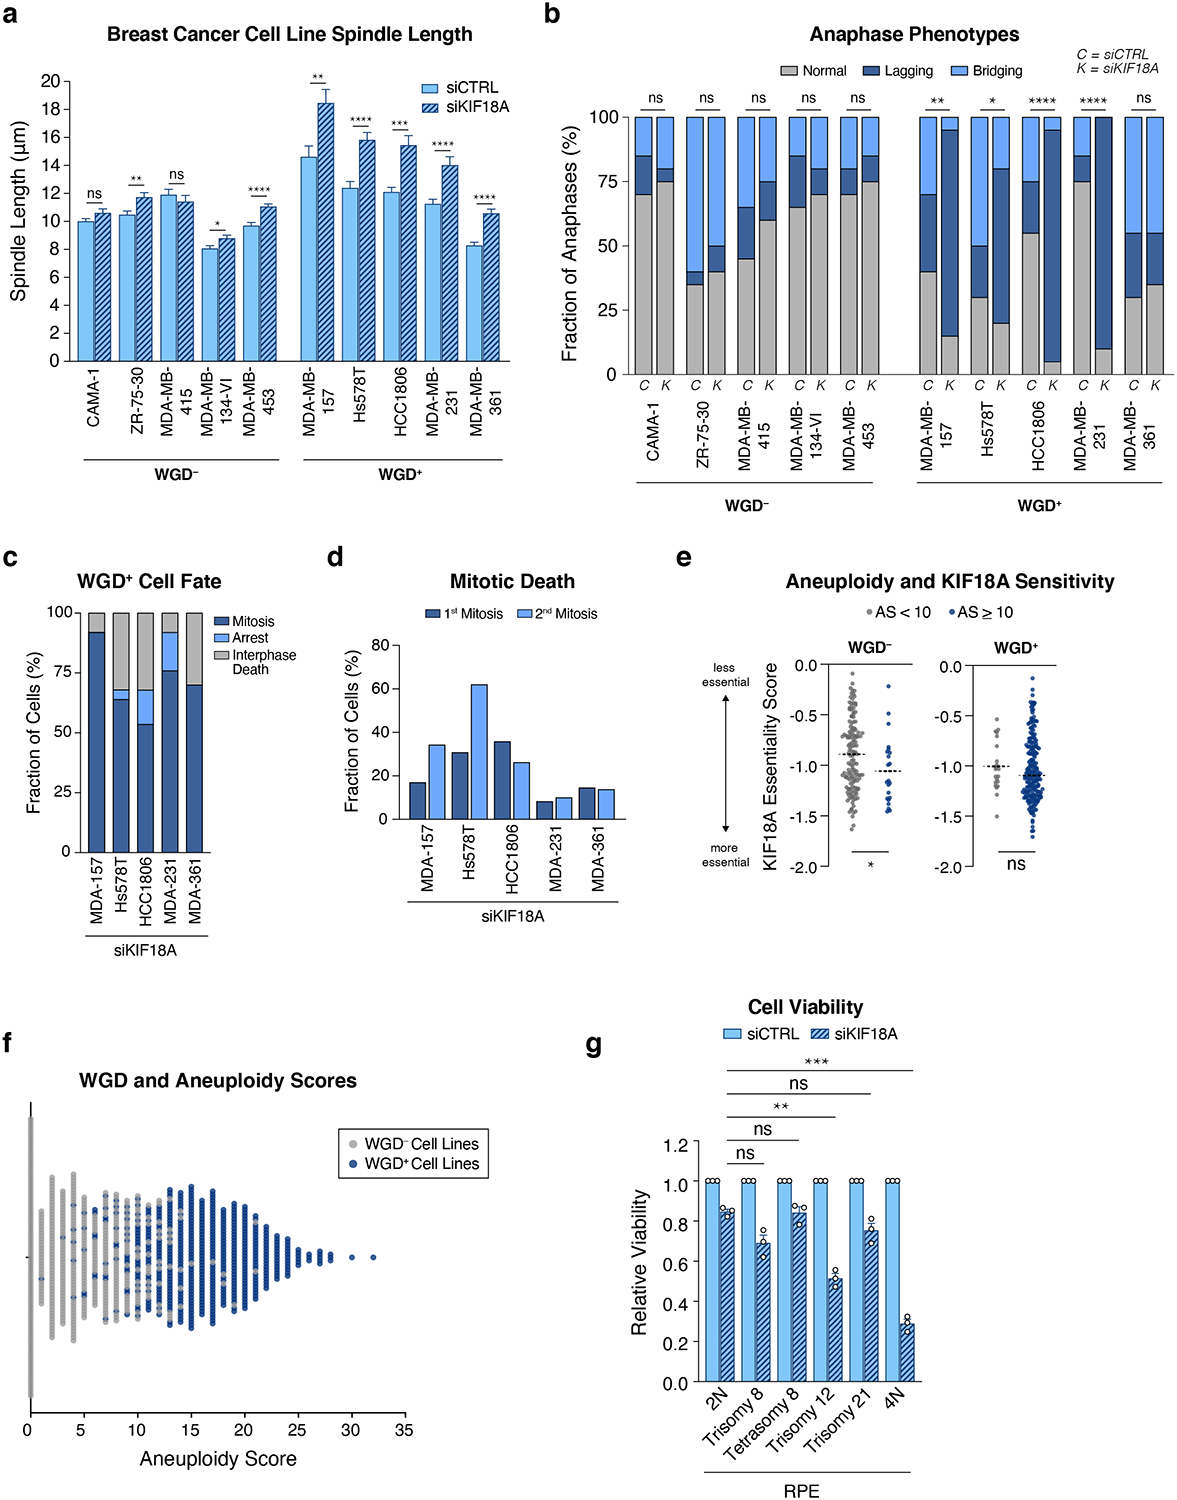
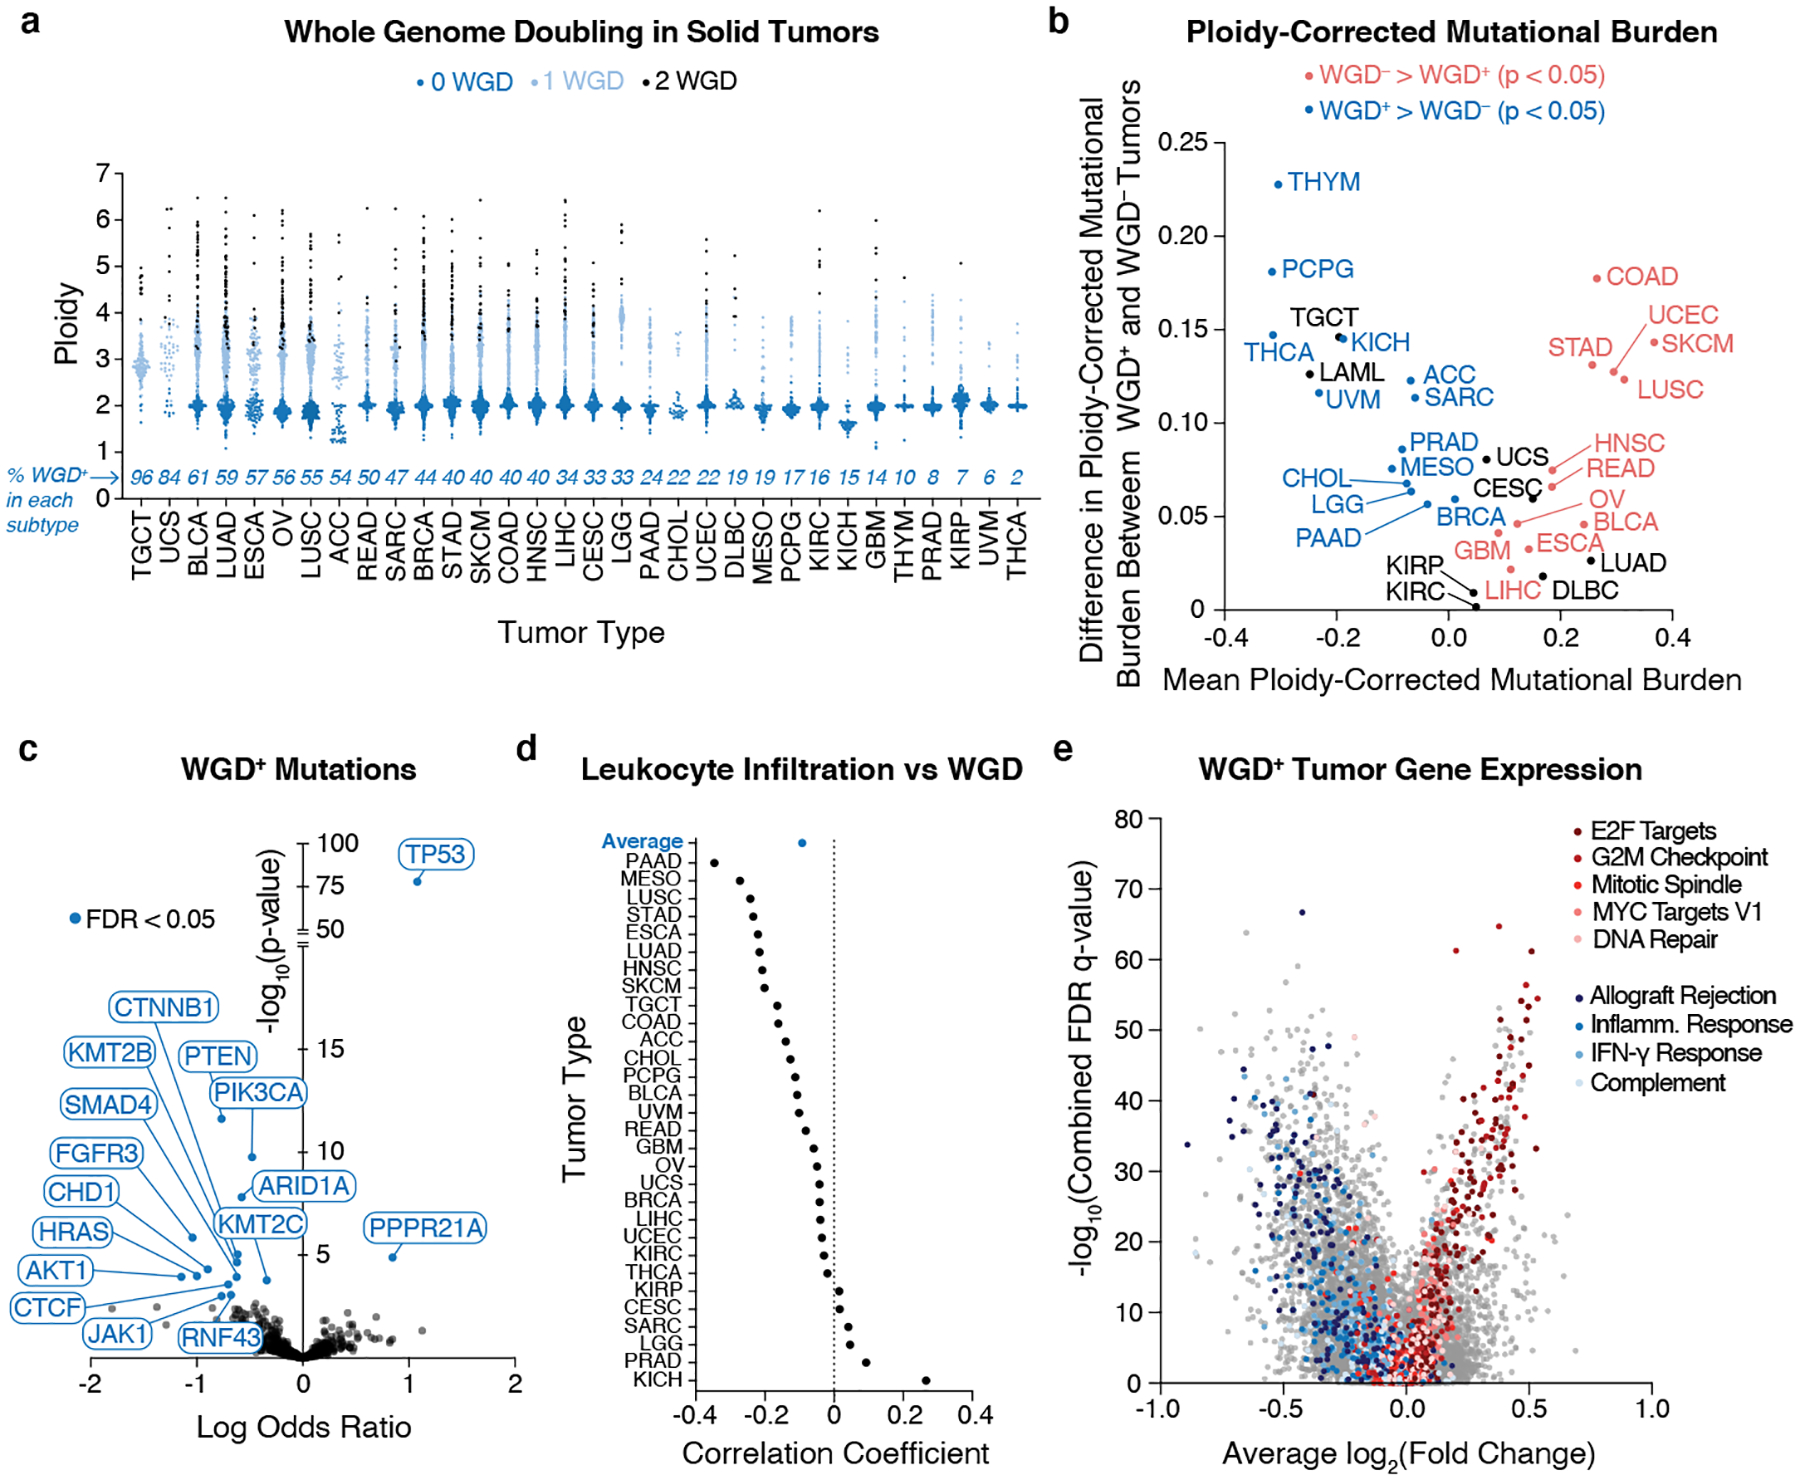
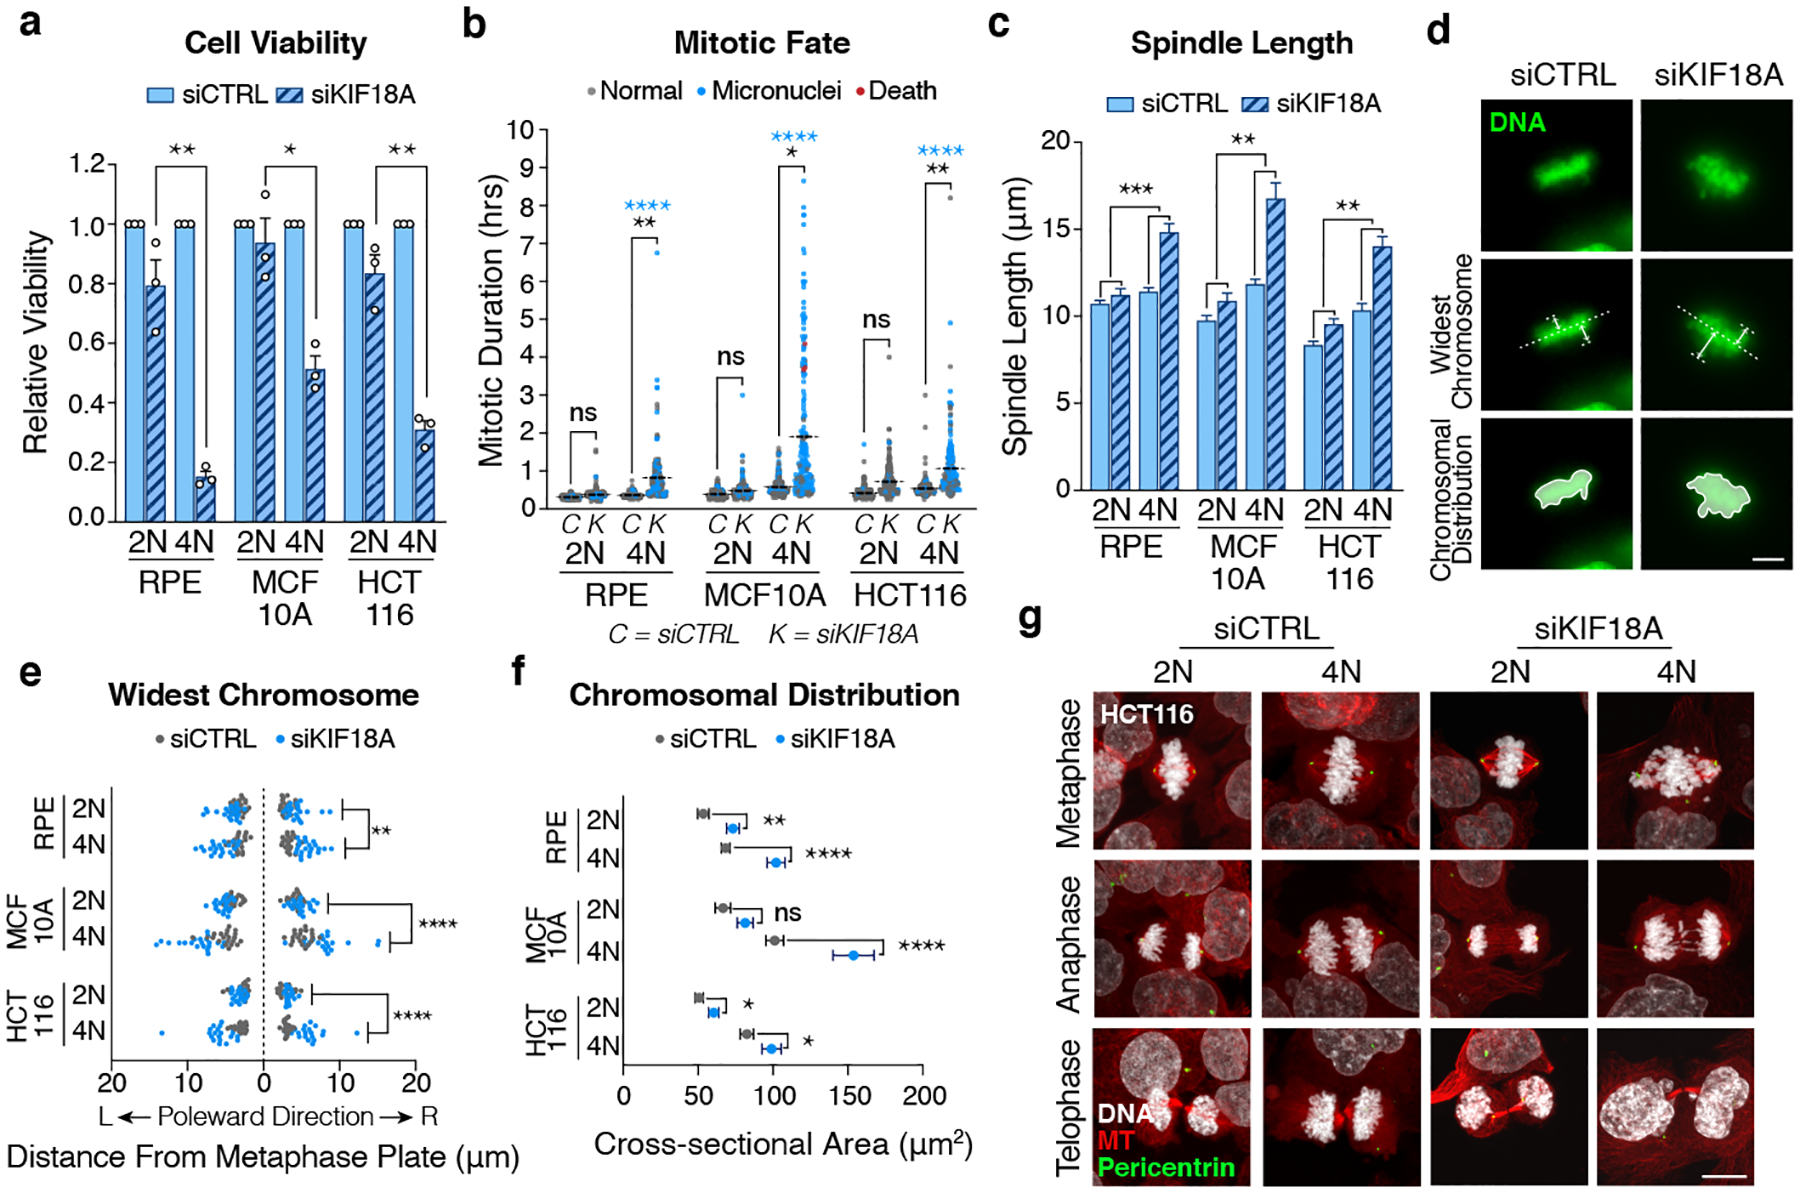
Whole-genome doubling (WGD) is common in human cancers, occurring early in tumorigenesis and generating genetically unstable tetraploid cells that fuel tumour development1,2. Cells that undergo WGD (WGD+ cells) must adapt to accommodate their abnormal tetraploid state; however, the nature of these adaptations, and whether they confer vulnerabilities that can be exploited therapeutically, is unclear. Here, using sequencing data from roughly 10,000 primary human cancer samples and essentiality data from approximately 600 cancer cell lines, we show that WGD gives rise to common genetic traits that are accompanied by unique vulnerabilities. We reveal that WGD+ cells are more dependent than WGD- cells on signalling from the spindle-assembly checkpoint, DNA-replication factors and proteasome function. We also identify KIF18A, which encodes a mitotic kinesin protein, as being specifically required for the viability of WGD+ cells. Although KIF18A is largely dispensable for accurate chromosome segregation during mitosis in WGD- cells, its loss induces notable mitotic errors in WGD+ cells, ultimately impairing cell viability. Collectively, our results suggest new strategies for specifically targeting WGD+ cancer cells while sparing the normal, non-transformed WGD- cells that comprise human tissue.


Conflict of interest statement

Declaration of Interests

The authors declare no competing interests.

Figures

Extended Data Figure 1.
Extended Data Figure 1.. Mutational burden in WGD+ and WGD tumors
(a) Total mutational burden in indicated subtypes across 9,240 TCGA samples (dotted lines show median; Wilcoxon rank-sum test – two-sided: red stars indicate higher burden in WGD samples and blue stars indicate higher burden in WGD+ samples). (b) Ploidy-corrected mutational burden in indicated subtypes across 9,240 TCGA samples (dotted lines show median; two-sided Wilcoxon rank-sum test: red stars indicate higher burden in WGD samples and blue stars indicate higher burden in WGD+ samples). (c) Ploidy-corrected mutational burden in WGD+ and WGD samples in the TCGA (n = 9,414 samples; dotted line shows mean +/− SD). (d) Ploidy-corrected mutational burden of WGD+ and WGD samples in the TCGA with MSI/POLE mutations (n = 174 samples). * p < 0.05, ** p < 0.01, *** p < 0.001, **** p < 0.0001
Extended Data Figure 2.
Extended Data Figure 2.. Characteristics of WGD+ cells
(a) Correlation of stromal cell fraction and WGD (Pearson’s correlation). (b) Correlation of purity and WGD (Pearson’s correlation). (c) Illustration of our ploidy-specific lethal (PSL) analysis using gene essentiality scores for KIF18A in the Project Achilles CRISPR dataset. Starred p-values in blue represent instances where the cutoff for enrichment in WGD+ cell lines was met in either our thresholded (two-sided Fisher’s exact) or non-thresholded (two-sided Wilcoxon) analyses (see methods). (d) Fraction of responders and non-responders to PD1 blockade by WGD status (Fisher’s exact test – two-sided; p-value = 0.0351). (e) HCT116 chromosome missegregation rate (n = 3107 2N cells, 2594 4N cells; graph shows mean +/− SD). (f) DNA FACS profile of diploid and tetraploid HCT116 cells at 40 and 70 days of culture. (g) Karyotype of diploid and tetraploid HCT-116 cells with modal chromosome number and range (n = 20 karyotypes analyzed per condition). (h) Previously published data demonstrating the stability of isogenic diploid and tetraploid RPE and MCF10A cell lines. * p < 0.05, ** p < 0.01, *** p < 0.001, **** p < 0.0001
Extended Data Figure 3.
Extended Data Figure 3.. Validation of WGD+ vulnerabilities in isogenic 2N/4N cells
(a) Mitotic duration of indicated cells following indicated treatments (n = 200 cells; Student’s unpaired t-test – two-sided; graph shows mean +/− SEM; p-values = <0.0001, <0.0001, 0.0265, respectively). (b) The fraction of mitoses that generate micronuclei following indicated treatments (n = 200 cells; Student’s unpaired t-test – two-sided; p-values = <0.0001, <0.0001, <0.0001, <0.0001, 0.0002, <0.0001, respectively). (c) Relative viability of 2N and 4N HCT116 cells 7 days after treatment with indicated siRNA at indicated concentrations with Western blot showing protein knockdown 48 hours after treatment with siRNA (n = 3 independent experiments; graph shows mean +/− SEM at each dose; for gel source see Supplementary Figure 1). (d) Relative viability of 2N and 4N MCF10A cells 7 days after treatment with indicated siRNA at 50 pM concentration (n =3 independent experiments; Student’s unpaired t-test – one-sided; graph shows mean +/− SEM; p-values = <0.0001, <0.0001). (e) Relative viability of 2N and 4N RPE cells 5 days after treatment with indicated siRNA at 50 pM concentration (n = 3 independent experiments; Student’s unpaired t-test – one-sided; graph shows mean +/− SEM; p-values = 0.090, 0.0007, respectively). (f) Representative Western blot showing knockdown of indicated proteins 48 hours after treatment with indicated siRNA (n = 3 independent experiments; for gel source see Supplementary Figure 1). * p < 0.05, ** p < 0.01, *** p < 0.001, **** p < 0.0001
Extended Data Figure 4.
Extended Data Figure 4.. Validation of WGD+ vulnerabilities in breast cancer cells
(a-b) Dose-response to indicated treatment after 7 days in indicated cell lines with accompanying LC50 (n = 3 independent experiments; nonlinear regression with variable slope; graphs show mean relative viability +/− SEM at each dose and mean LC50 +/− 95% CI). (c-e) Dose-response curves for 5 WGD and 5 WGD+ breast cancer cell lines 7 days after indicated drug treatment at the indicated concentrations (n = 3 independent experiments; nonlinear regression with variable slope; graph shows mean +/− SEM at each dose). (f) Representative Western blot showing knockdown of indicated proteins in breast cancer cell lines 48 hours after treatment with indicated siRNA (n = 3 independent experiments; for gel source see Supplementary Figure 1). (g) Relative viability decrease in WGD+ and WGD breast cancer cell lines 7 days after treatment with indicated siRNA (Wilcoxon rank-sum test – two-sided; graph shows mean +/− SEM; p-values = <0.0001, 0.0027, respectively) * p < 0.05, ** p < 0.01, *** p < 0.001, **** p < 0.0001
Extended Data Figure 5.
Extended Data Figure 5.. Mitotic fidelity in WGD+ cells following KIF18A depletion
(a) Dose-response to MG132 treatment after 7 days in indicated cell lines with accompanying LC50 (n = 3 independent experiments; nonlinear regression with variable slope; graphs show mean relative viability +/− SEM at each dose and mean LC50 +/− 95% CI). (b) Progression free survival and overall survival in patients with upper tertile tumor expression of KIF18A in the TCGA (Cox proportional-hazards regression; graph shows hazard ratios +/− 95% CI). (c) Representative Western blot showing KIF18A levels following transfection with the indicated siRNAs in the indicated cell lines (n = 3 independent experiments; for gel source see Supplementary Figure 1). (d) Anaphase phenotypes following depletion of KIF18A (n = 20 cells per condition; stars indicate p-value for two-sided Fisher’s exact test comparing the fraction of anaphases with lagging chromosomes; p-values = <0.0001, 0.0033, 0.0187, respectively). (e) Representative confocal images showing phases of mitosis in indicated cell lines 48 hours after transfection with indicated siRNA (representative images from 2 independent experiments; scale bar 10 μm). (f) Representative still images from 2N and 4N MCF10A cells progressing through mitosis after transfection with the indicated siRNAs. H2B-GFP labeled chromosomes are shown in white. Arrows in enlarged images show oscillating chromosomes during metaphase and the generation of a micronucleus (hrs: min; scale bar 10 μm) * p < 0.05, ** p < 0.01, *** p < 0.001, **** p < 0.0001
Extended Data Figure 6.
Extended Data Figure 6.. Cell fate analysis in WGD+ cells following KIF18A depletion
(a) Representative image of a 4N MCF10A cell 4 days after transfection with siKIF18A and stained for cGAS. Graph shows the fraction of micronuclei in 2N and 4N MCF10A cells with indicated treatment that stained positive for cGAS (n = 200 micronuclei per condition; Fisher’s exact test – two-sided; scale bar 10 μm; p-values = <0.0001, 0.0069, respectively). (b-c) Representative confocal images of indicated cell lines 48 hours after transfection with indicated siRNA. Arrows highlight MAD1 positive kinetochores in misaligned chromosomes (scale bar 10 μm; representative images from 2 independent experiments). (d) Representative Western blot of indicated protein levels after treatment with indicated siRNA and accompanying graphs showing relative protein levels normalized to loading control (n = 3 independent experiments; Student’s unpaired t-test – one-sided; graph shows mean +/− SEM; p-values = 0.0337, 0.0030, 0.0674, 0.0421, 0.0067, 0.0227, respectively; for gel source see Supplementary Figure 1). (e) Cell fates of indicated cell lines tracked for 3 days beginning 18 hours after transfection with indicated siRNA (n = 40 cells per condition; two-sided Fisher’s exact test comparing fraction of cells arresting/delaying in interphase relative to control group; p values = 0.0016, <0.0001, <0.0001, respectively). (f) Relative viability of indicated cell lines 4 days after transfection with the indicated siRNA (n = 3 independent experiments; Student’s unpaired t-test – two-sided; graph shows mean +/− SEM; p-values = 0.0132, 0.0310, 0.8808, 0.8615, respectively). * p < 0.05, ** p < 0.01, *** p < 0.001, **** p < 0.0001
Extended Data Figure 7.
Extended Data Figure 7.. Ploidy-specific lethal effect of KIF18A depletion
(a) Western blot showing endogenous KIF18A levels in indicated cell lines with graph showing respective protein levels normalized to GAPDH loading control (representative blot from 3 independent experiments; for gel source see Supplementary Figure 1). (b) Representative Western blot showing KIF18A levels 48 hours after transfection with indicated siRNA (n = 3 independent experiments; for gel source see Supplementary Figure 1). (c) Relative viability decrease in WGD+ and WGD breast cancer cell lines 7 days after treatment with indicated siRNA (n = 3 independent experiments; Wilcoxon rank-sum test – two-sided; graph shows mean +/− SEM; p-value < 0.0001). (d) Relative viability 7 days after induction of Cas9 in cells with sgRNA targeting KIF18A with Western blot showing protein depletion 72 hours after induction (n = 3 independent experiments; graph shows mean +/− SEM; Student’s unpaired t-test – two-sided; p-values = 0.0007, < 0.0001, respectively; for gel source see Supplementary Figure 1). (e) Relative viability 7 days after induction of shRNA targeting KIF18A with Western blot showing protein depletion 120 hours after induction (n = 3 independent experiments; graph shows mean +/− SEM; Student’s unpaired t-test – one-sided; p-value < 0.0001; for gel source see Supplementary Figure 1). (f) Widest oscillating chromosome in each poleward direction immediately prior to anaphase (n = 20 cells per condition; Student’s unpaired t-test – two-sided; p-values = 0.0022, 0.1781, 0.1487, 0.0136, 0.0820, <0.0001, <0.0001, <0.0001, <0.0001, 0.4132, respectively). (g) Two-dimensional cross-sectional area of the entire body of chromosomes immediately prior to anaphase (n = 20 cells per condition; Student’s unpaired t-test – two-sided; p-values = 0.1178, 0.7545, 0.1440, 0.0034, 0.9989, 0.0005, 0.0033, 0.0012, 0.0110, 0.9089, respectively; graph shows mean +/− SEM). * p < 0.05, ** p < 0.01, *** p < 0.001, **** p < 0.0001
Extended Data Figure 8.
Extended Data Figure 8.. Effects of KIF18 depletion in aneuploid cells
(a) Measurement of spindle length (centrosome-to-centrosome) after transfection with indicated siRNA (n = 20 cells per condition; Student’s unpaired t-test – two-sided; graph shows mean +/− SEM). (b) Anaphase phenotypes following depletion of KIF18A (n = 20 cells per condition; stars indicate p-value for two-sided Fisher’s exact test comparing the fraction of anaphases with lagging chromosomes). (c) The fraction of cells in each cell line that undergo indicated fates after completing a mitosis deficient of KIF18A that resulted in micronuclei formation (n = 25 cells per condition). (d) The fraction of cells in each cell line that experience mitotic death in their first and second mitoses following KIF18A depletion (n = 25 cells per condition). (e) KIF18A essentiality scores for WGD and WGD+ cell lines segregated into “highly aneuploid” (AS > 10) and “non-highly aneuploid” categories based on aneuploidy score (AS) (see methods) (dotted lines show mean; Wilcoxon rank-sum test – two-sided; p-values = 0.02583, 0.3682, respectively). (f) Aneuploidy scores and WGD status for 998 cancer cell lines in the CCLE. (g) Relative viability of indicated cell lines 7 days after transfection with the indicated siRNAs (n = 3 independent experiments; each condition normalized to respective control; one-way ANOVA with Dunnett’s post hoc test; graph shows mean +/− SEM; p-values = 0.1676, > 0.9999, 0.0040, 0.2698, 0.0007, respectively). * p < 0.05, ** p < 0.01, *** p < 0.001, **** p < 0.0001
Figure 1.
Figure 1.. Genetic analysis of WGD+ tumors
(a) Quantification of WGD status and total ploidy of 9,700 primary human tumor samples from the TCGA using ABSOLUTE. (b) Mean ploidy-corrected mutational burden in indicated subtypes plotted against the difference in the ploidy-corrected mutational burden between WGD+ and WGD tumors within each subtype (Wilcoxon rank-sum test – two sided). (c) Enrichment of mutations in WGD+ tumors (log odds ratio generated by logistic regression corrected for mutation burden and tumor type). (d) Correlation of leukocyte infiltration and WGD (Pearson’s correlation). (e) Gene expression fold changes in WGD+ tumors relative to WGD tumors plotted against combined FDR values across all tumor types with genes from the most significantly enriched gene sets highlighted.
Figure 2.
Figure 2.. Identification and validation of PSL genes
(a) Workflow used to identify gene essentiality in WGD+ cancer cells from Project Achilles data (see methods). (b) Top hits from PSL analysis (text color indicates genes associated with indicated pathways). (c) Gene expression fold changes in WGD+ tumors relative to WGD tumors plotted against combined FDR values across all tumor types with select PSL genes highlighted. (d) Population doublings after 8 days of AZ3146 treatment (n = 3 independent experiments; two-way ANOVA with interaction; graph shows mean +/− SEM; interaction p-values = 0.0085, 0.0020, 0.0156, respectively). (e) Relative viability of indicated cell lines 7 days after treatment with indicated siRNA (n = 3 independent experiments; graph shows mean +/− SEM). (f) Mean LC50 for 5 WGD and 5 WGD+ breast cancer cell lines for indicated drug treatments (n = 3 independent experiments; nonlinear regression; graphs show mean LC50 +/− 95% CI). * p < 0.05, ** p < 0.01, *** p < 0.001, **** p < 0.0001
Figure 3.
Figure 3.. KIF18A depletion impairs the mitotic fidelity of WGD+ cells
(a) Relative viability of indicated cell lines 8 days after transfection with the indicated siRNAs (n = 3 independent experiments; each condition normalized to respective control; Student’s unpaired t-test – two-sided; graph shows mean +/− SEM; p-values = 0.0019, 0.0109, 0.0017, respectively). (b) Mitotic duration and fate after treatment with indicated siRNA (n = 200 cells per condition; black stars indicate p-value for two-sided Student’s t-test comparing mean mitotic duration; blue stars indicate p-value for two-sided Fisher’s exact test comparing the fraction of mitoses that give rise to micronuclei; dotted line represents mean mitotic duration). (c) Measurement of spindle length (centrosome-to-centrosome) after transfection with indicated siRNA (n = 20 cells per condition; two-way ANOVA with interaction; graph shows mean +/− SEM; scale bar 10 μm; interaction p-values = 0.0001, 0.0011, 0.0032, respectively). (d) Image demonstrating measurement of chromosome oscillations immediately prior to anaphase by assessing the widest oscillating chromosomes in each poleward direction and the cross-sectional area of all the chromosomes (scale bar 10 μm). (e) Widest oscillating chromosome in each poleward direction immediately prior to anaphase (n = 20 cells per condition from 2 independent experiments; two-way ANOVA with interaction; interaction p-values = 0.0025, <0.0001, <0.0001, respectively). (f) Two-dimensional cross-sectional area of the entire body of chromosomes immediately prior to anaphase (n = 20 cells per condition; Student’s unpaired t-test – two-sided; graph shows mean +/− SEM; p-values = 0.0012, <0.0001, 0.0525, 0.0318, <0.0001, 0.0318, 0.0432, respectively). (g) Representative confocal images showing phases of mitosis in indicated cell lines 48 hours after transfection with indicated siRNA (scale bar 10 μm). * p < 0.05, ** p < 0.01, *** p < 0.001, **** p < 0.0001
Figure 4.
Figure 4.. WGD confers dependence on KIF18A in a panel of breast cancer cell lines
(a) Relative viability of cell lines 8 days after transfection with the indicated siRNAs (n = 3 independent experiments; graph shows mean +/− SEM). (b) Mitotic duration and fate following transfection with indicated siRNA (n = 80 cells per condition across 2 independent experiments; dotted line represents mean mitotic duration; black stars indicate p-values for two-sided Student’s unpaired t-test comparing mean mitotic duration; blue stars indicate p-values for two-sided Fisher’s exact test comparing fraction of mitoses that give rise to micronuclei; red stars indicate p-values for two-sided Fisher’s exact test comparing fraction of cell that die in mitosis). (c) Depletion of KIF18A impairs WGD+ cell viability through two distinct mechanisms: A) Widely oscillating chromosomes fail to properly attach to microtubules, thus activating the spindle assembly checkpoint and leading to prolonged mitosis and death. B) Larger spindles and wider oscillations increase the distance some chromosomes must traverse in anaphase leading to lagging chromosomes, micronuclei formation, and cellular arrest. * p < 0.05, ** p < 0.01, *** p < 0.001, **** p < 0.0001

References

    1. Lens SMA & Medema RH Cytokinesis defects and cancer. Nature Reviews Cancer 19, 32–45, doi:10.1038/s41568-018-0084-6 (2019). - DOI - PubMed
    1. Fujiwara T et al. Cytokinesis failure generating tetraploids promotes tumorigenesis in p53-null cells. Nature 437, 1043, doi:10.1038/nature04217 (2005). - DOI - PubMed
    1. Ganem NJ, Godinho SA & Pellman D A mechanism linking extra centrosomes to chromosomal instability. Nature 460, 278, doi:10.1038/nature08136 (2009). - DOI - PMC - PubMed
    1. Thompson DA, Desai MM & Murray AW Ploidy Controls the Success of Mutators and Nature of Mutations during Budding Yeast Evolution. Current Biology 16, 1581–1590, doi:10.1016/j.cub.2006.06.070 (2006). - DOI - PubMed
    1. Dewhurst SM et al. Tolerance of Whole-Genome Doubling Propagates Chromosomal Instability and Accelerates Cancer Genome Evolution. Cancer Discovery 4, 175, doi:10.1158/2159-8290.CD-13-0285 (2014). - DOI - PMC - PubMed

Publication types

MeSH terms