. 2021 Feb;590(7846):486-491.
doi: 10.1038/s41586-020-03114-6. Epub 2021 Jan 27.

Aneuploidy renders cancer cells vulnerable to mitotic checkpoint inhibition

Affiliations

Aneuploidy renders cancer cells vulnerable to mitotic checkpoint inhibition

Yael Cohen-Sharir et al. Nature. 2021 Feb.

Abstract

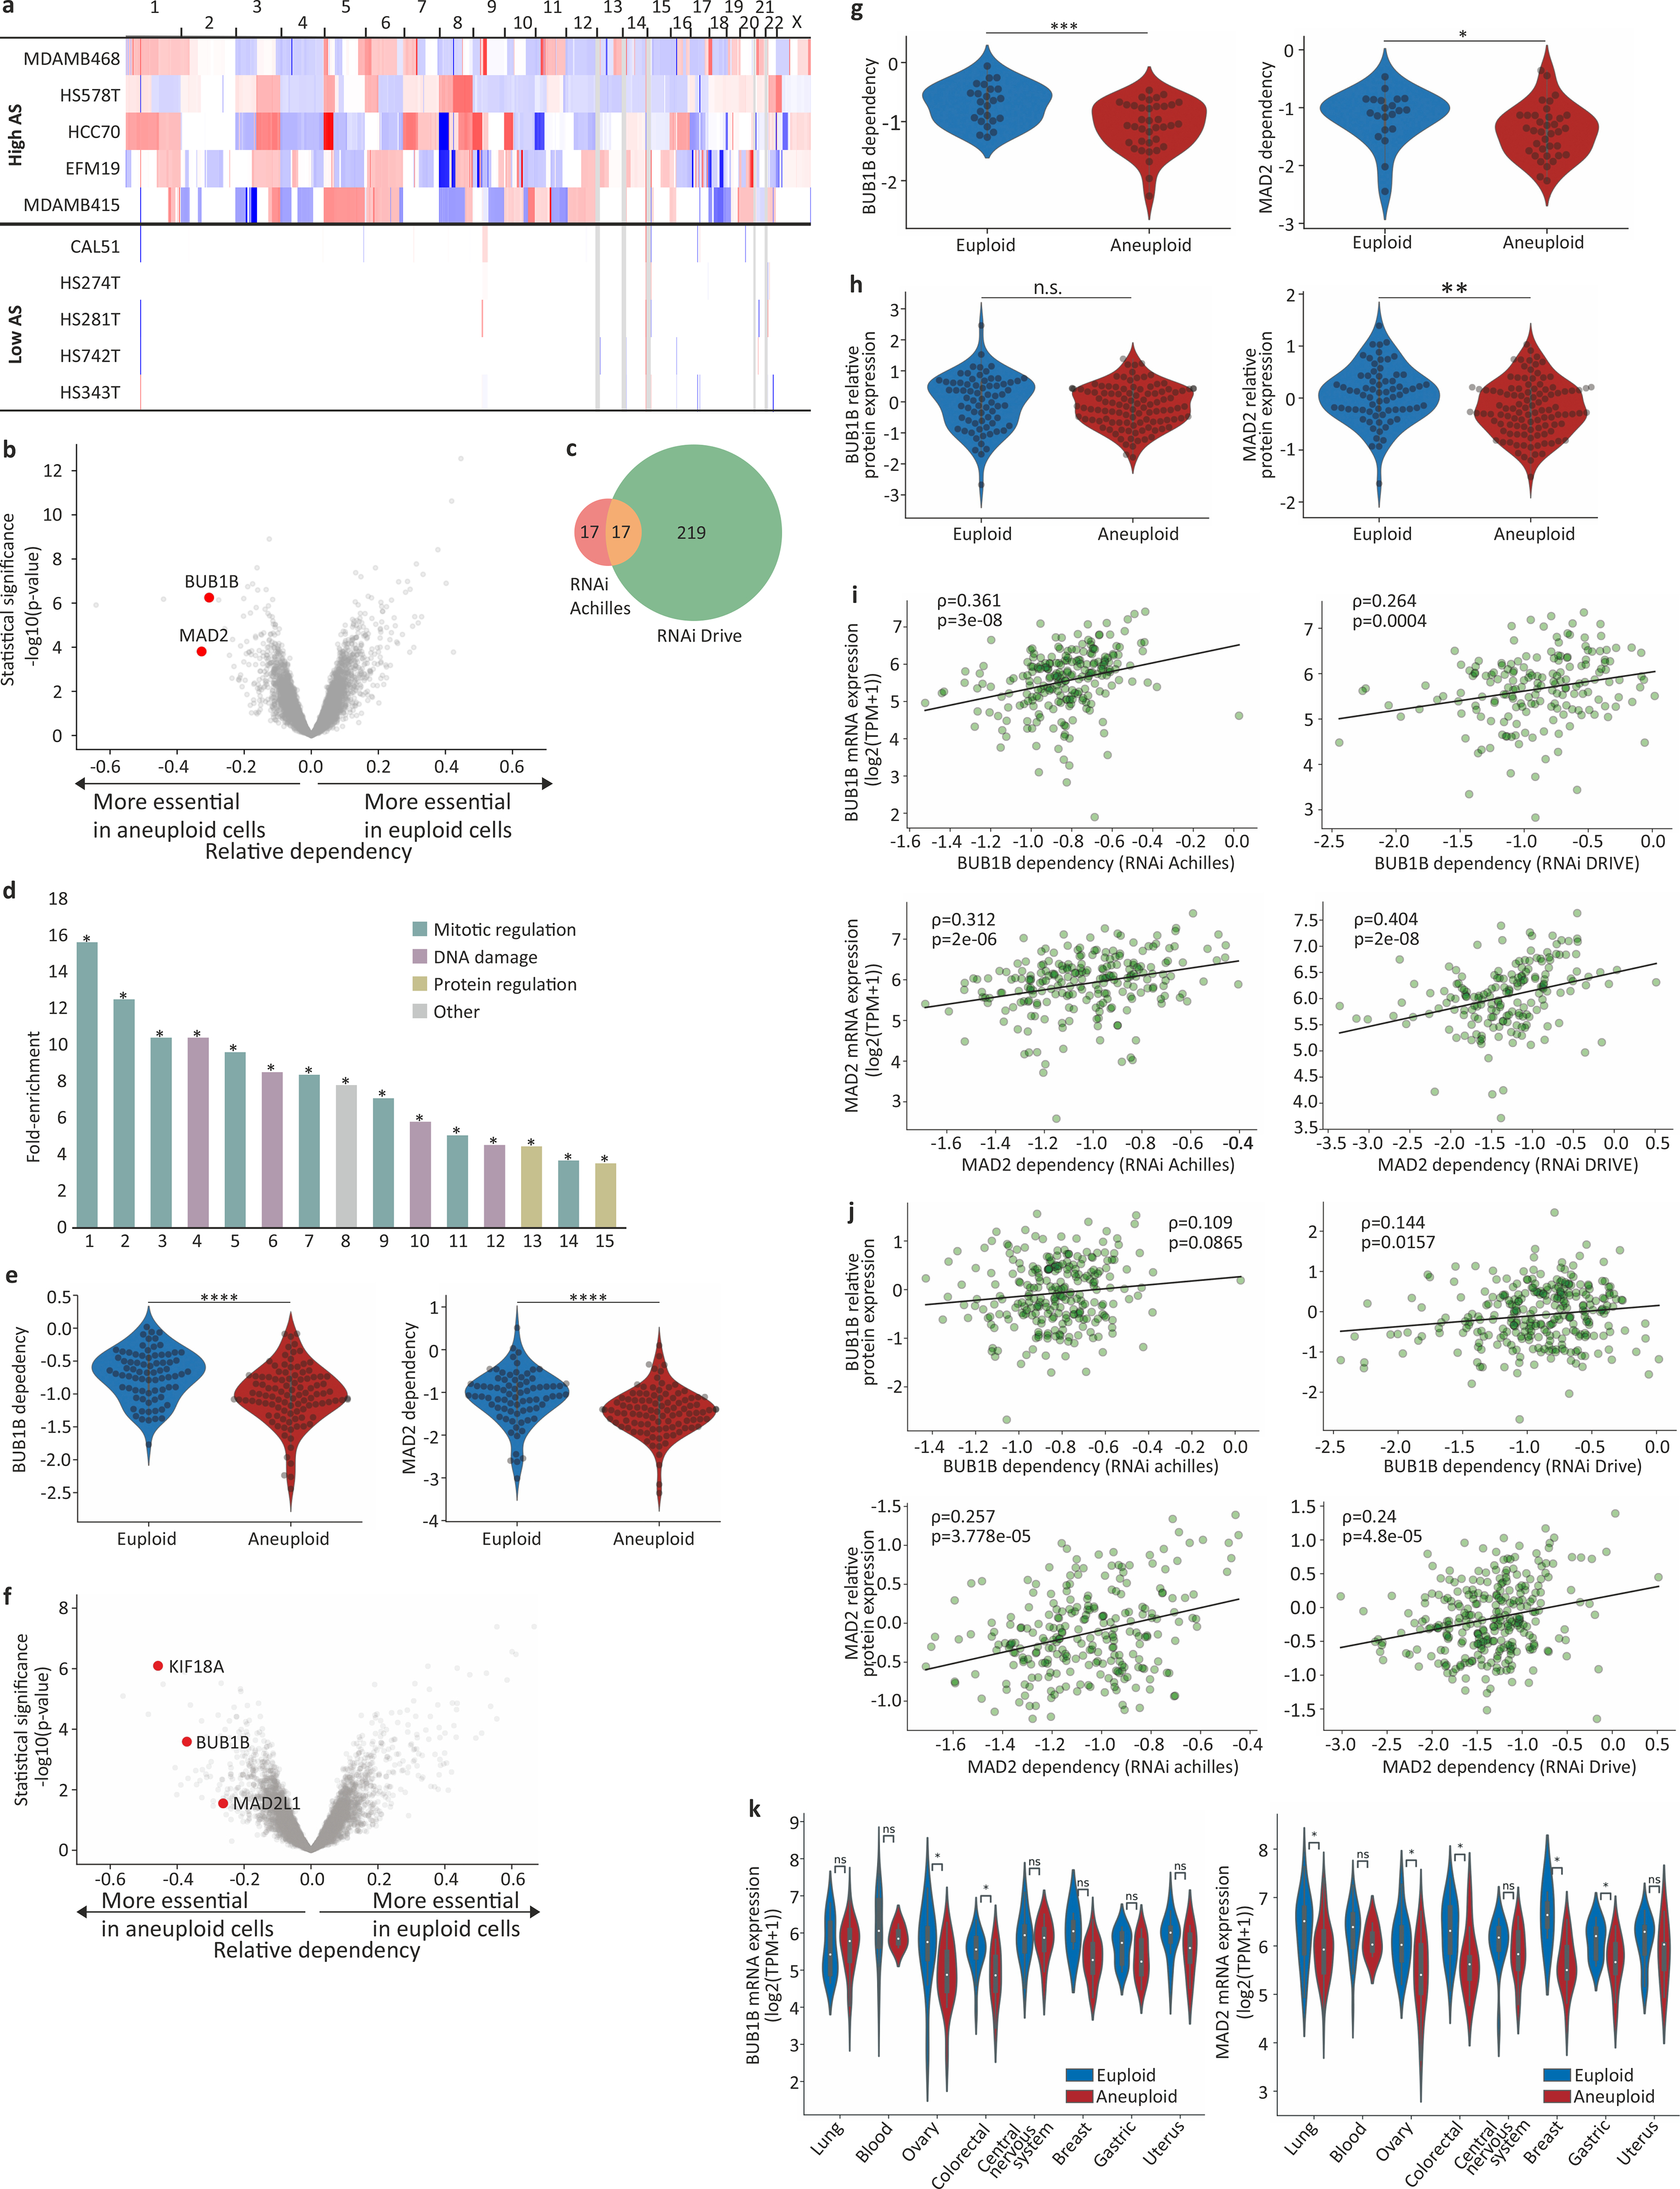
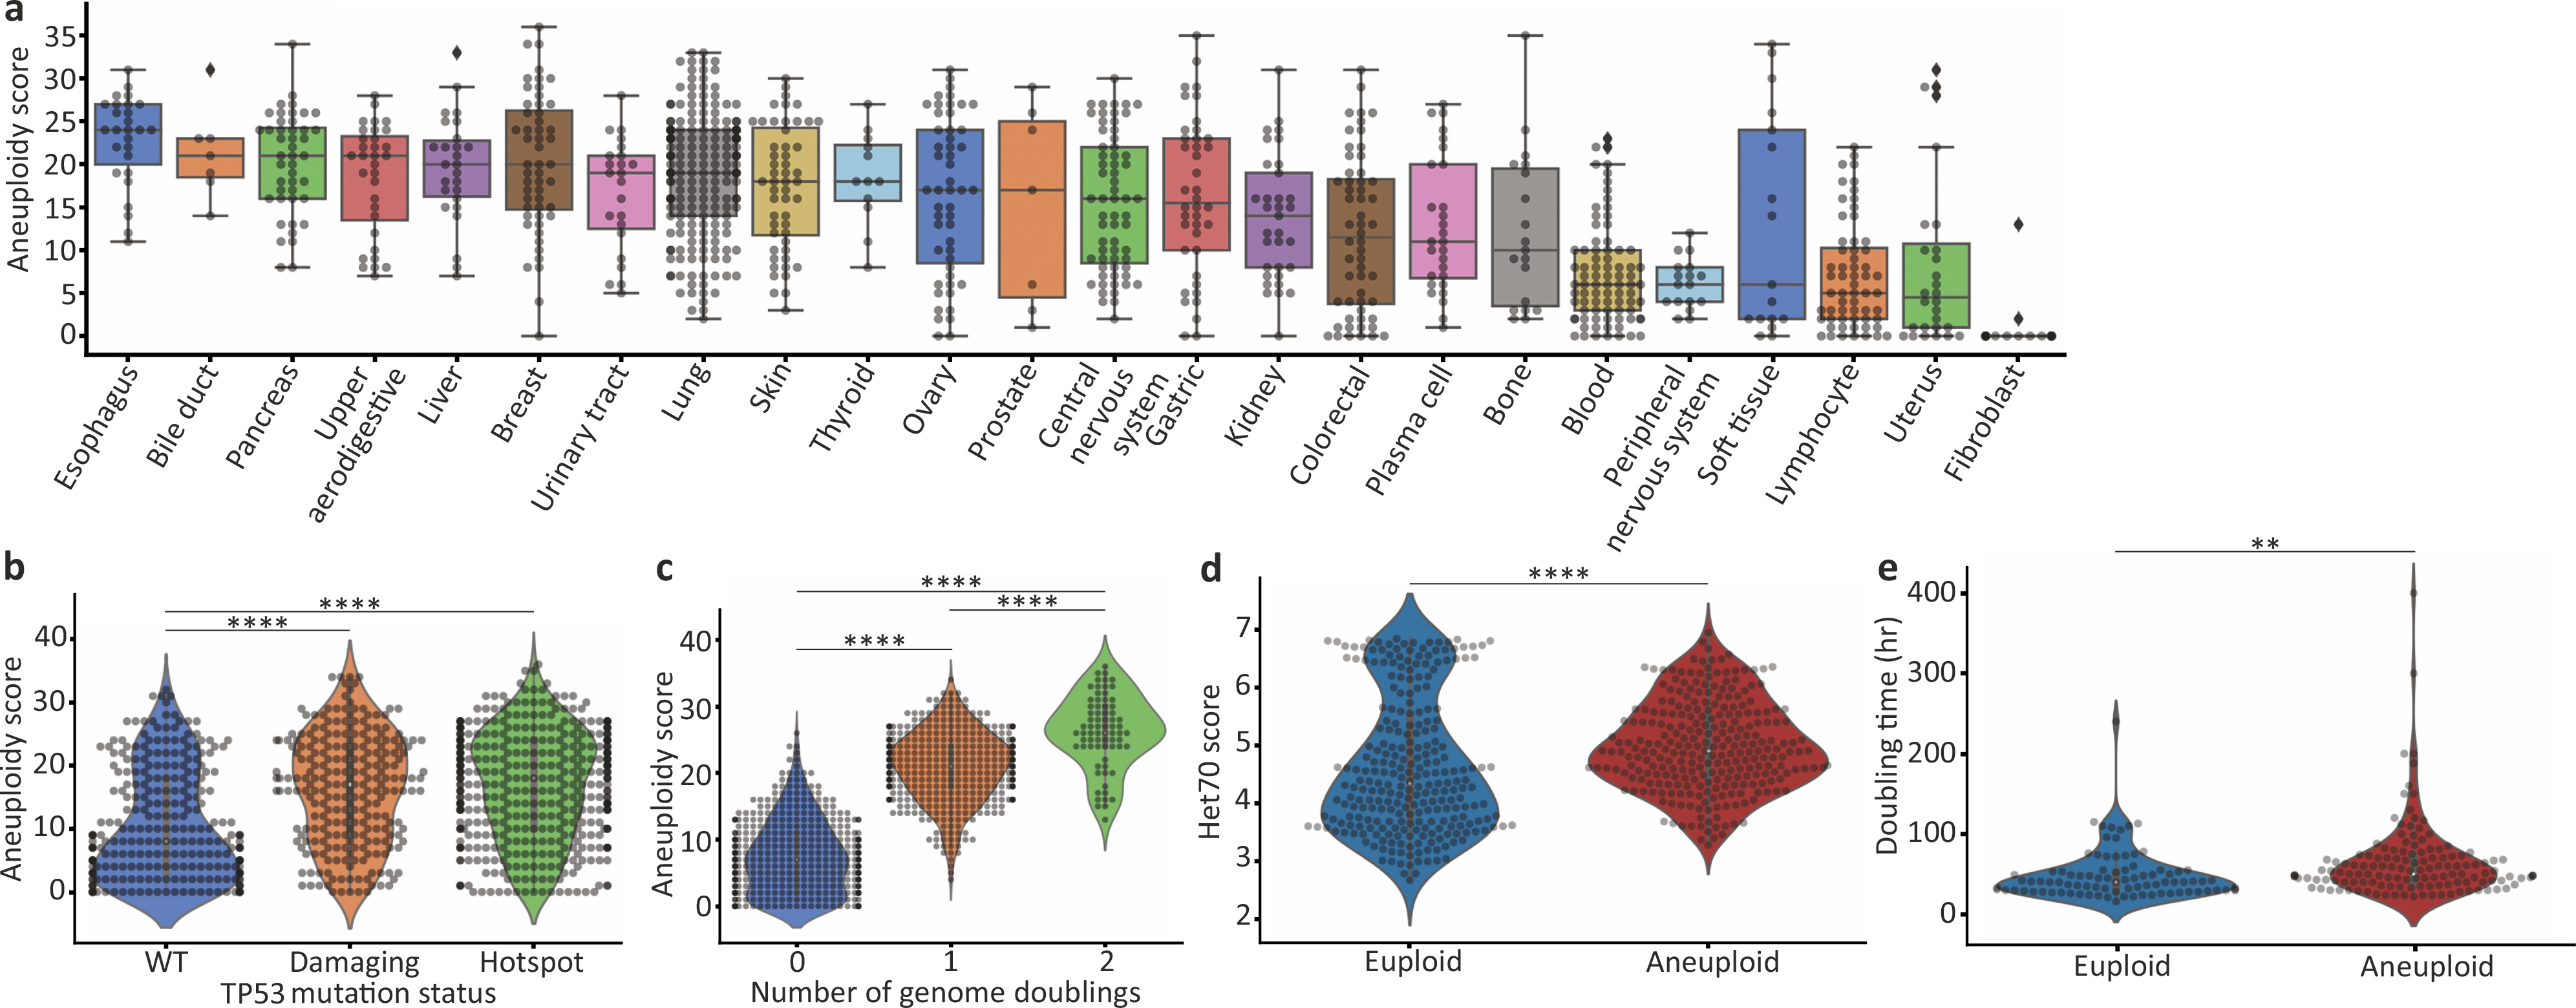
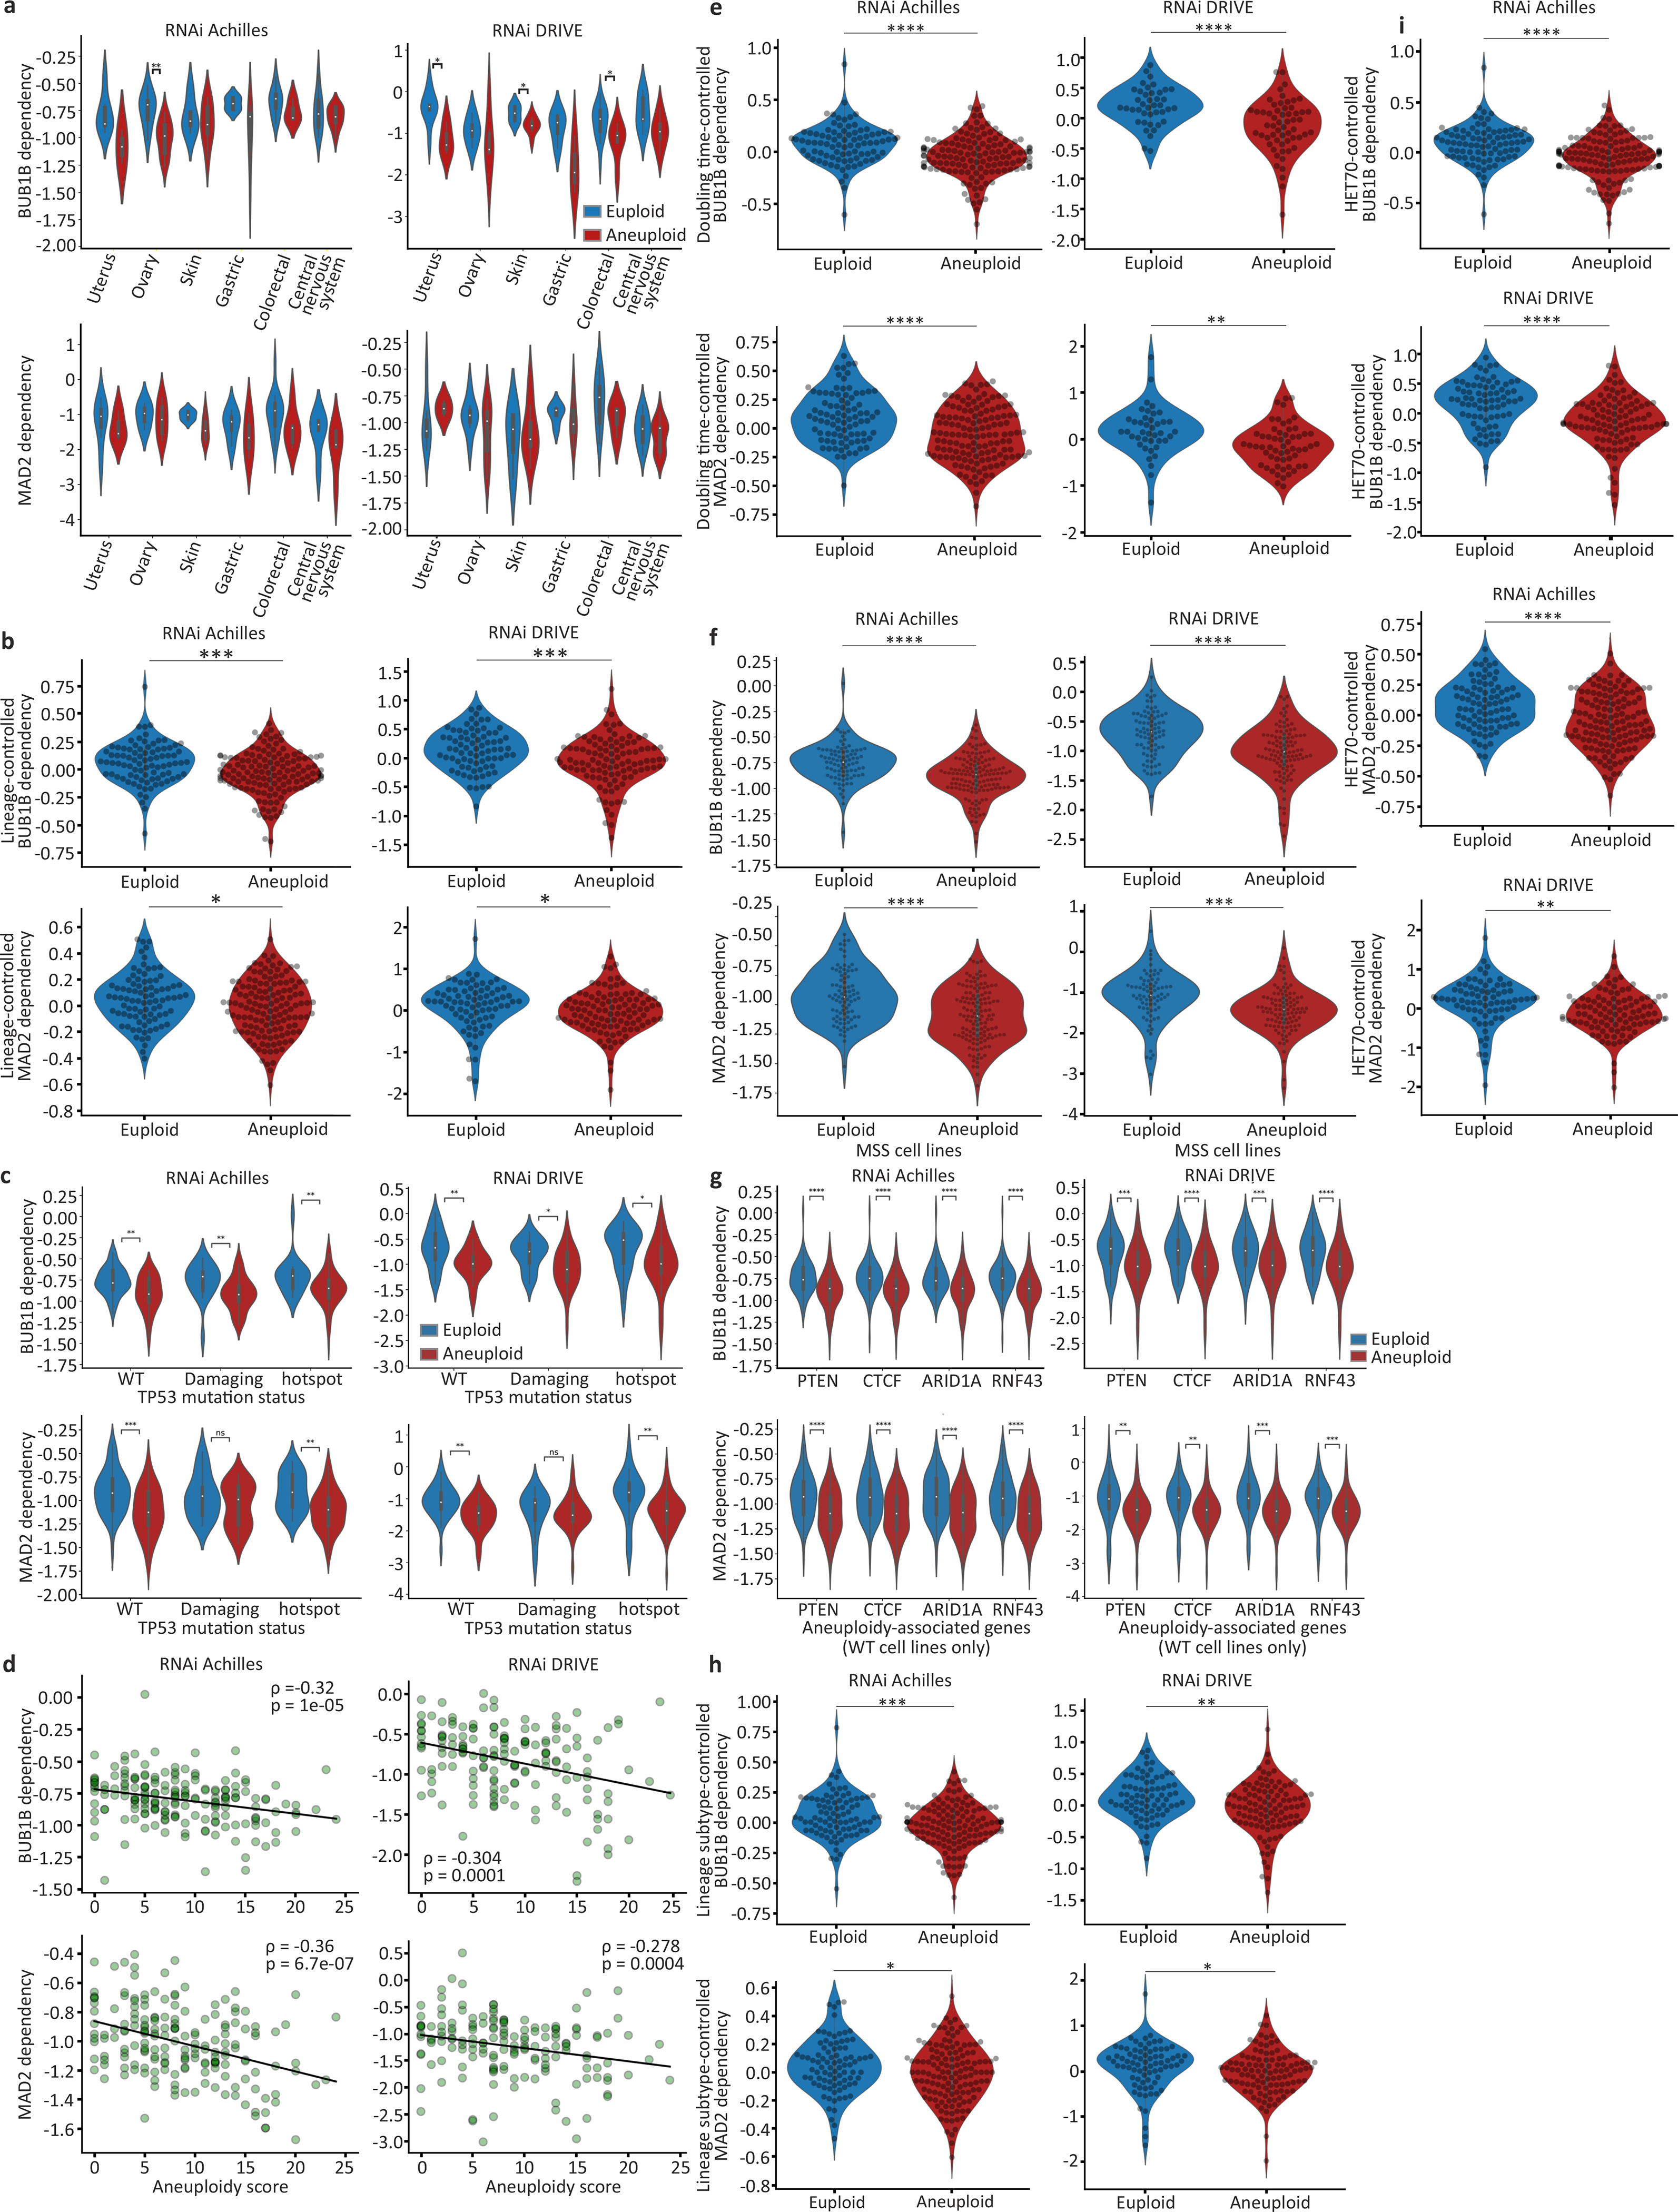
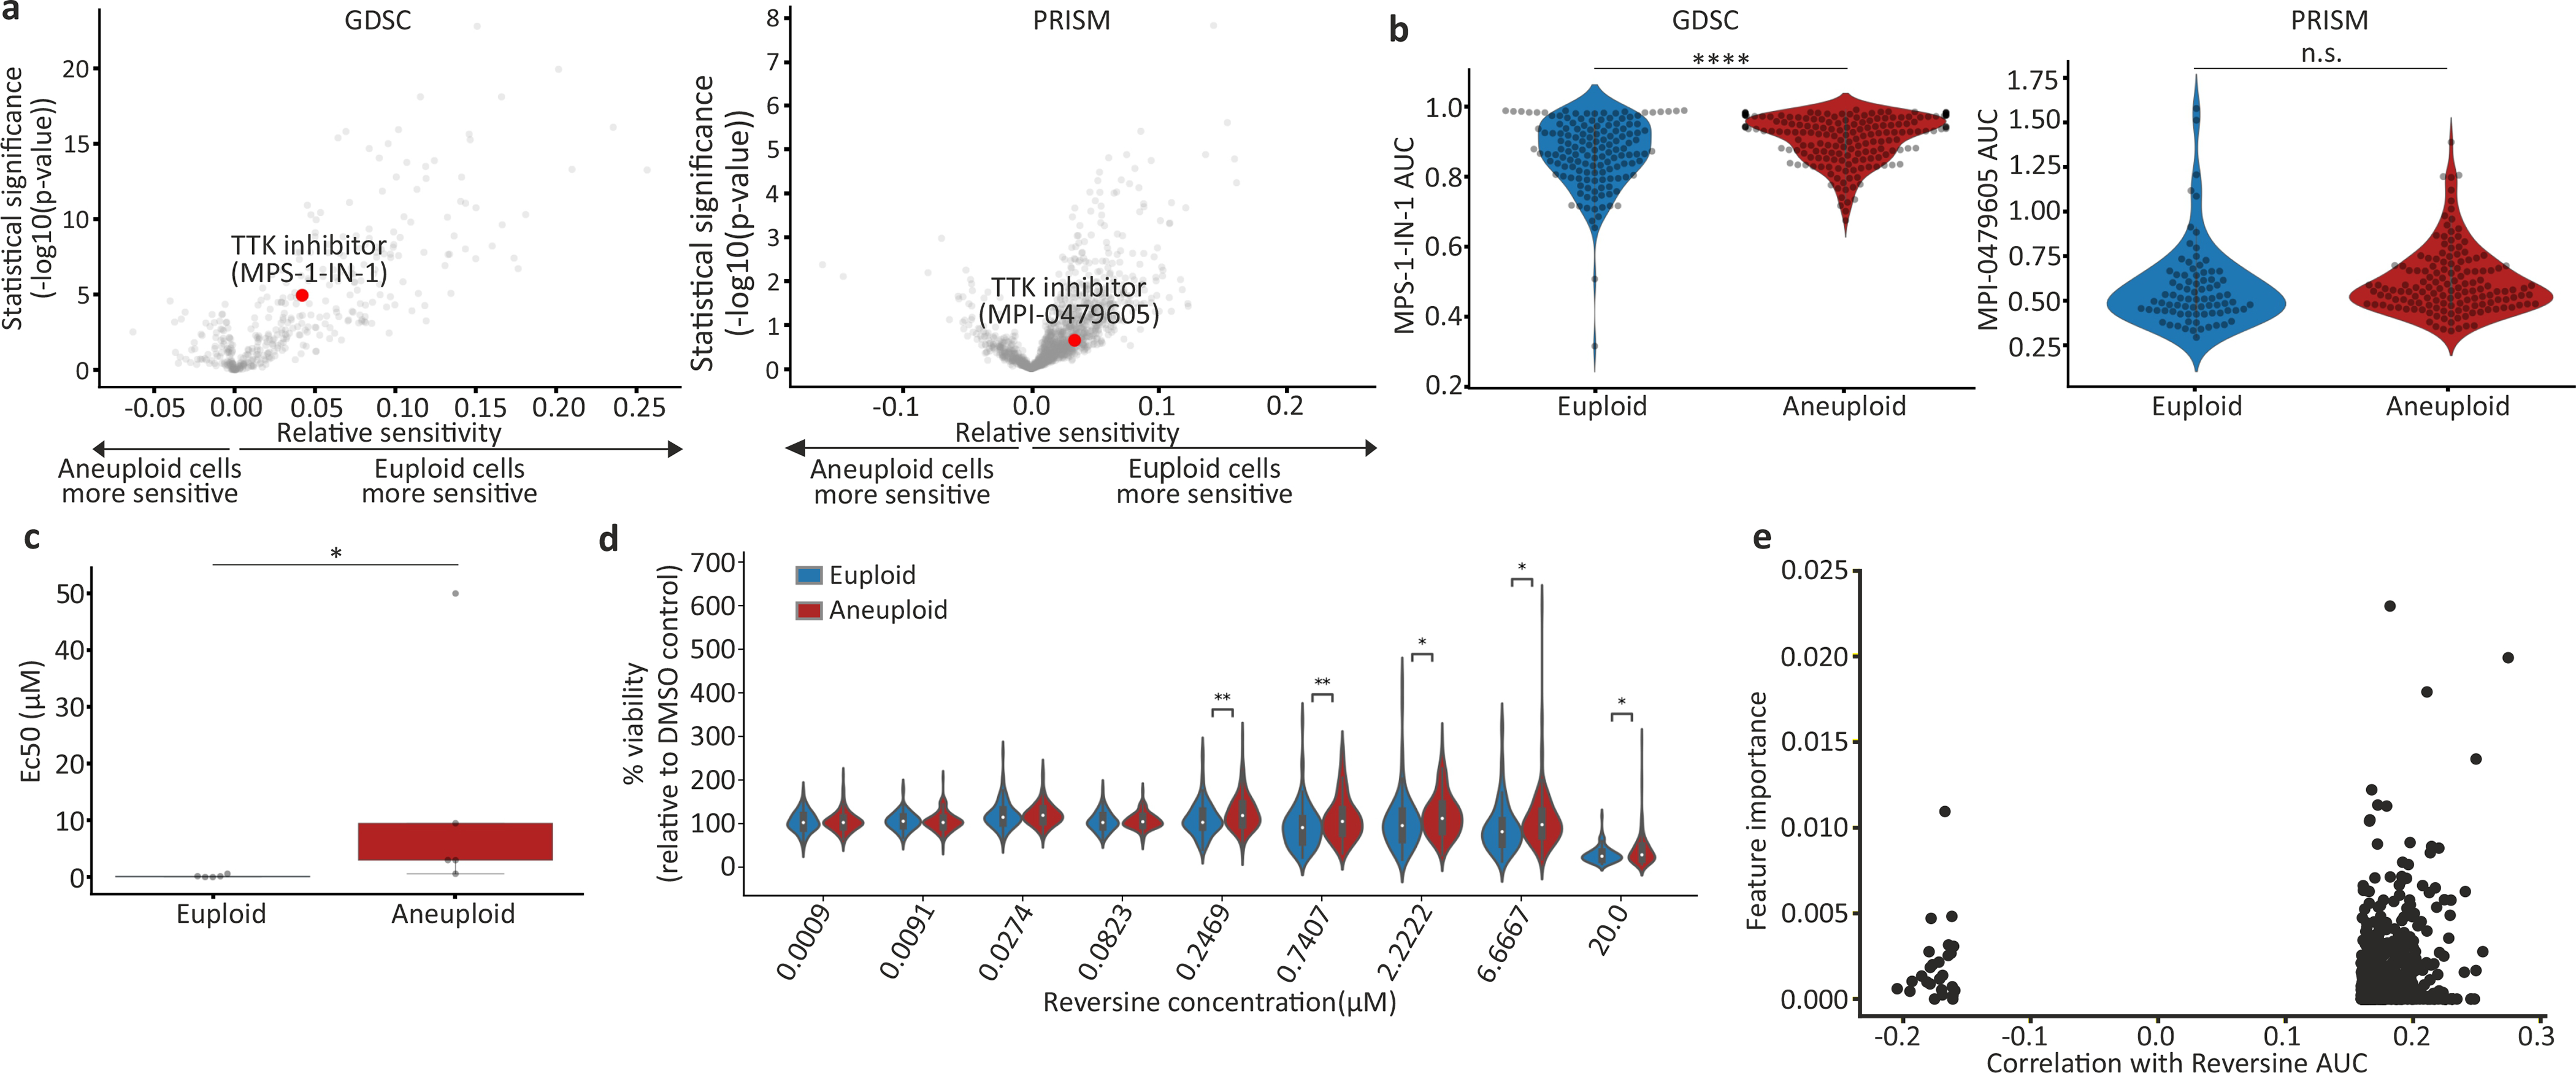
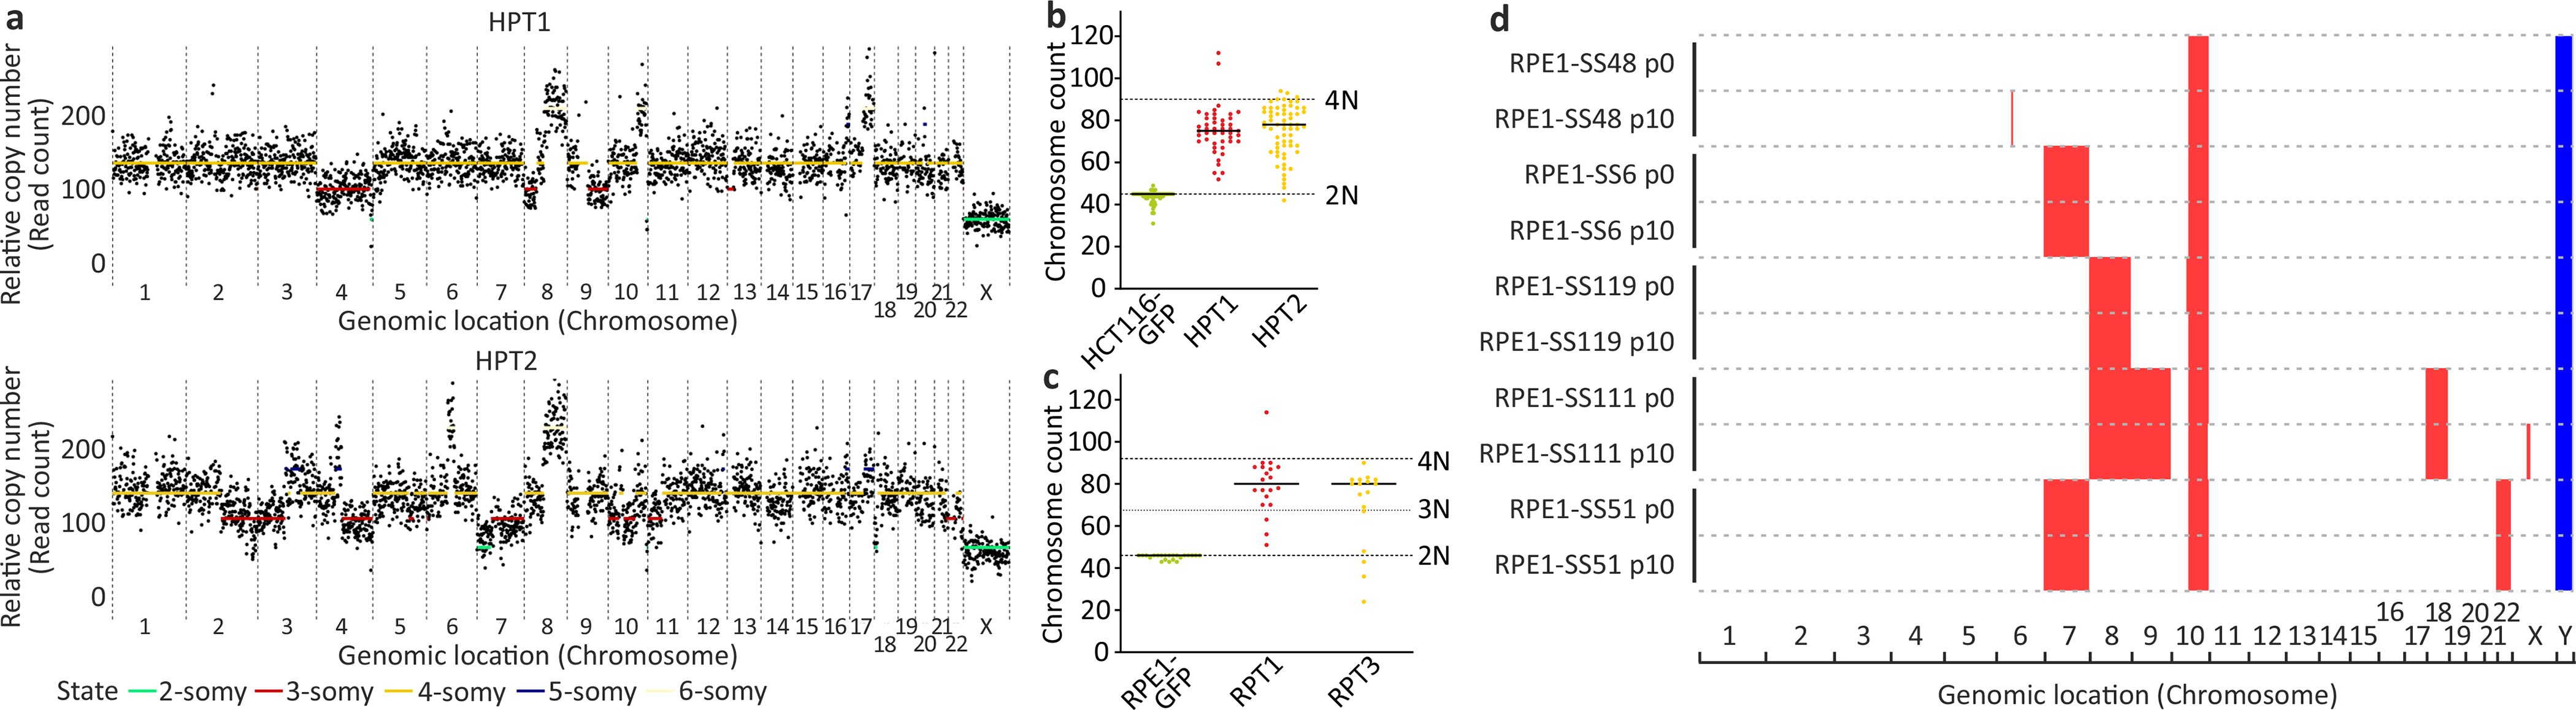
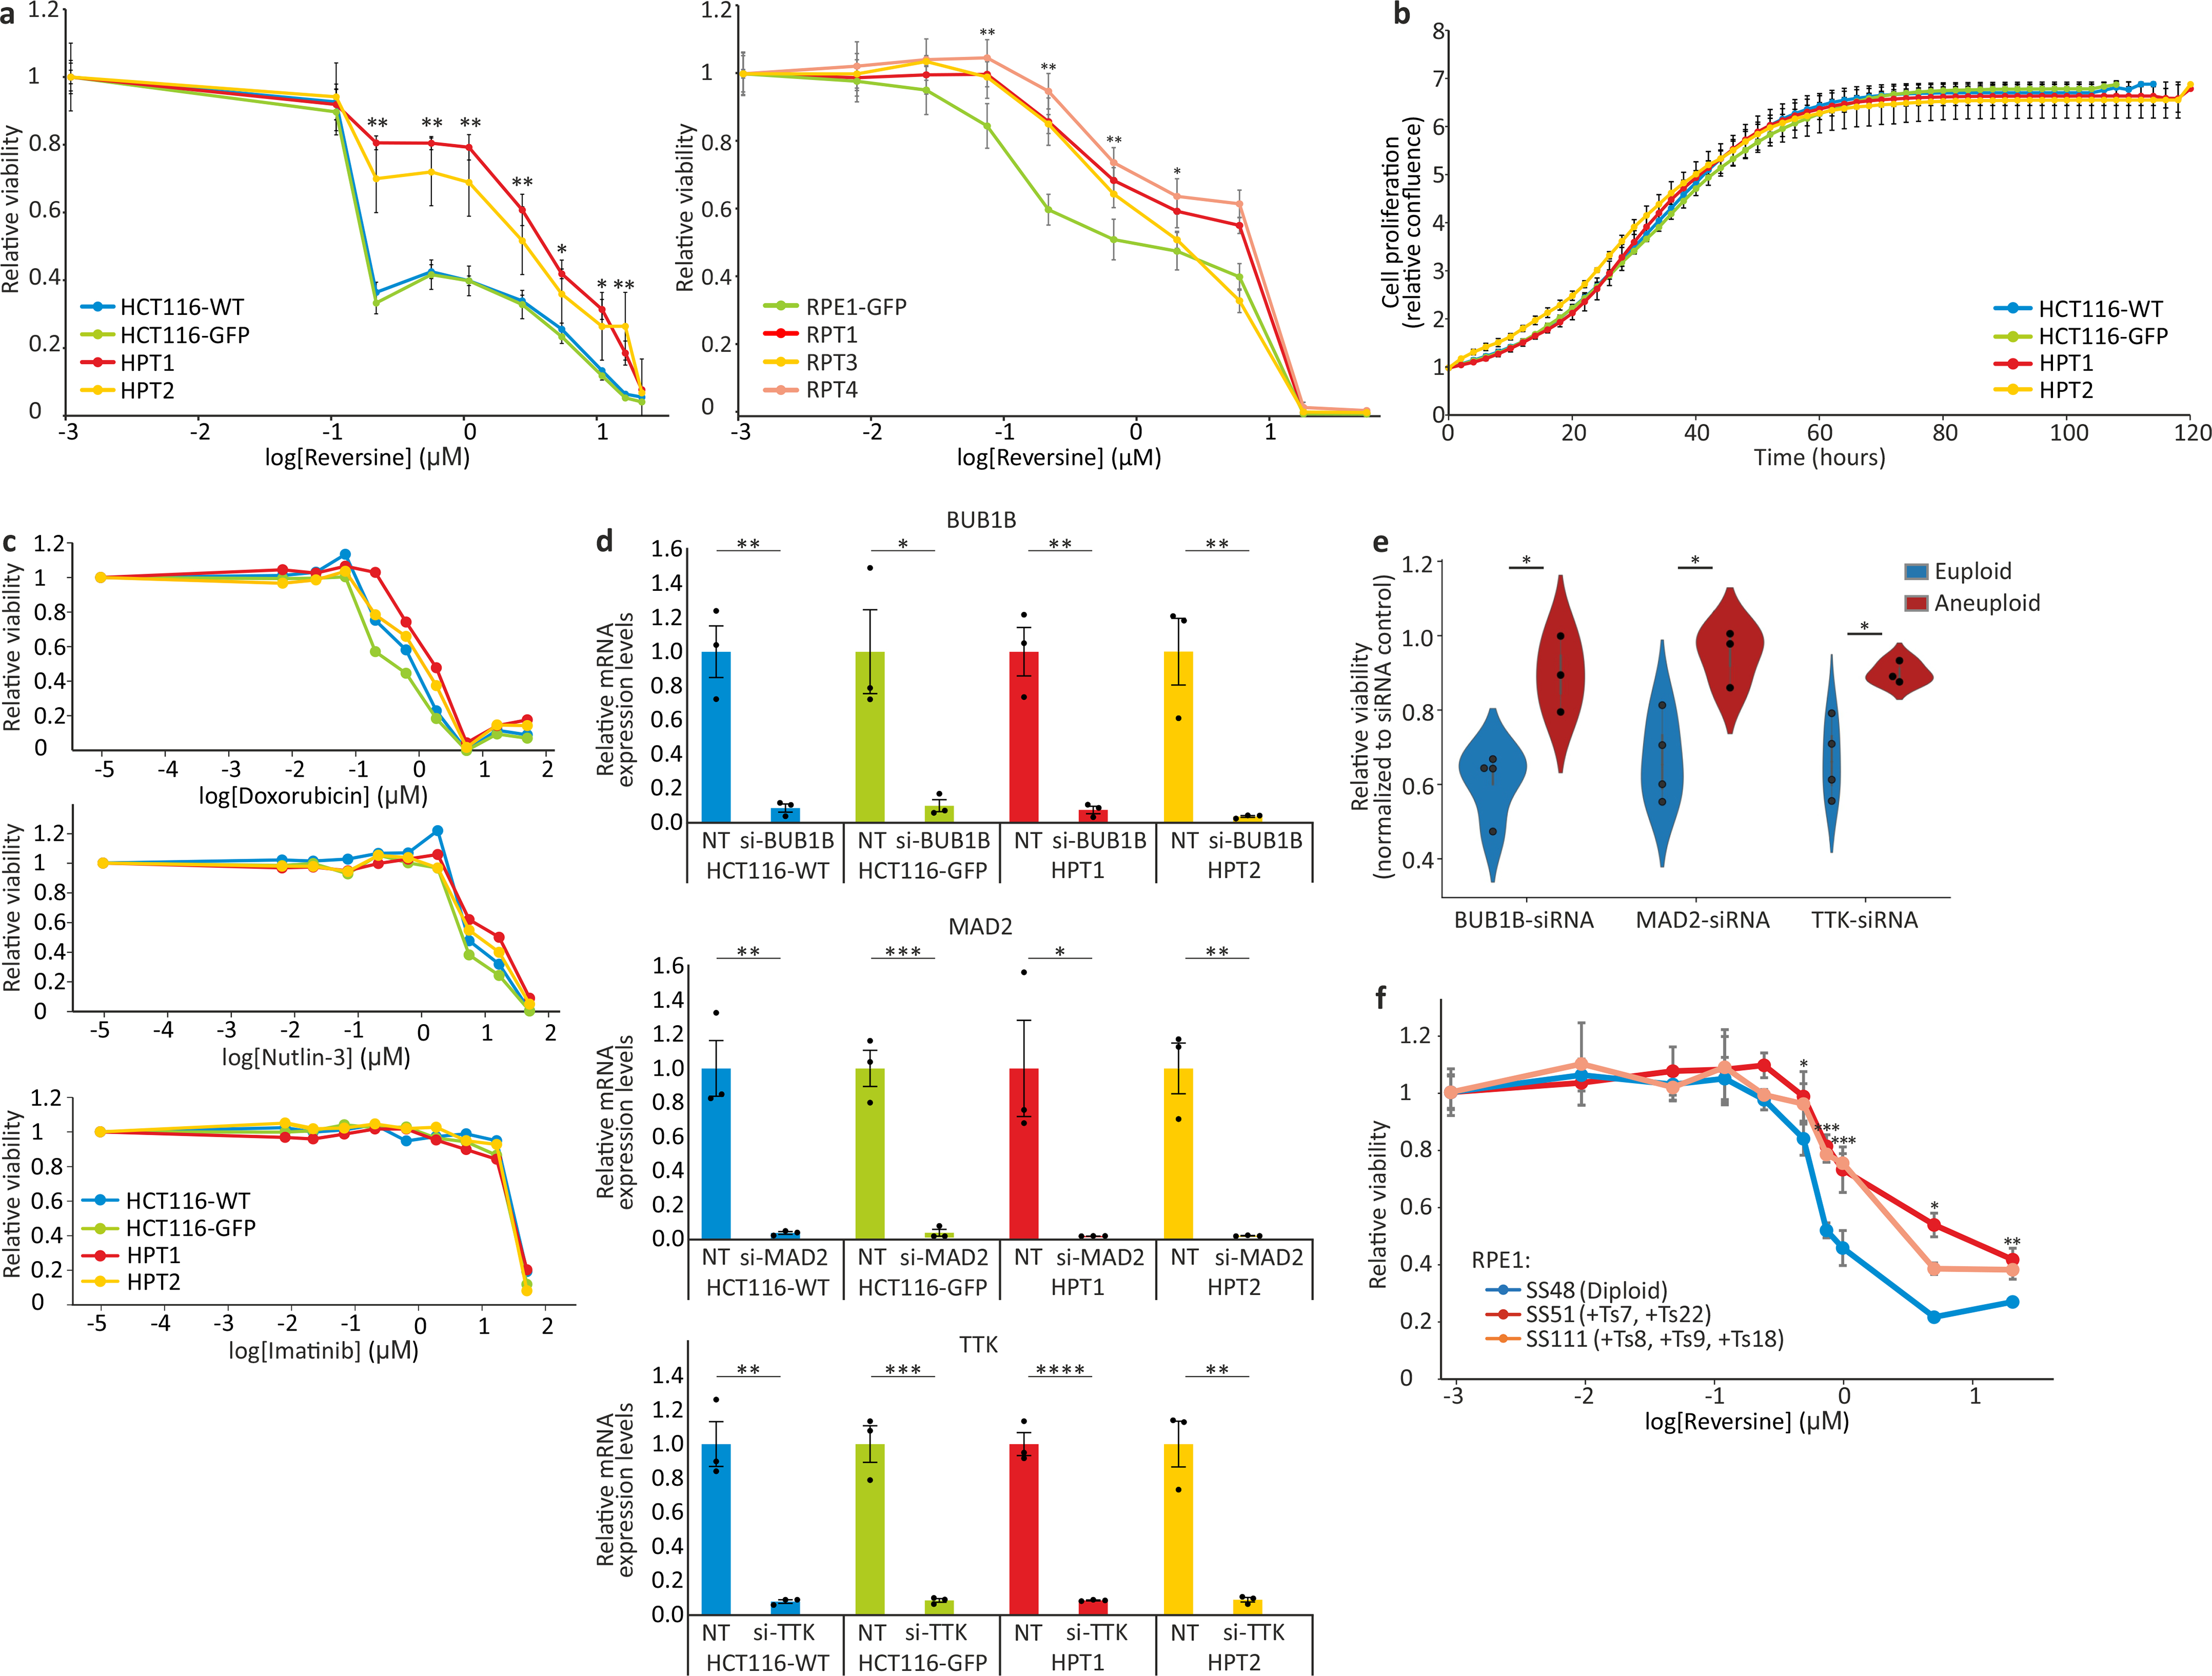
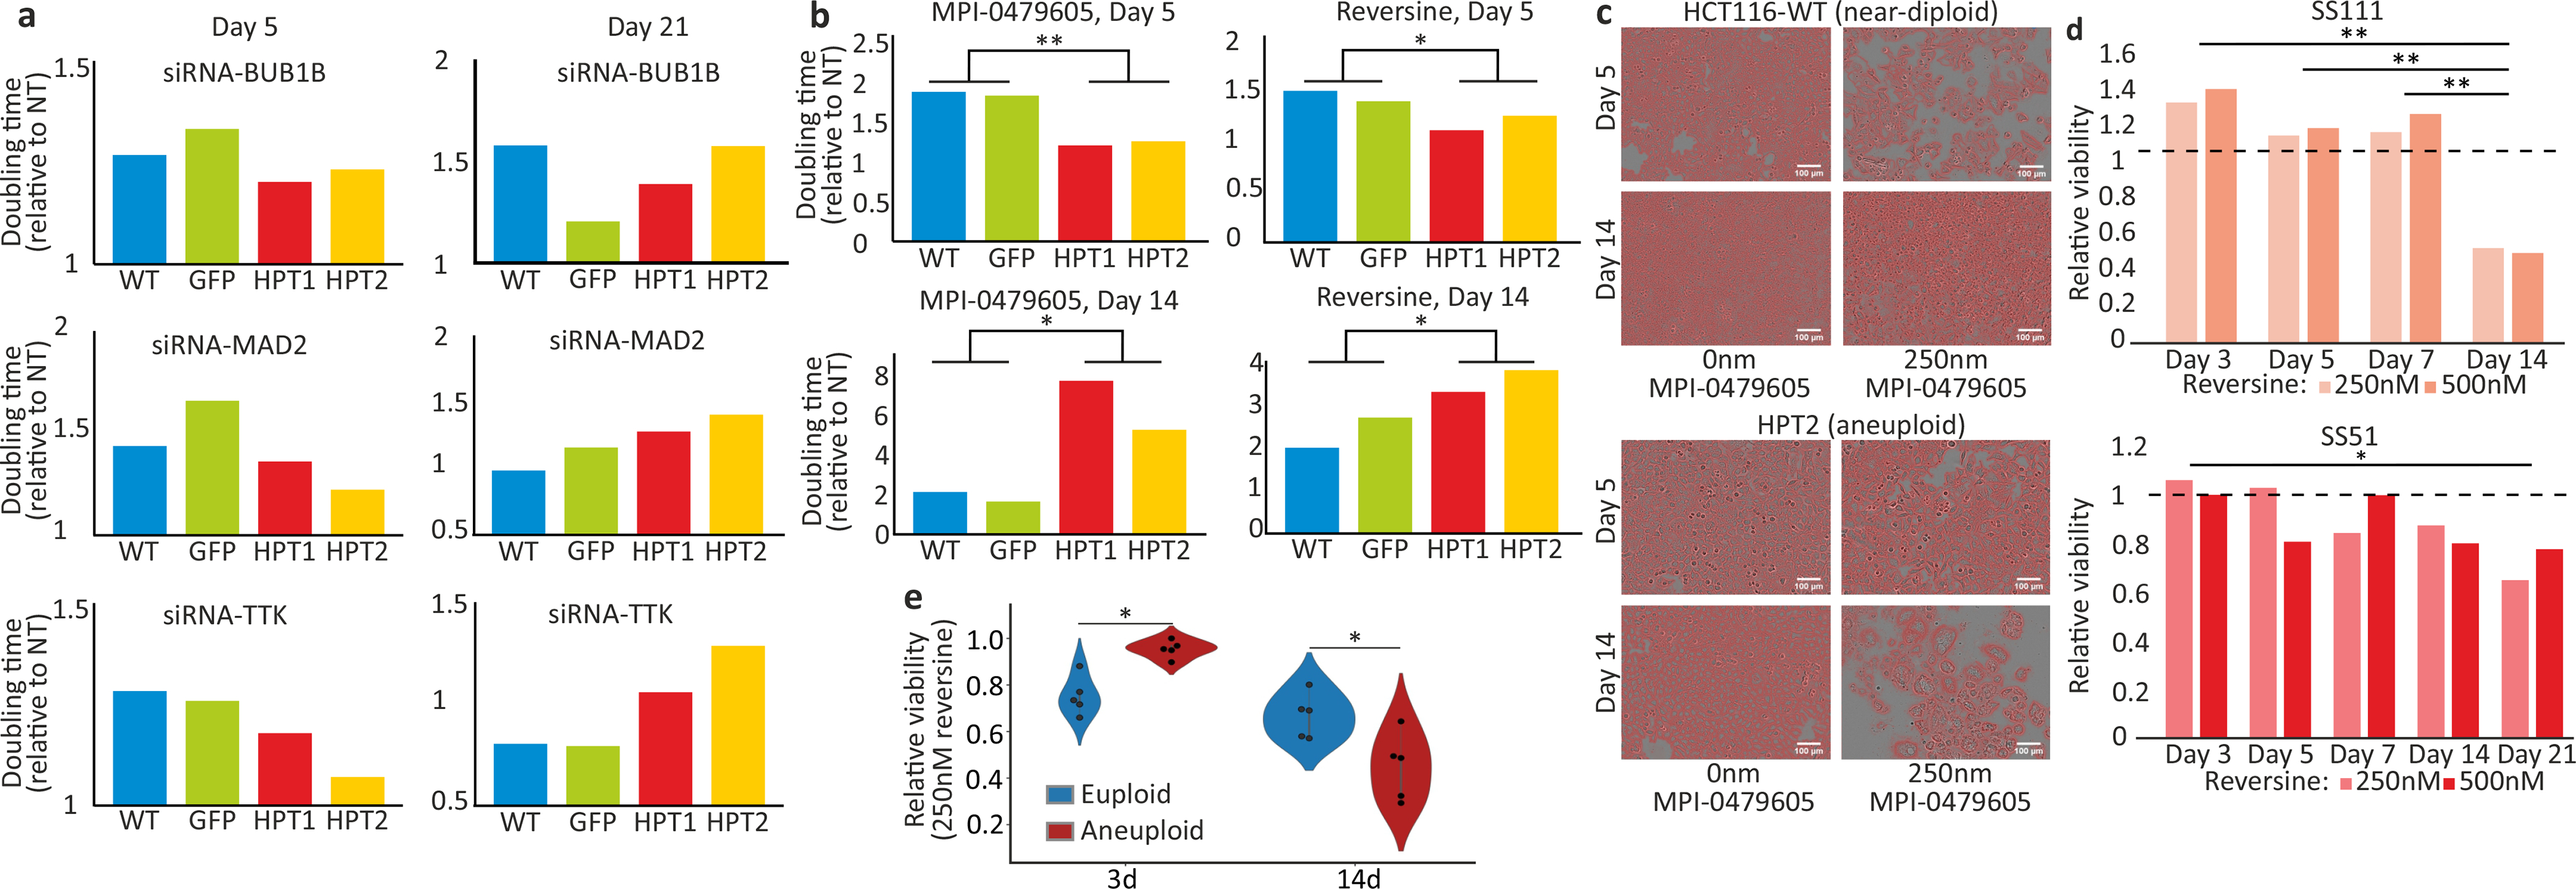
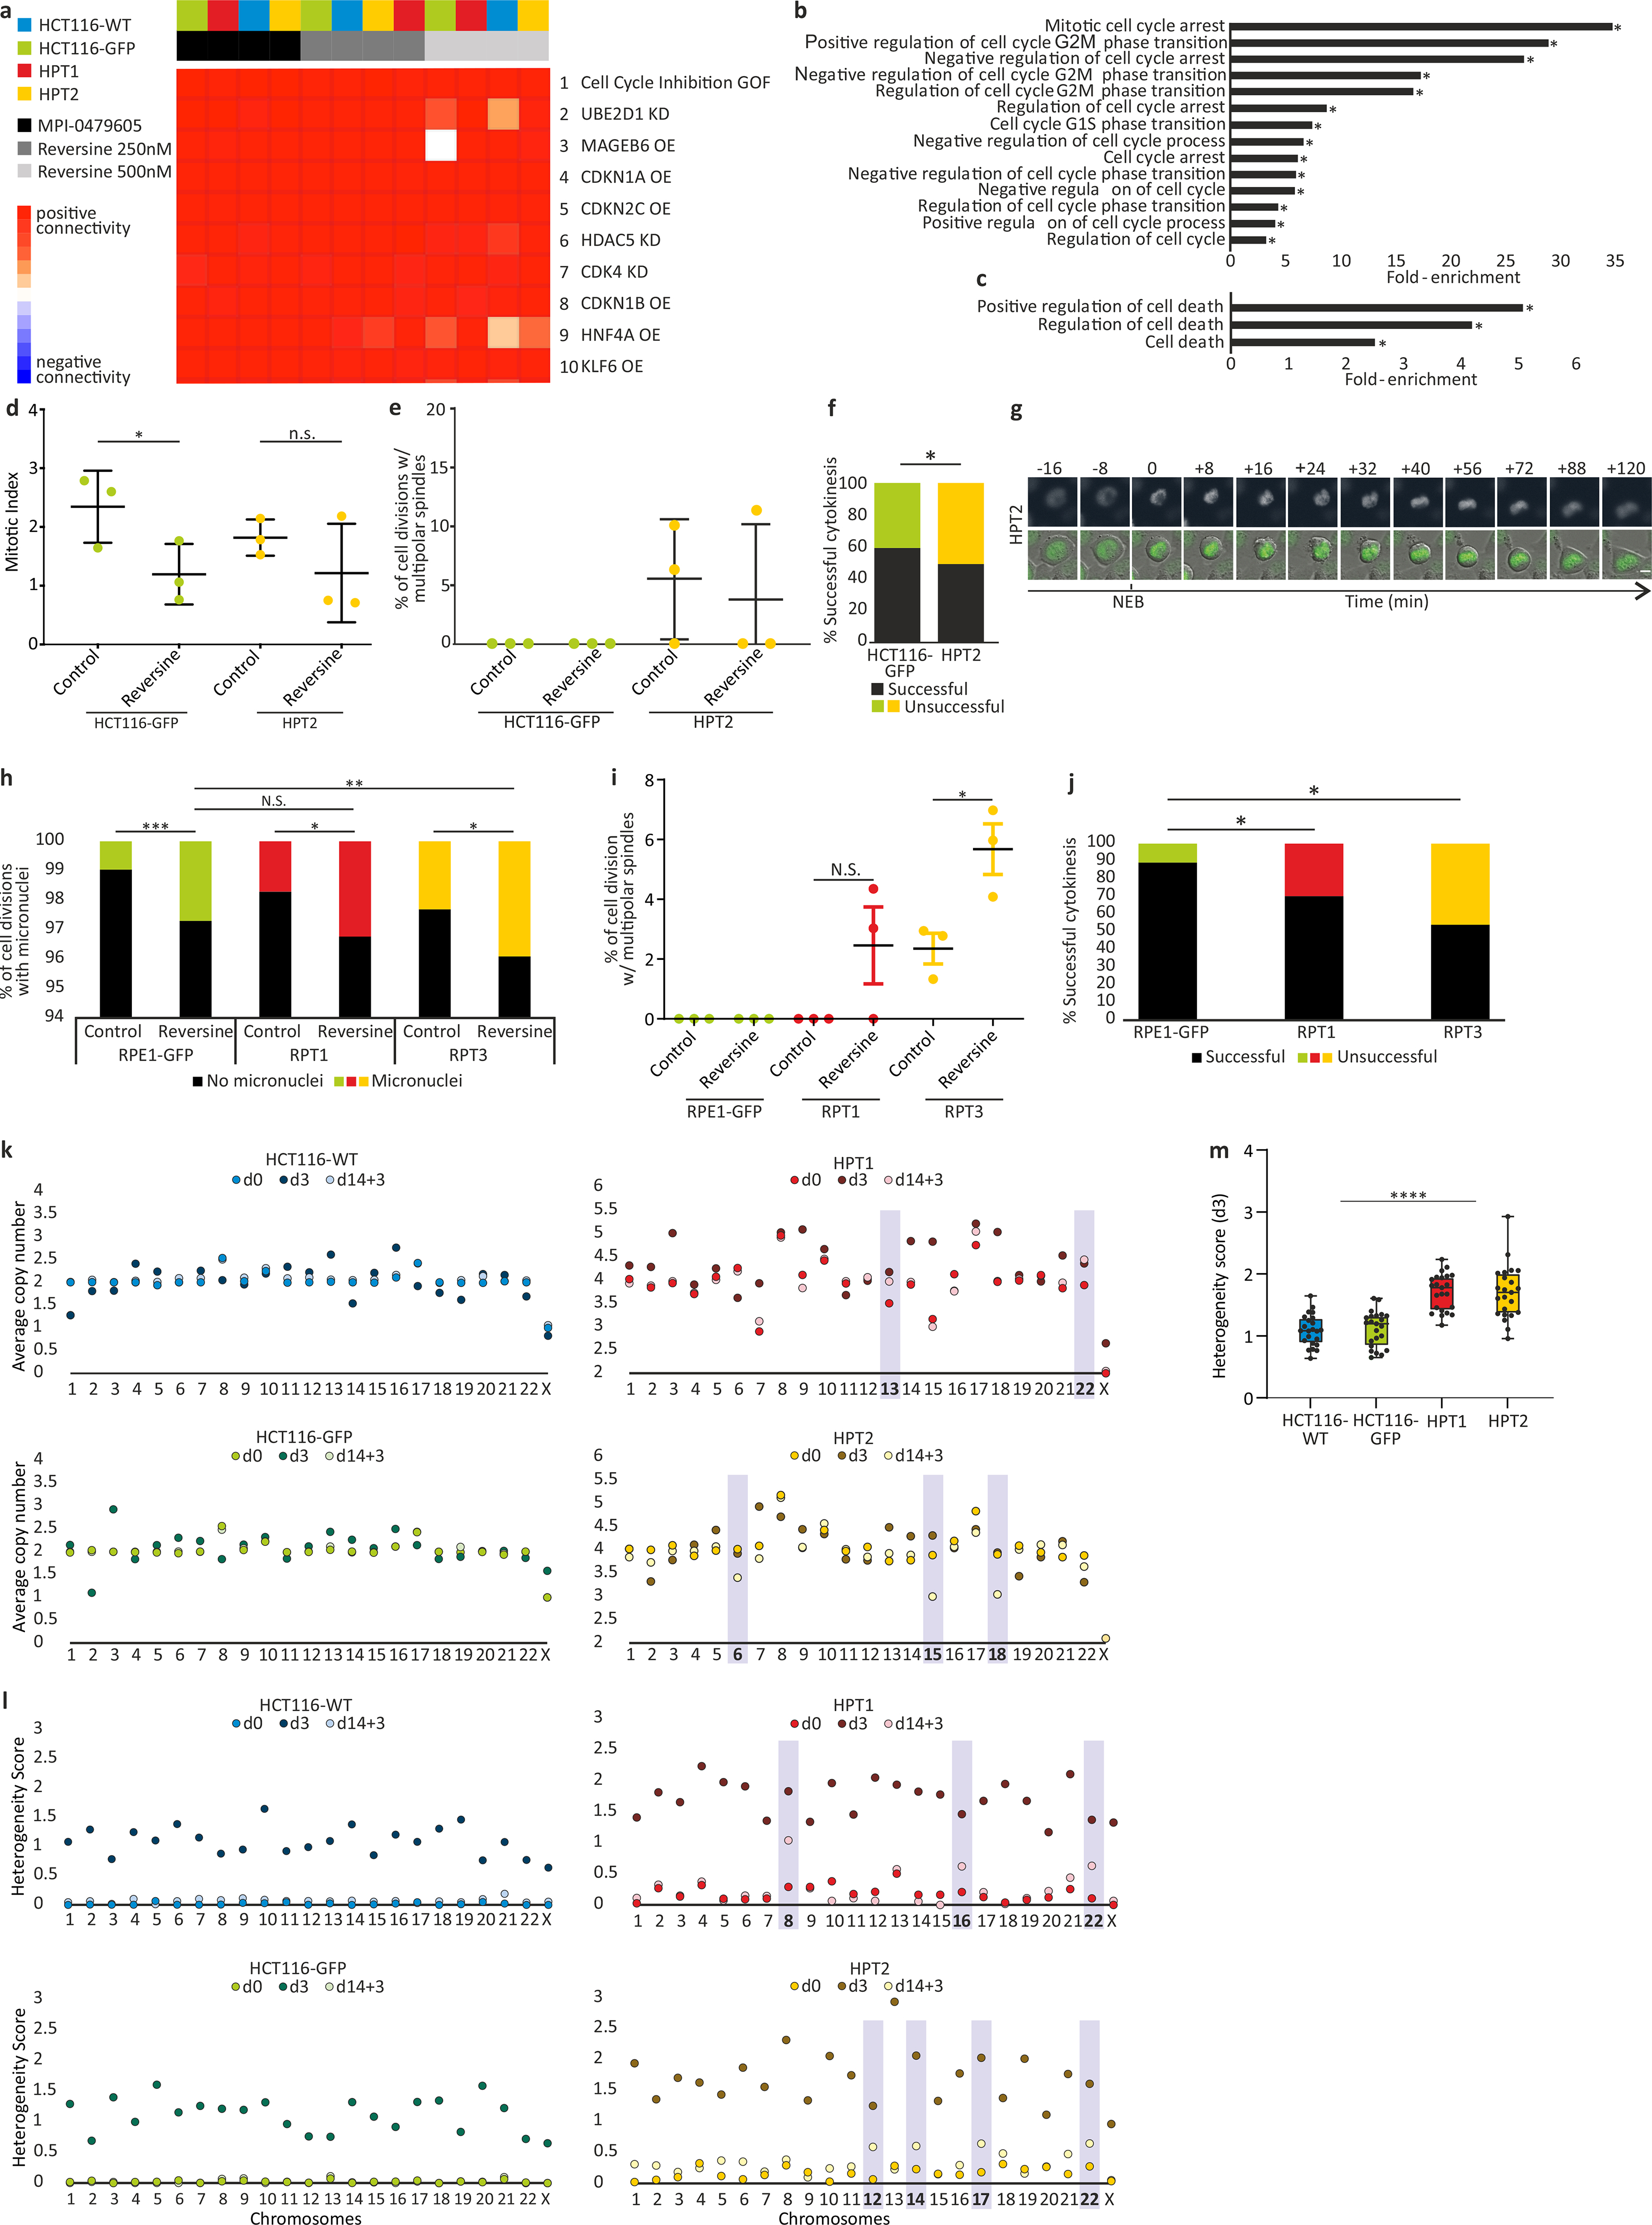
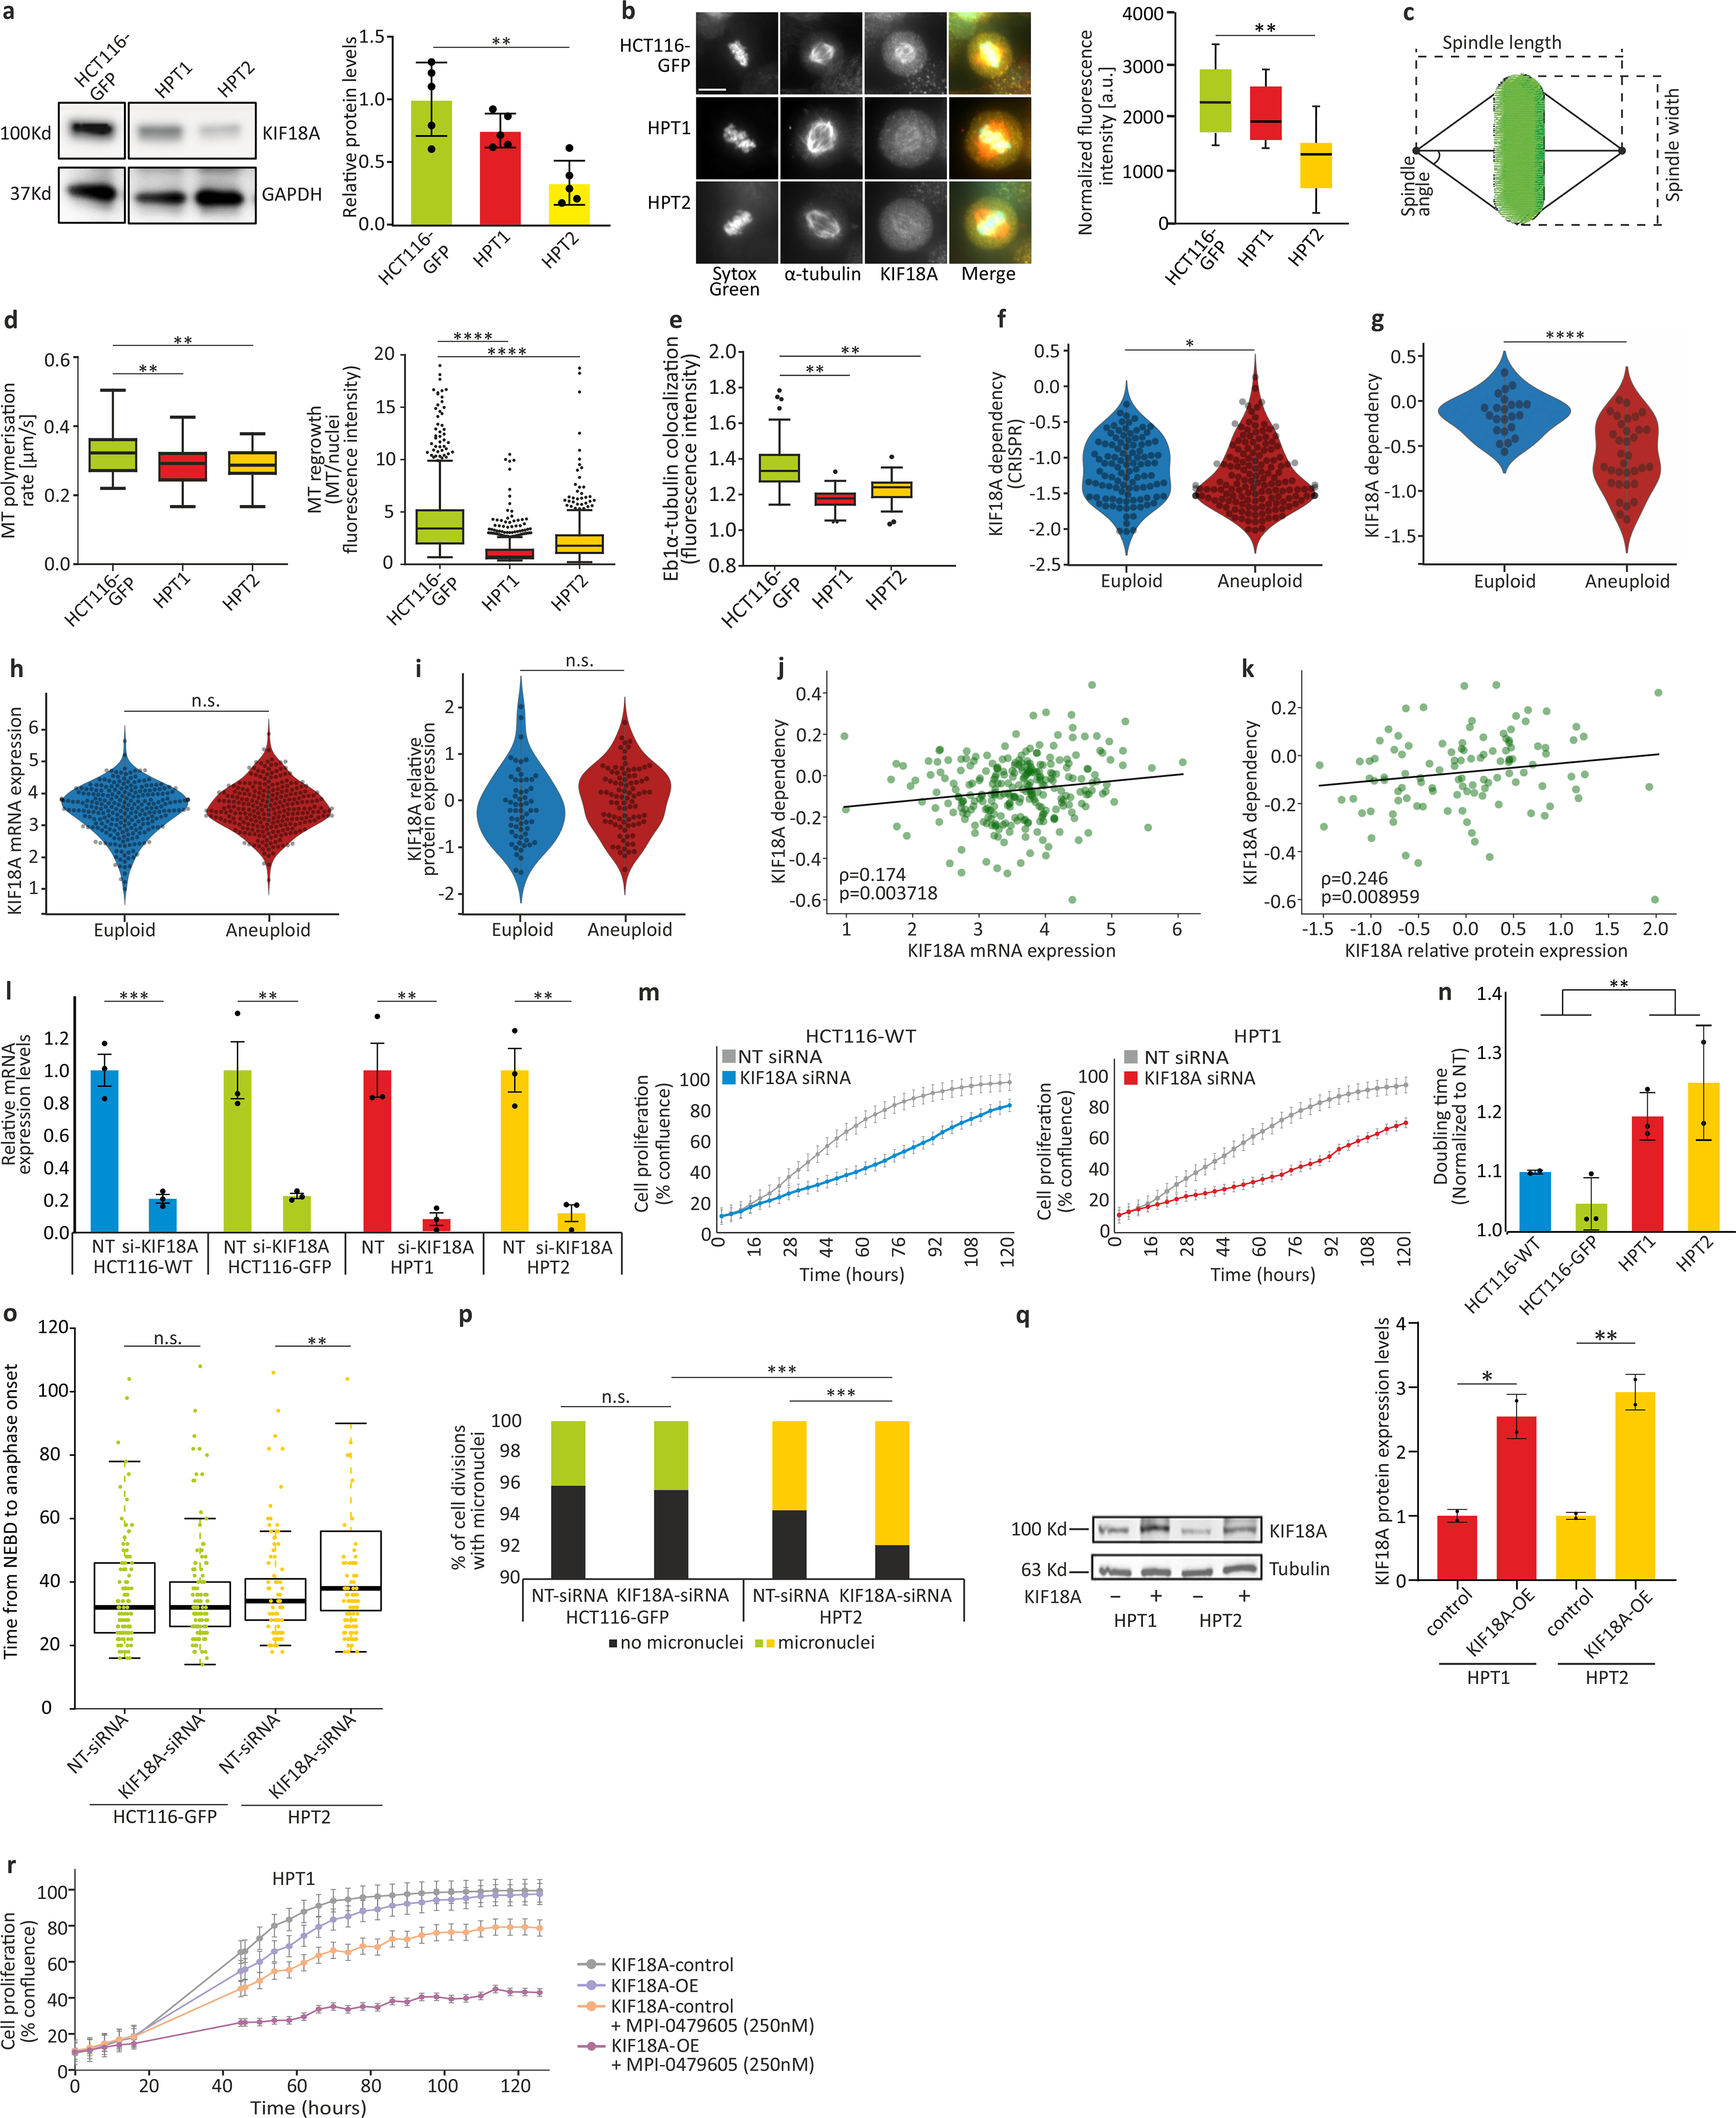
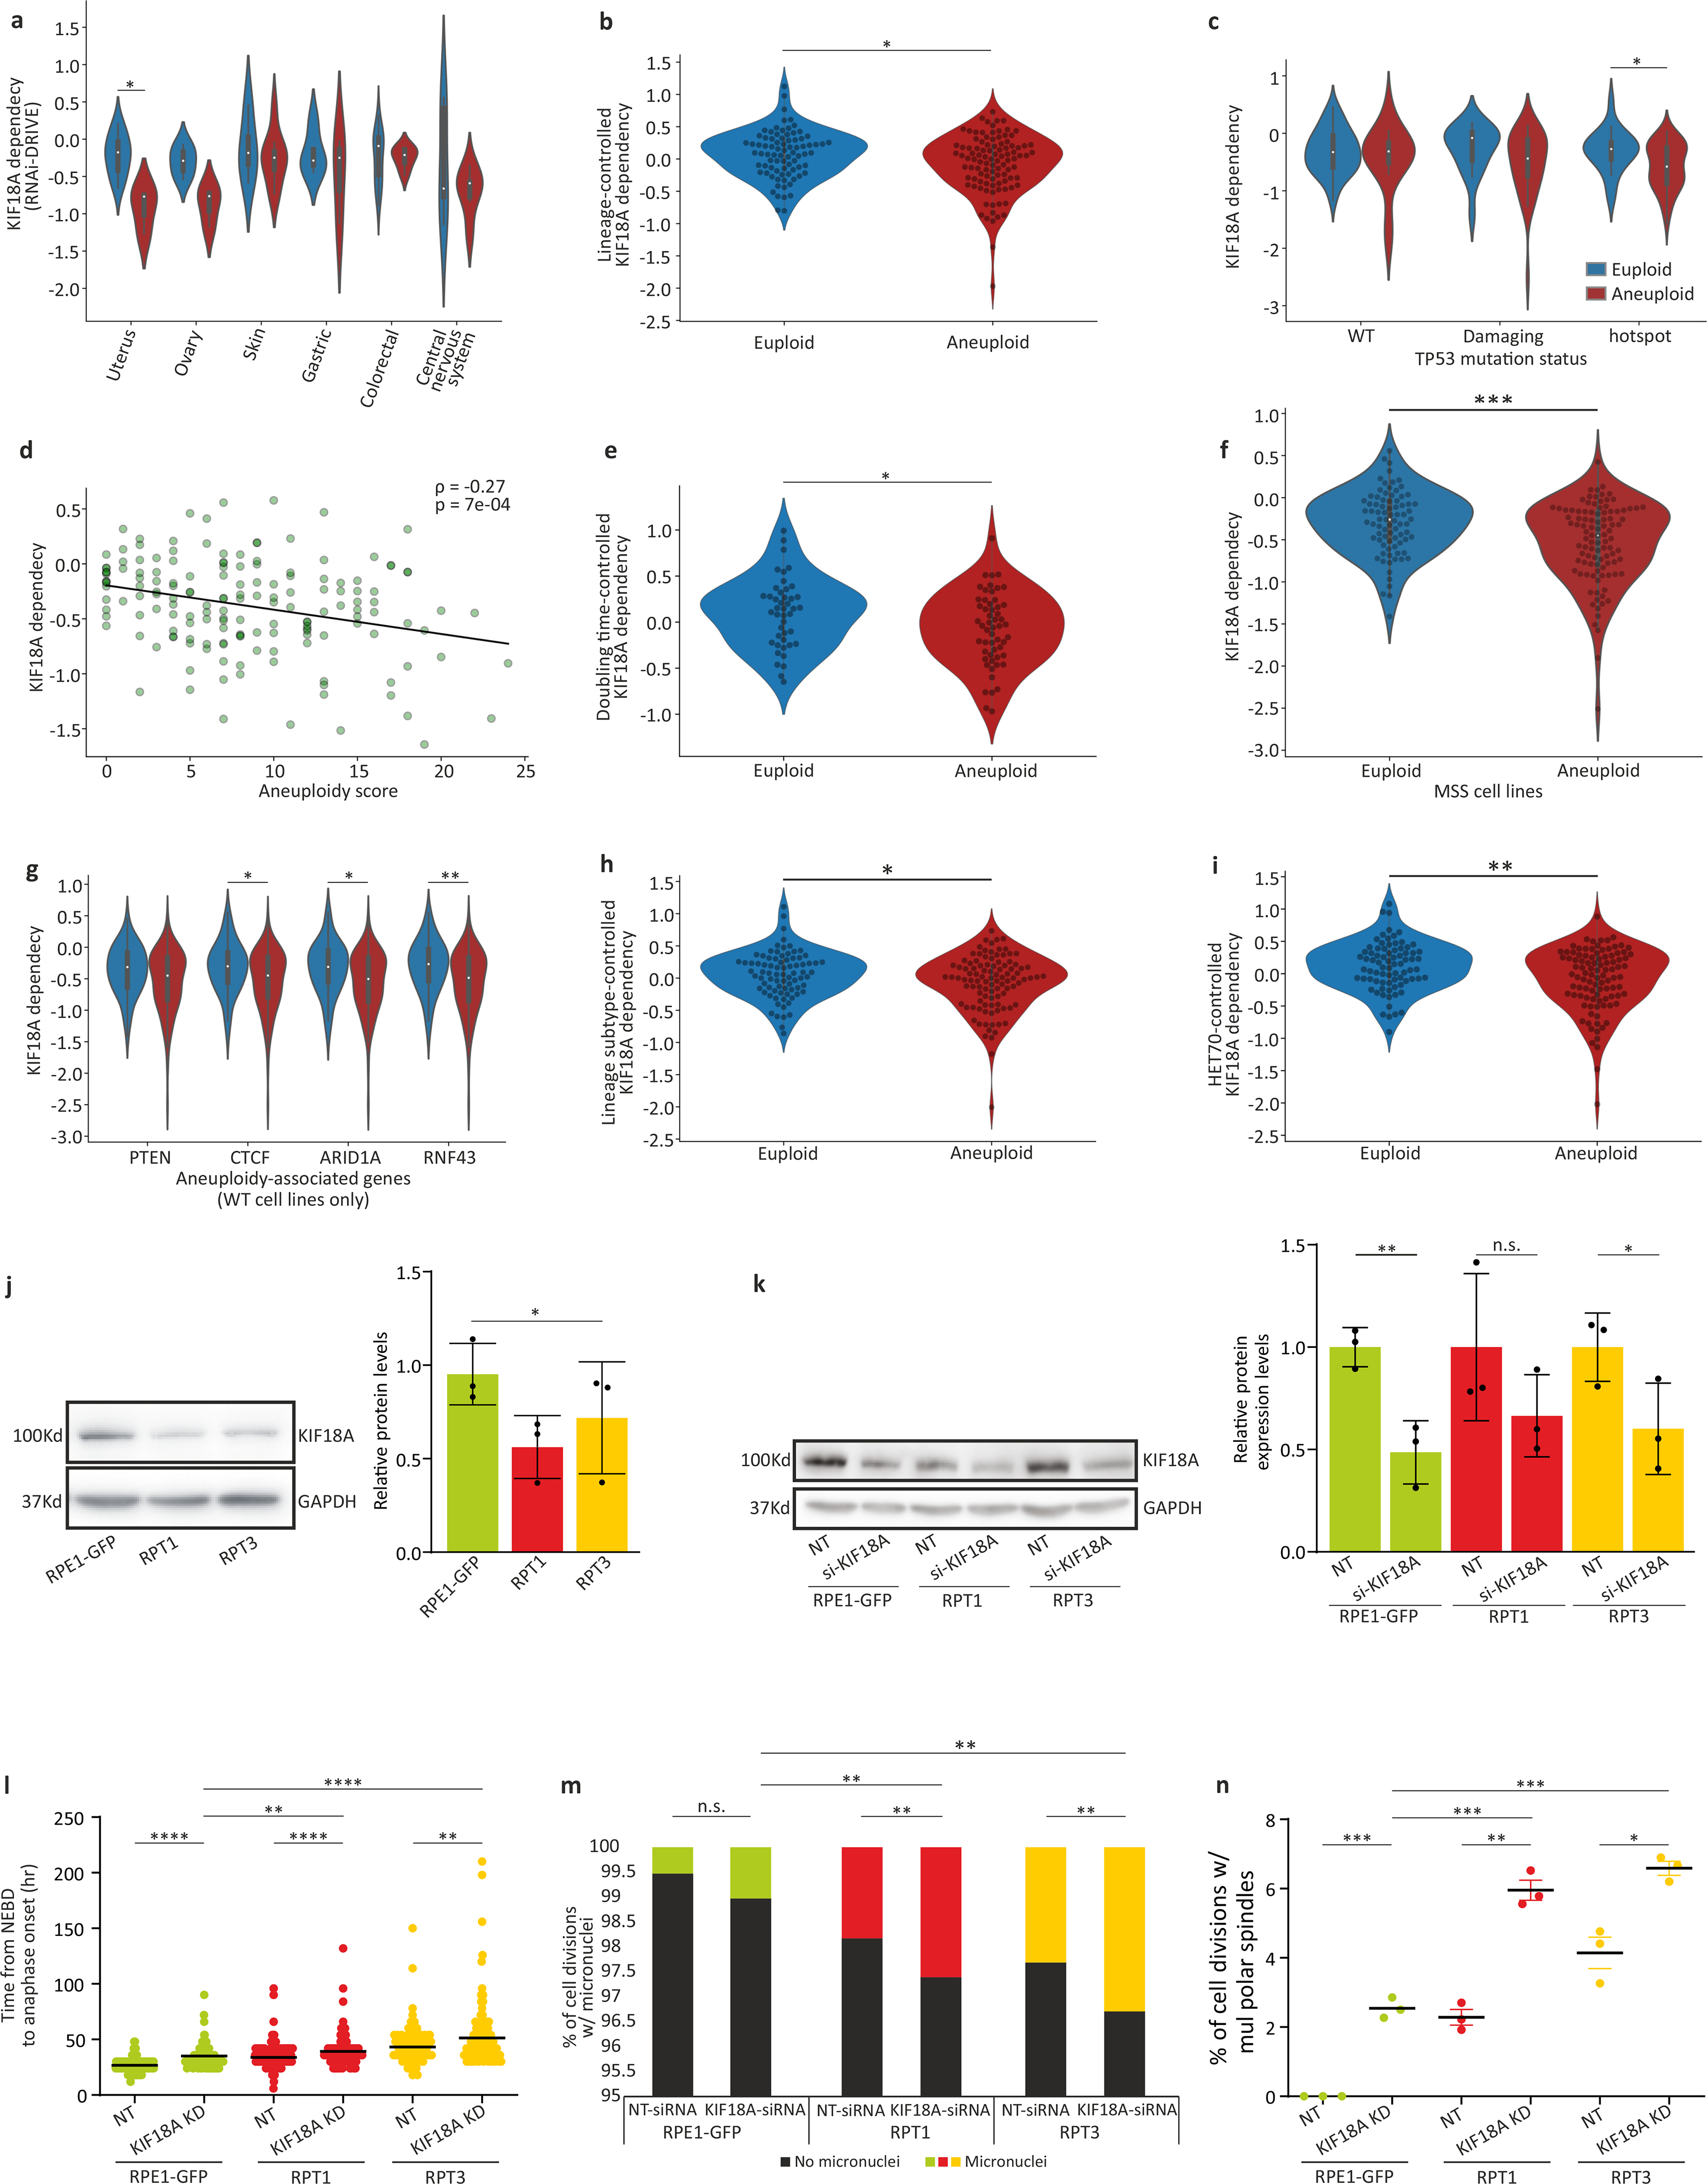
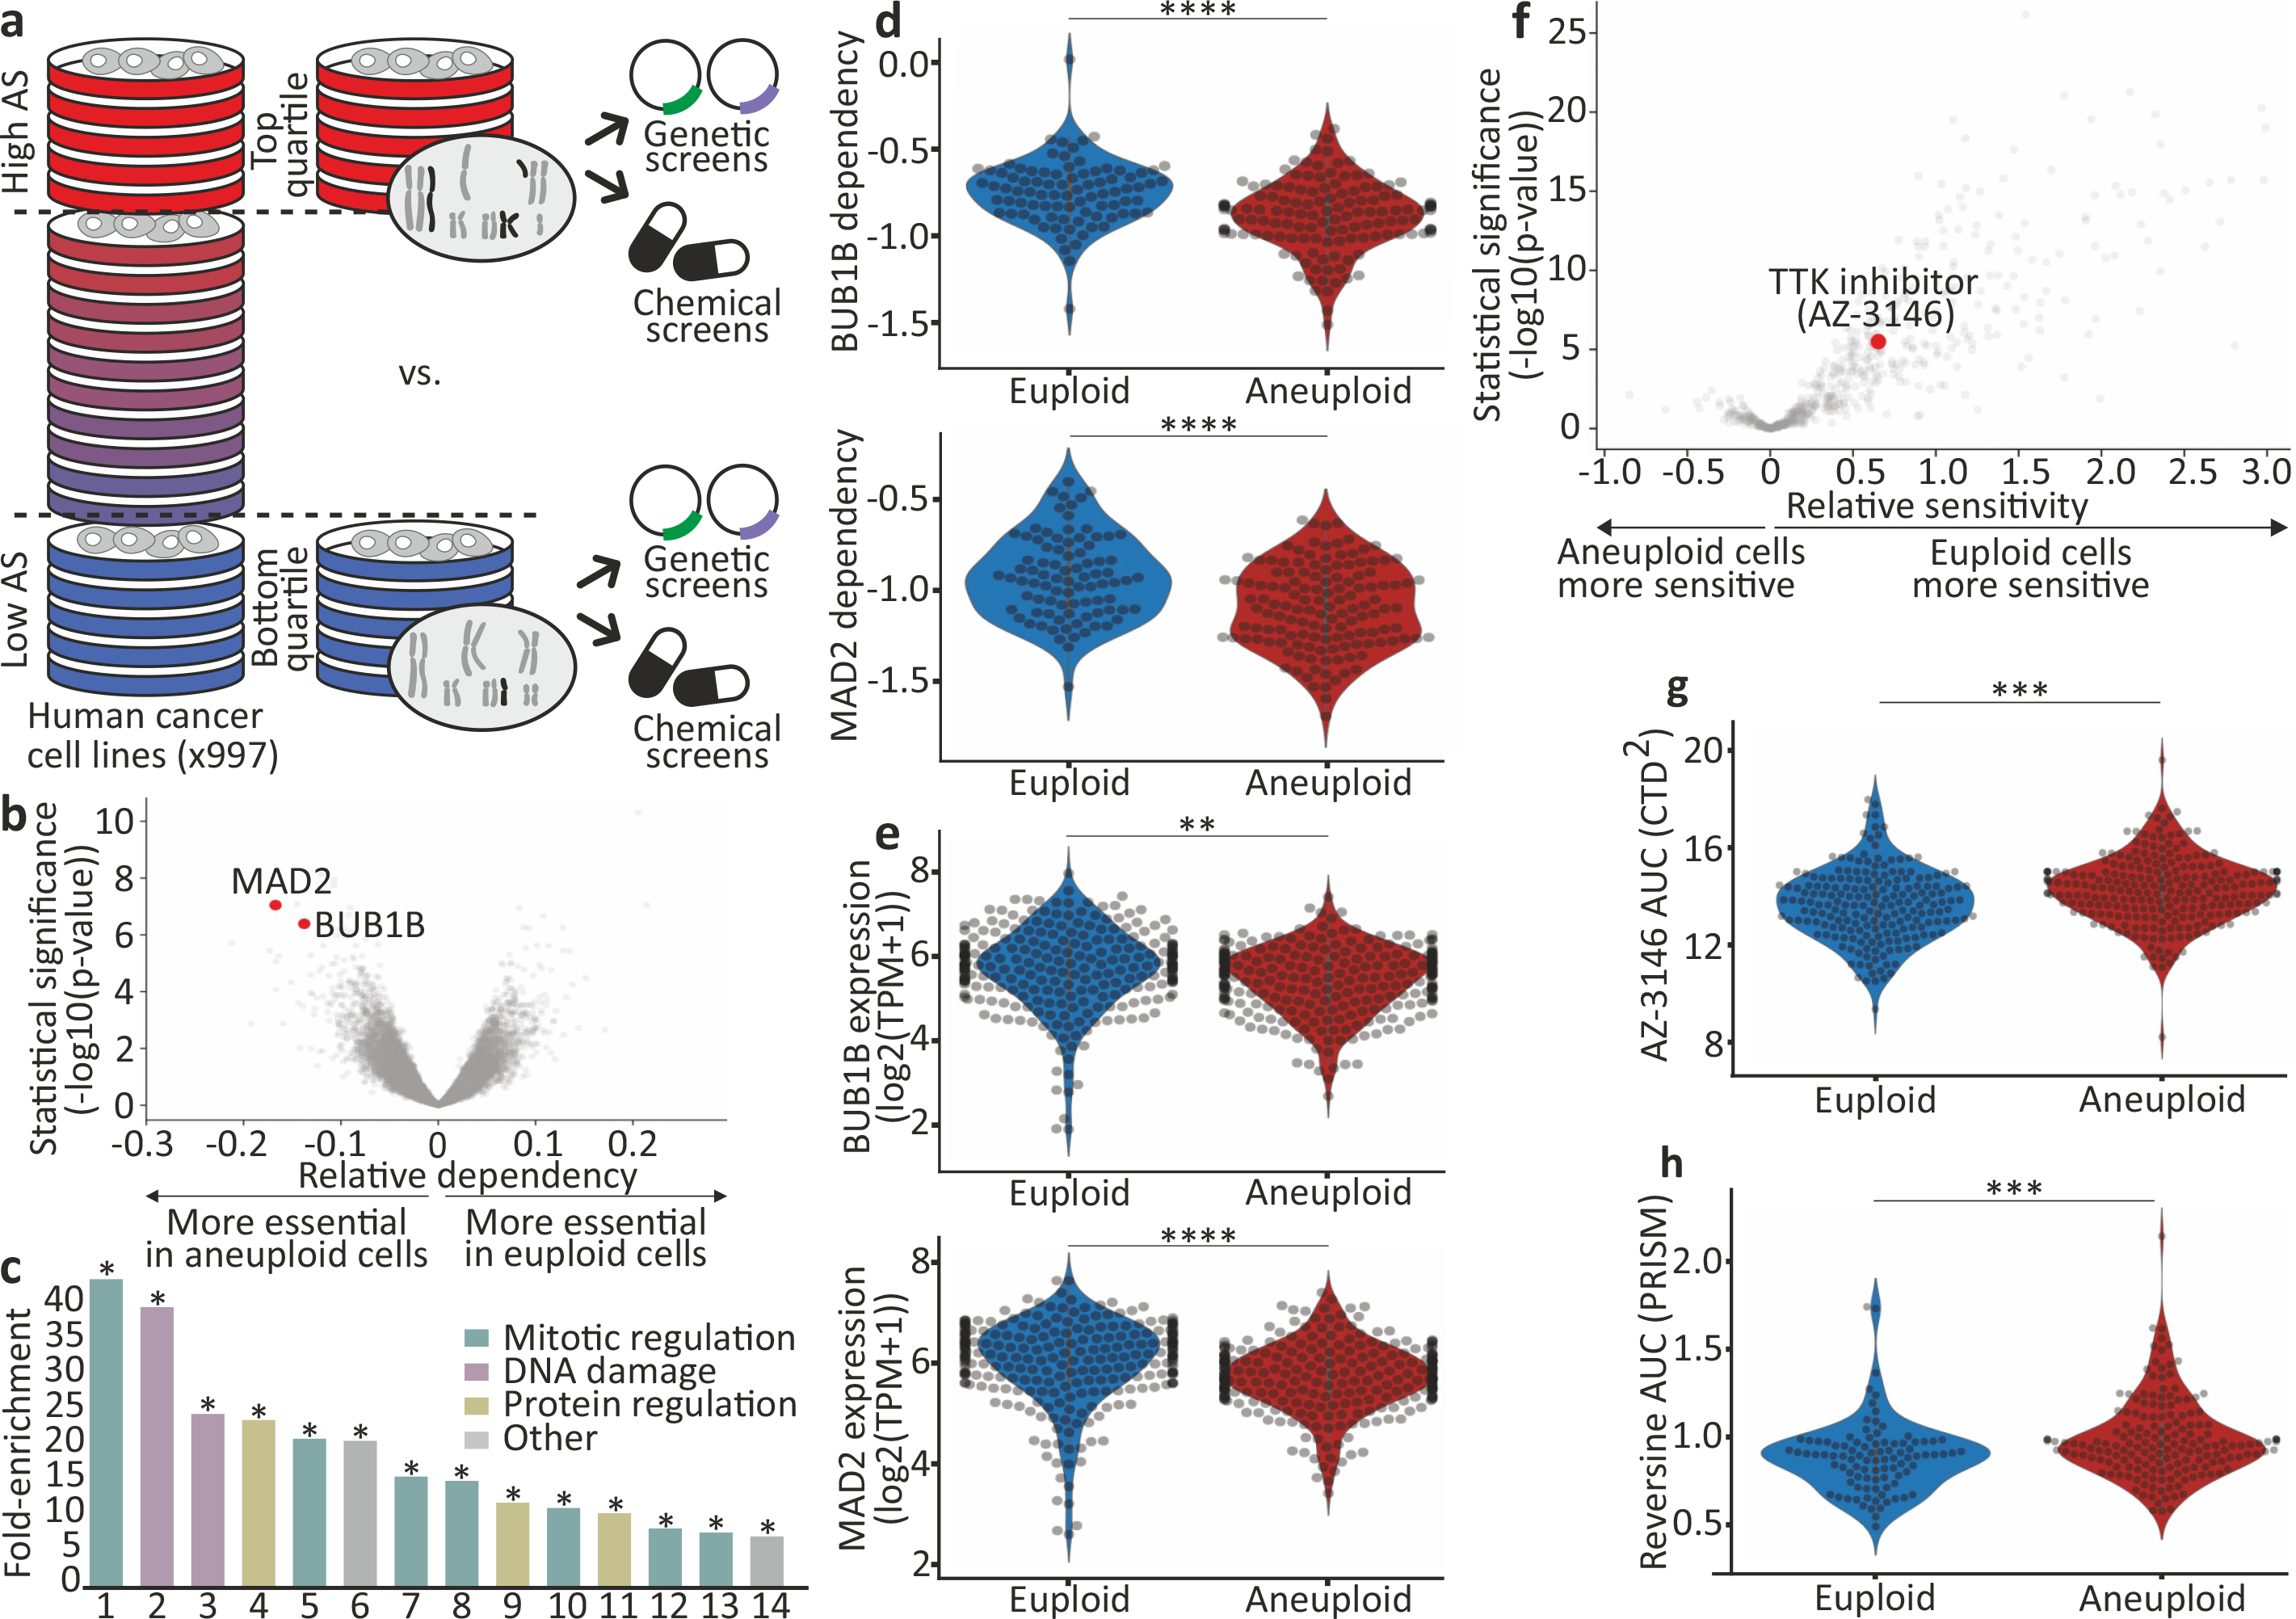
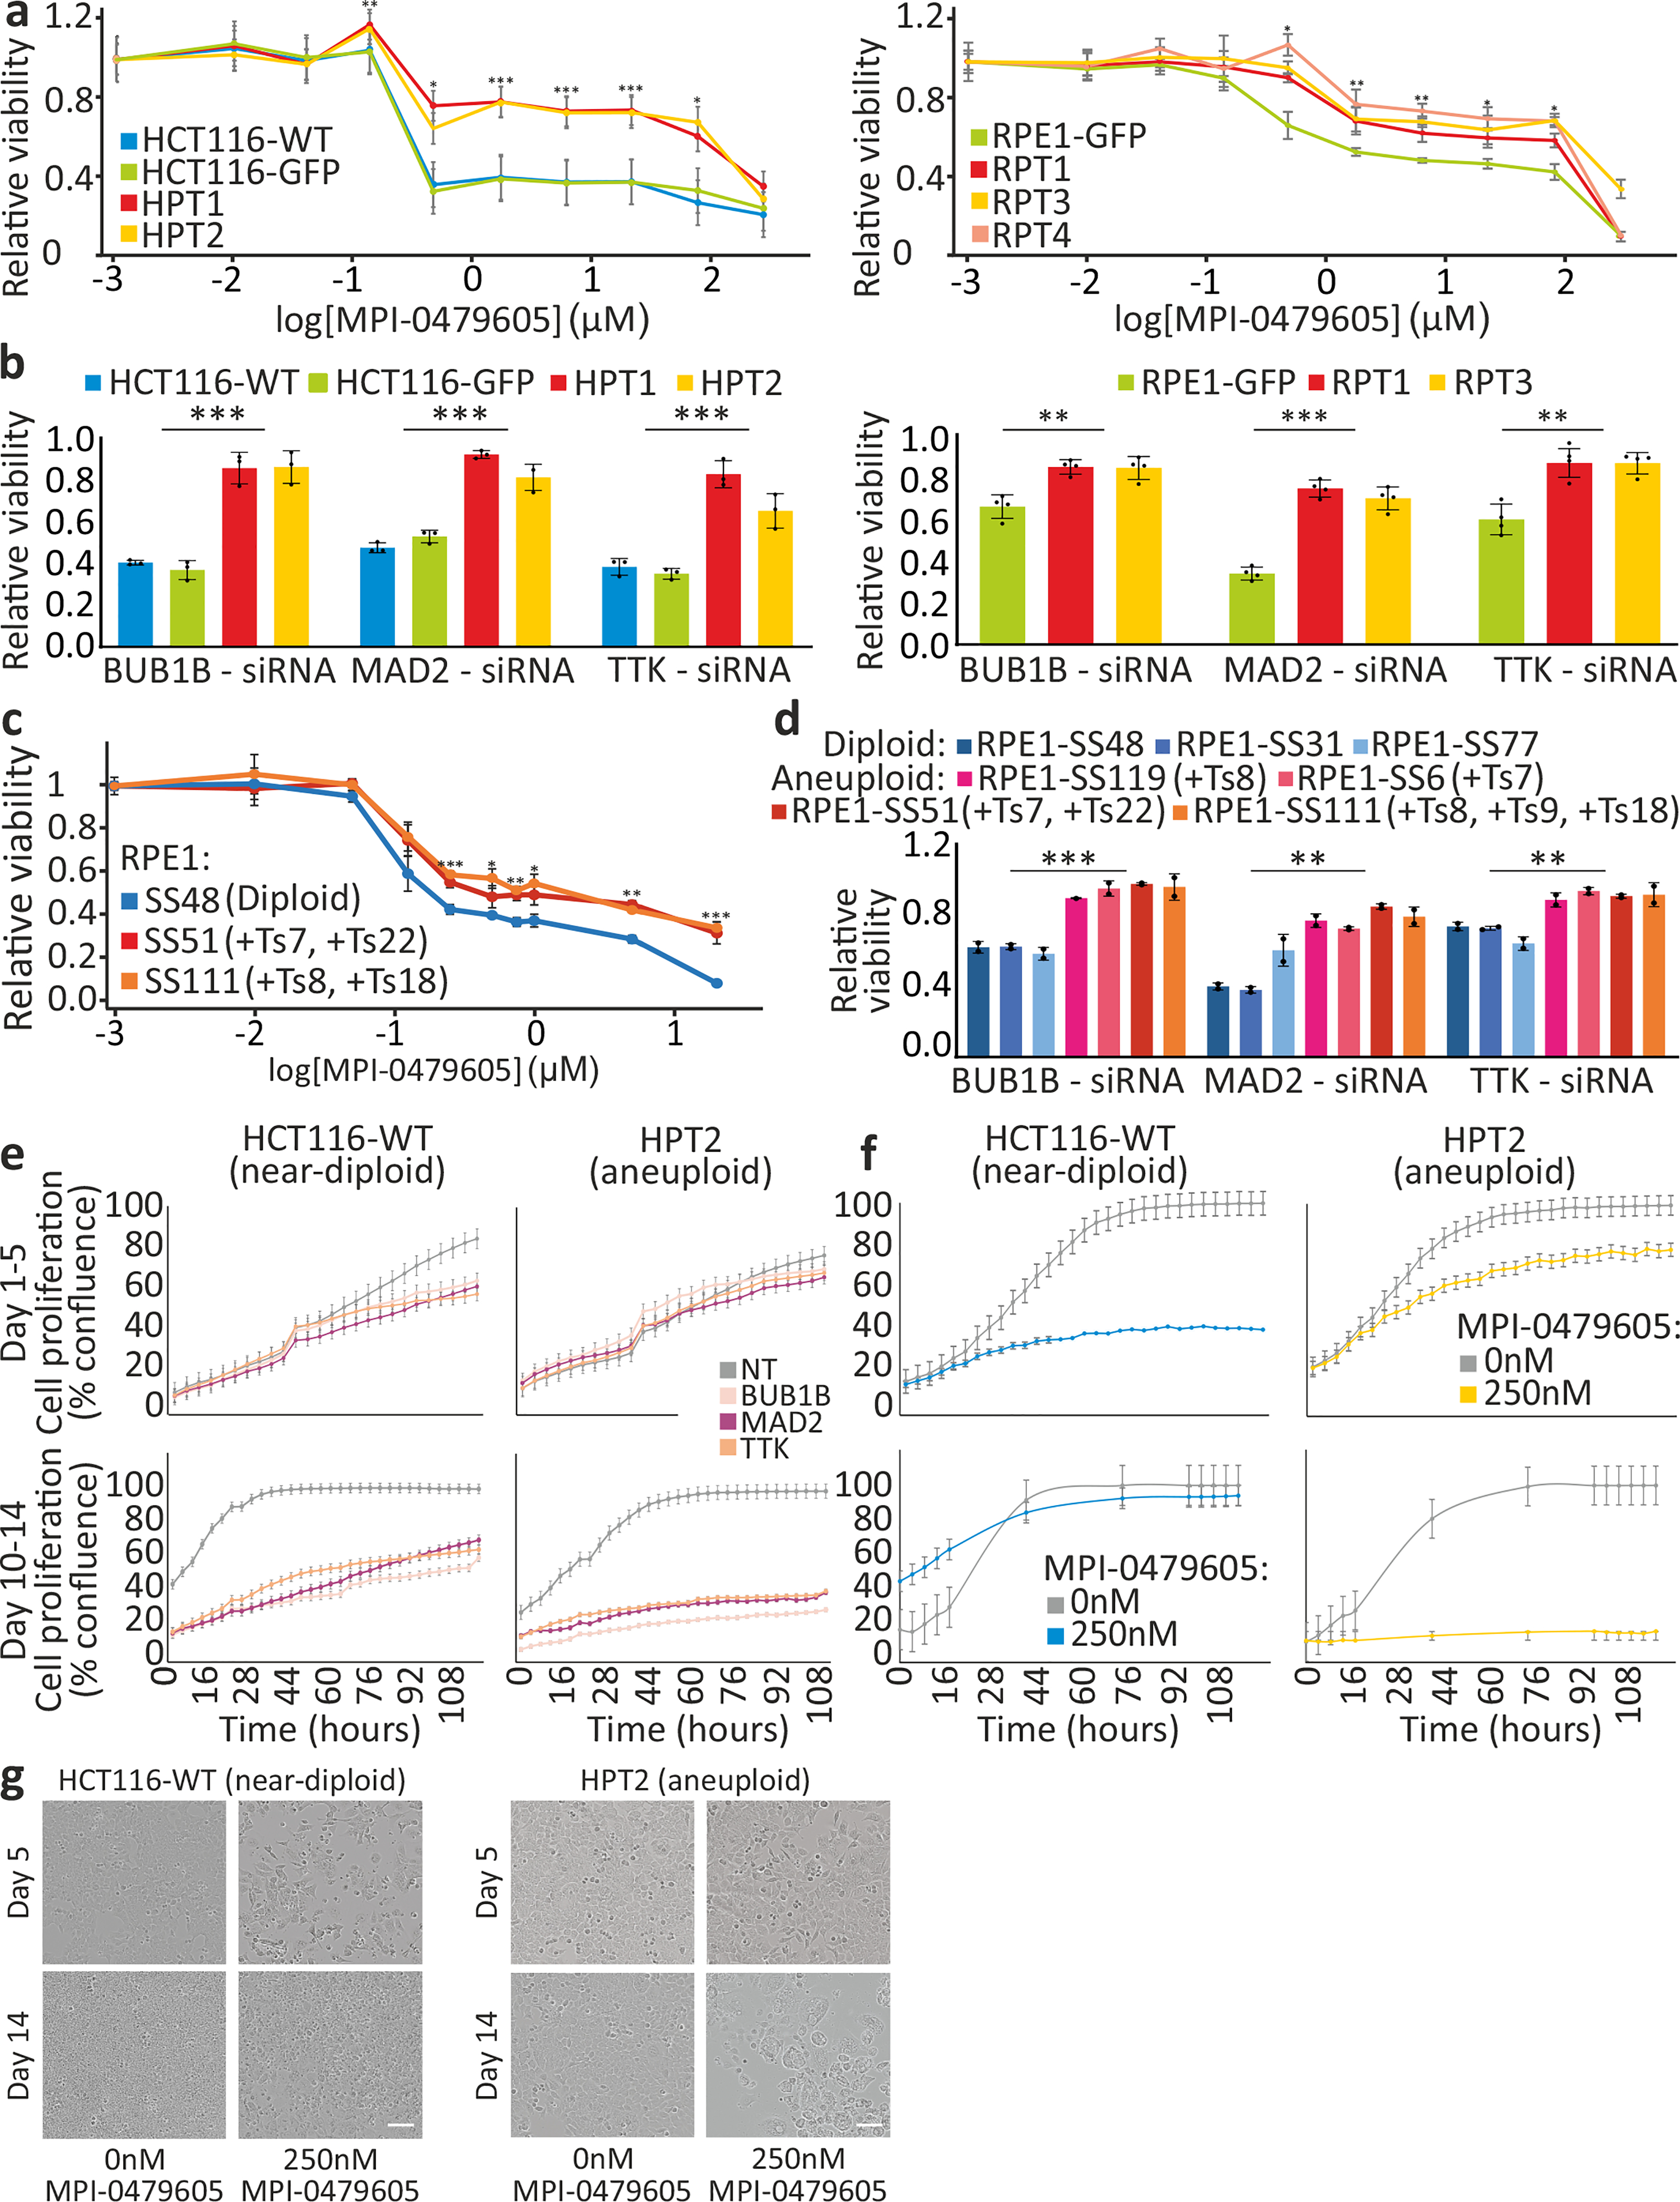
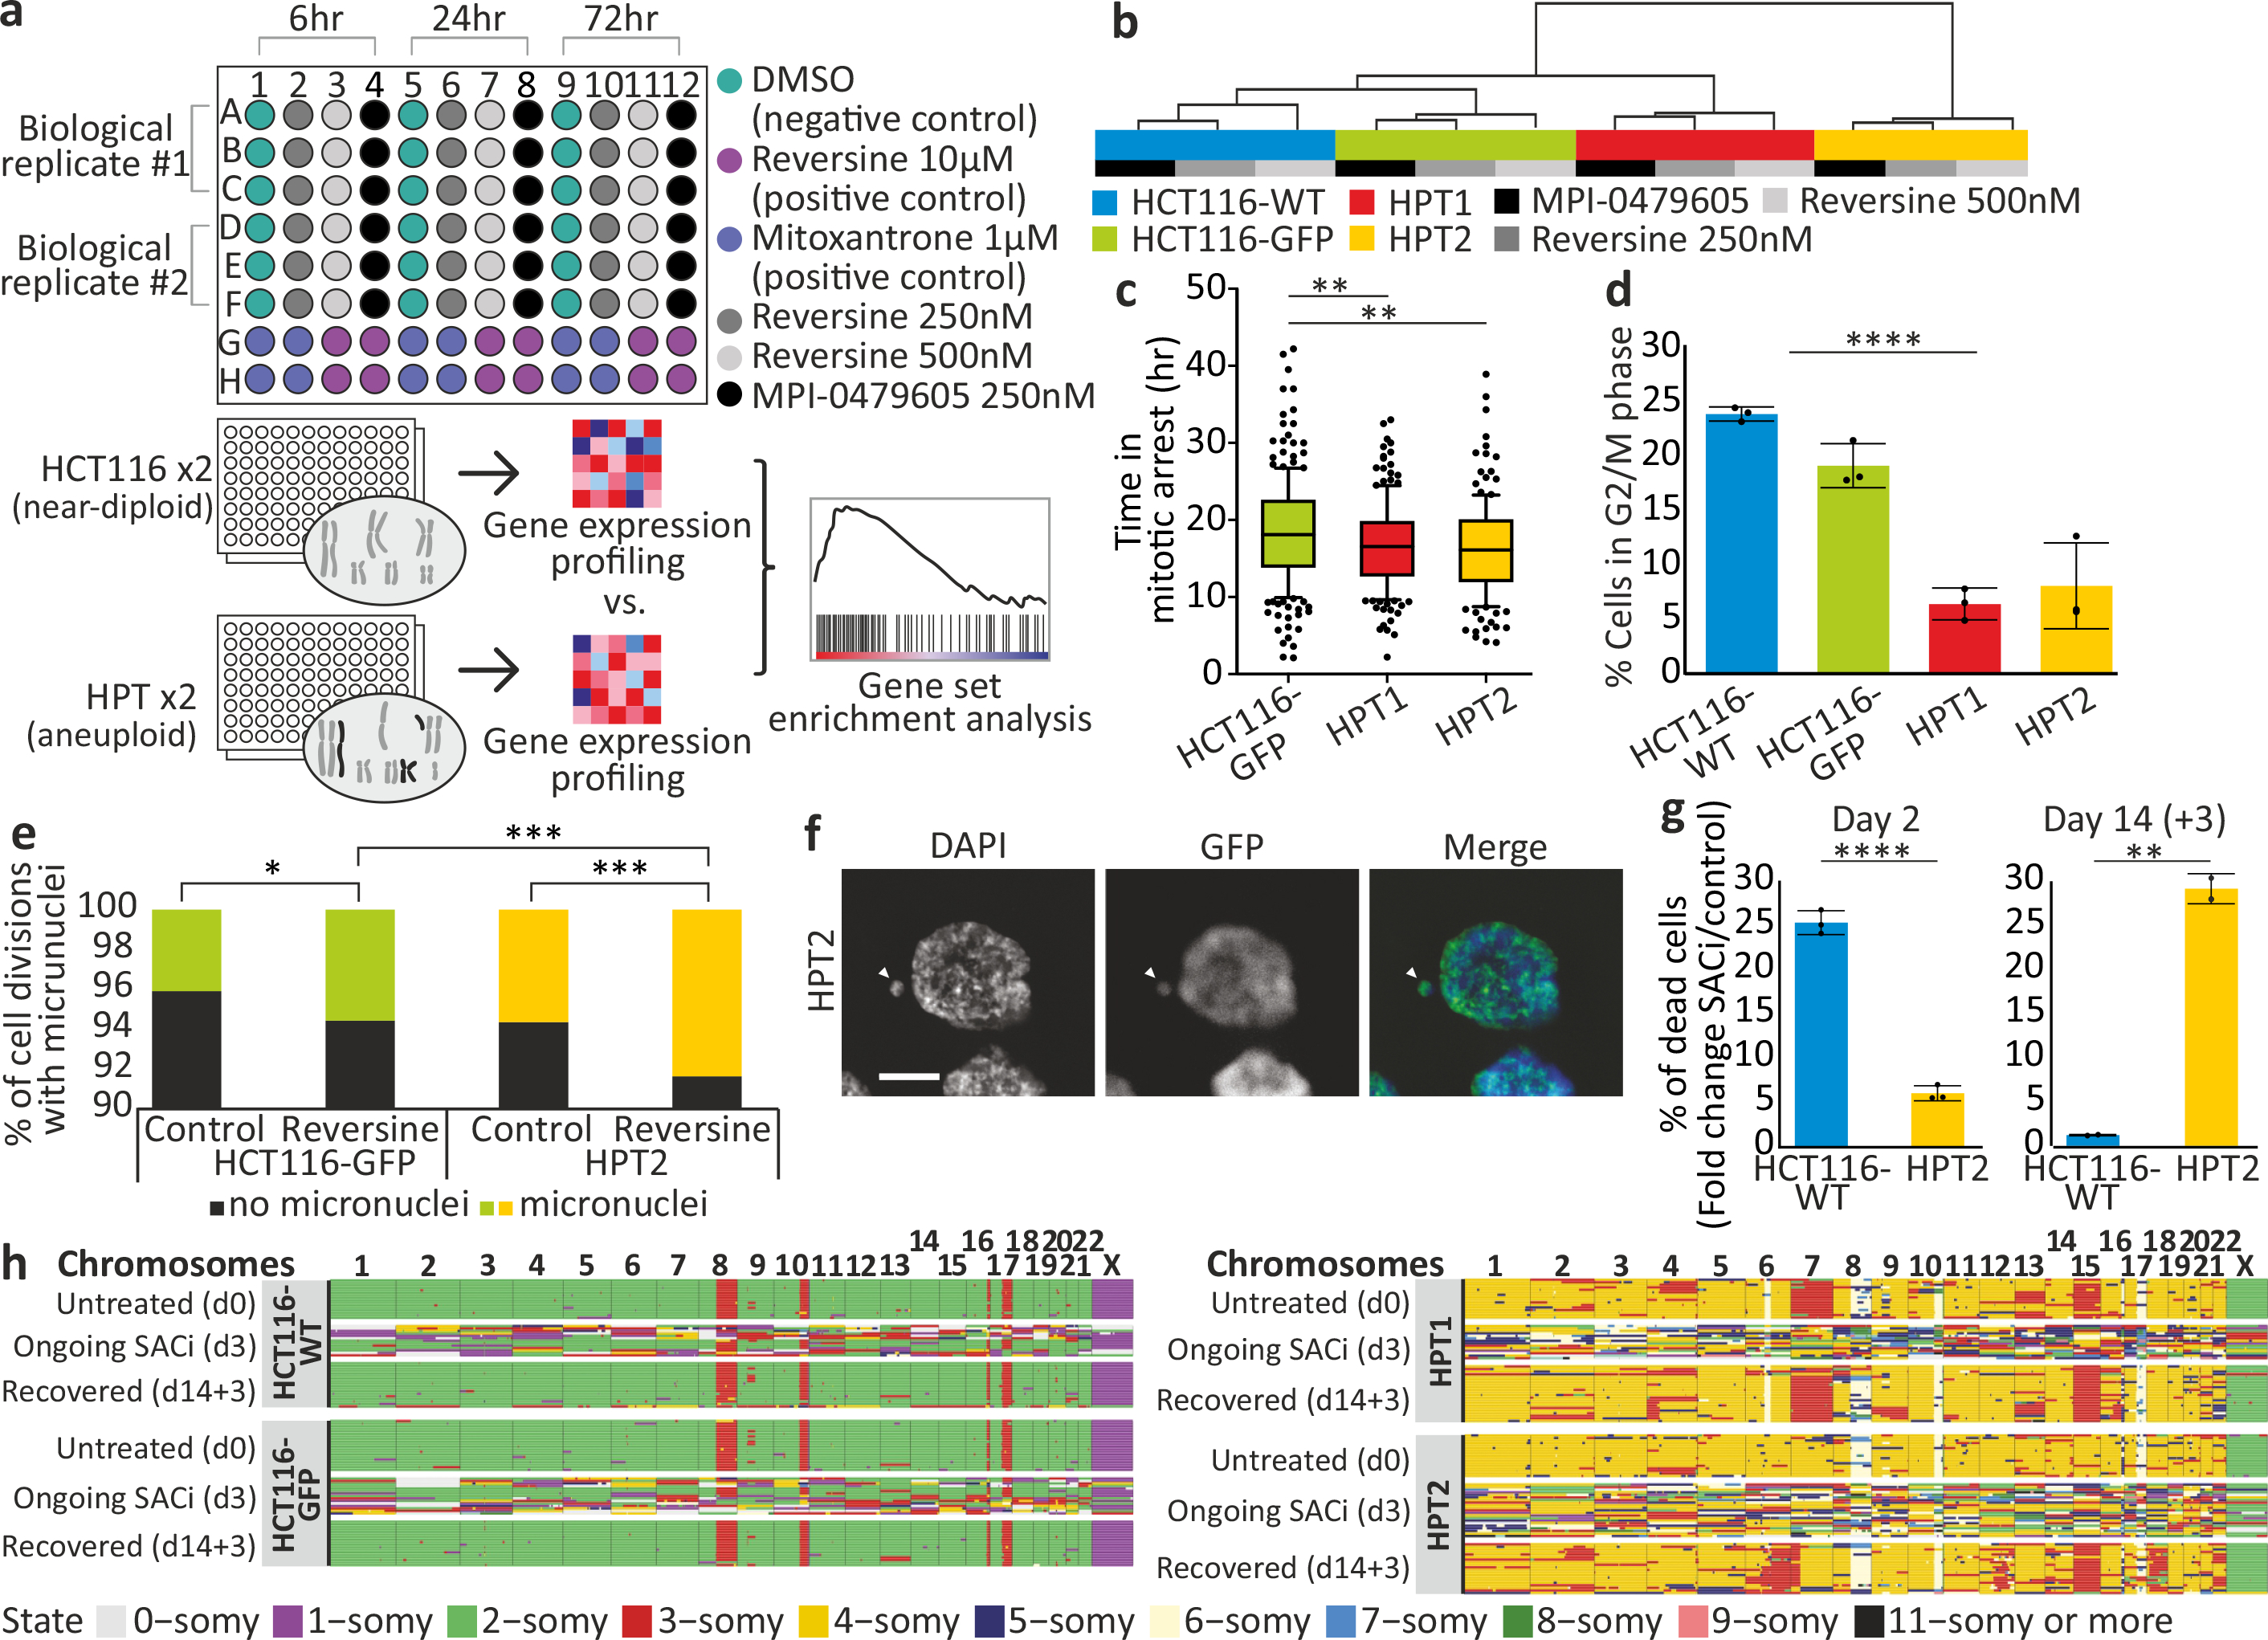
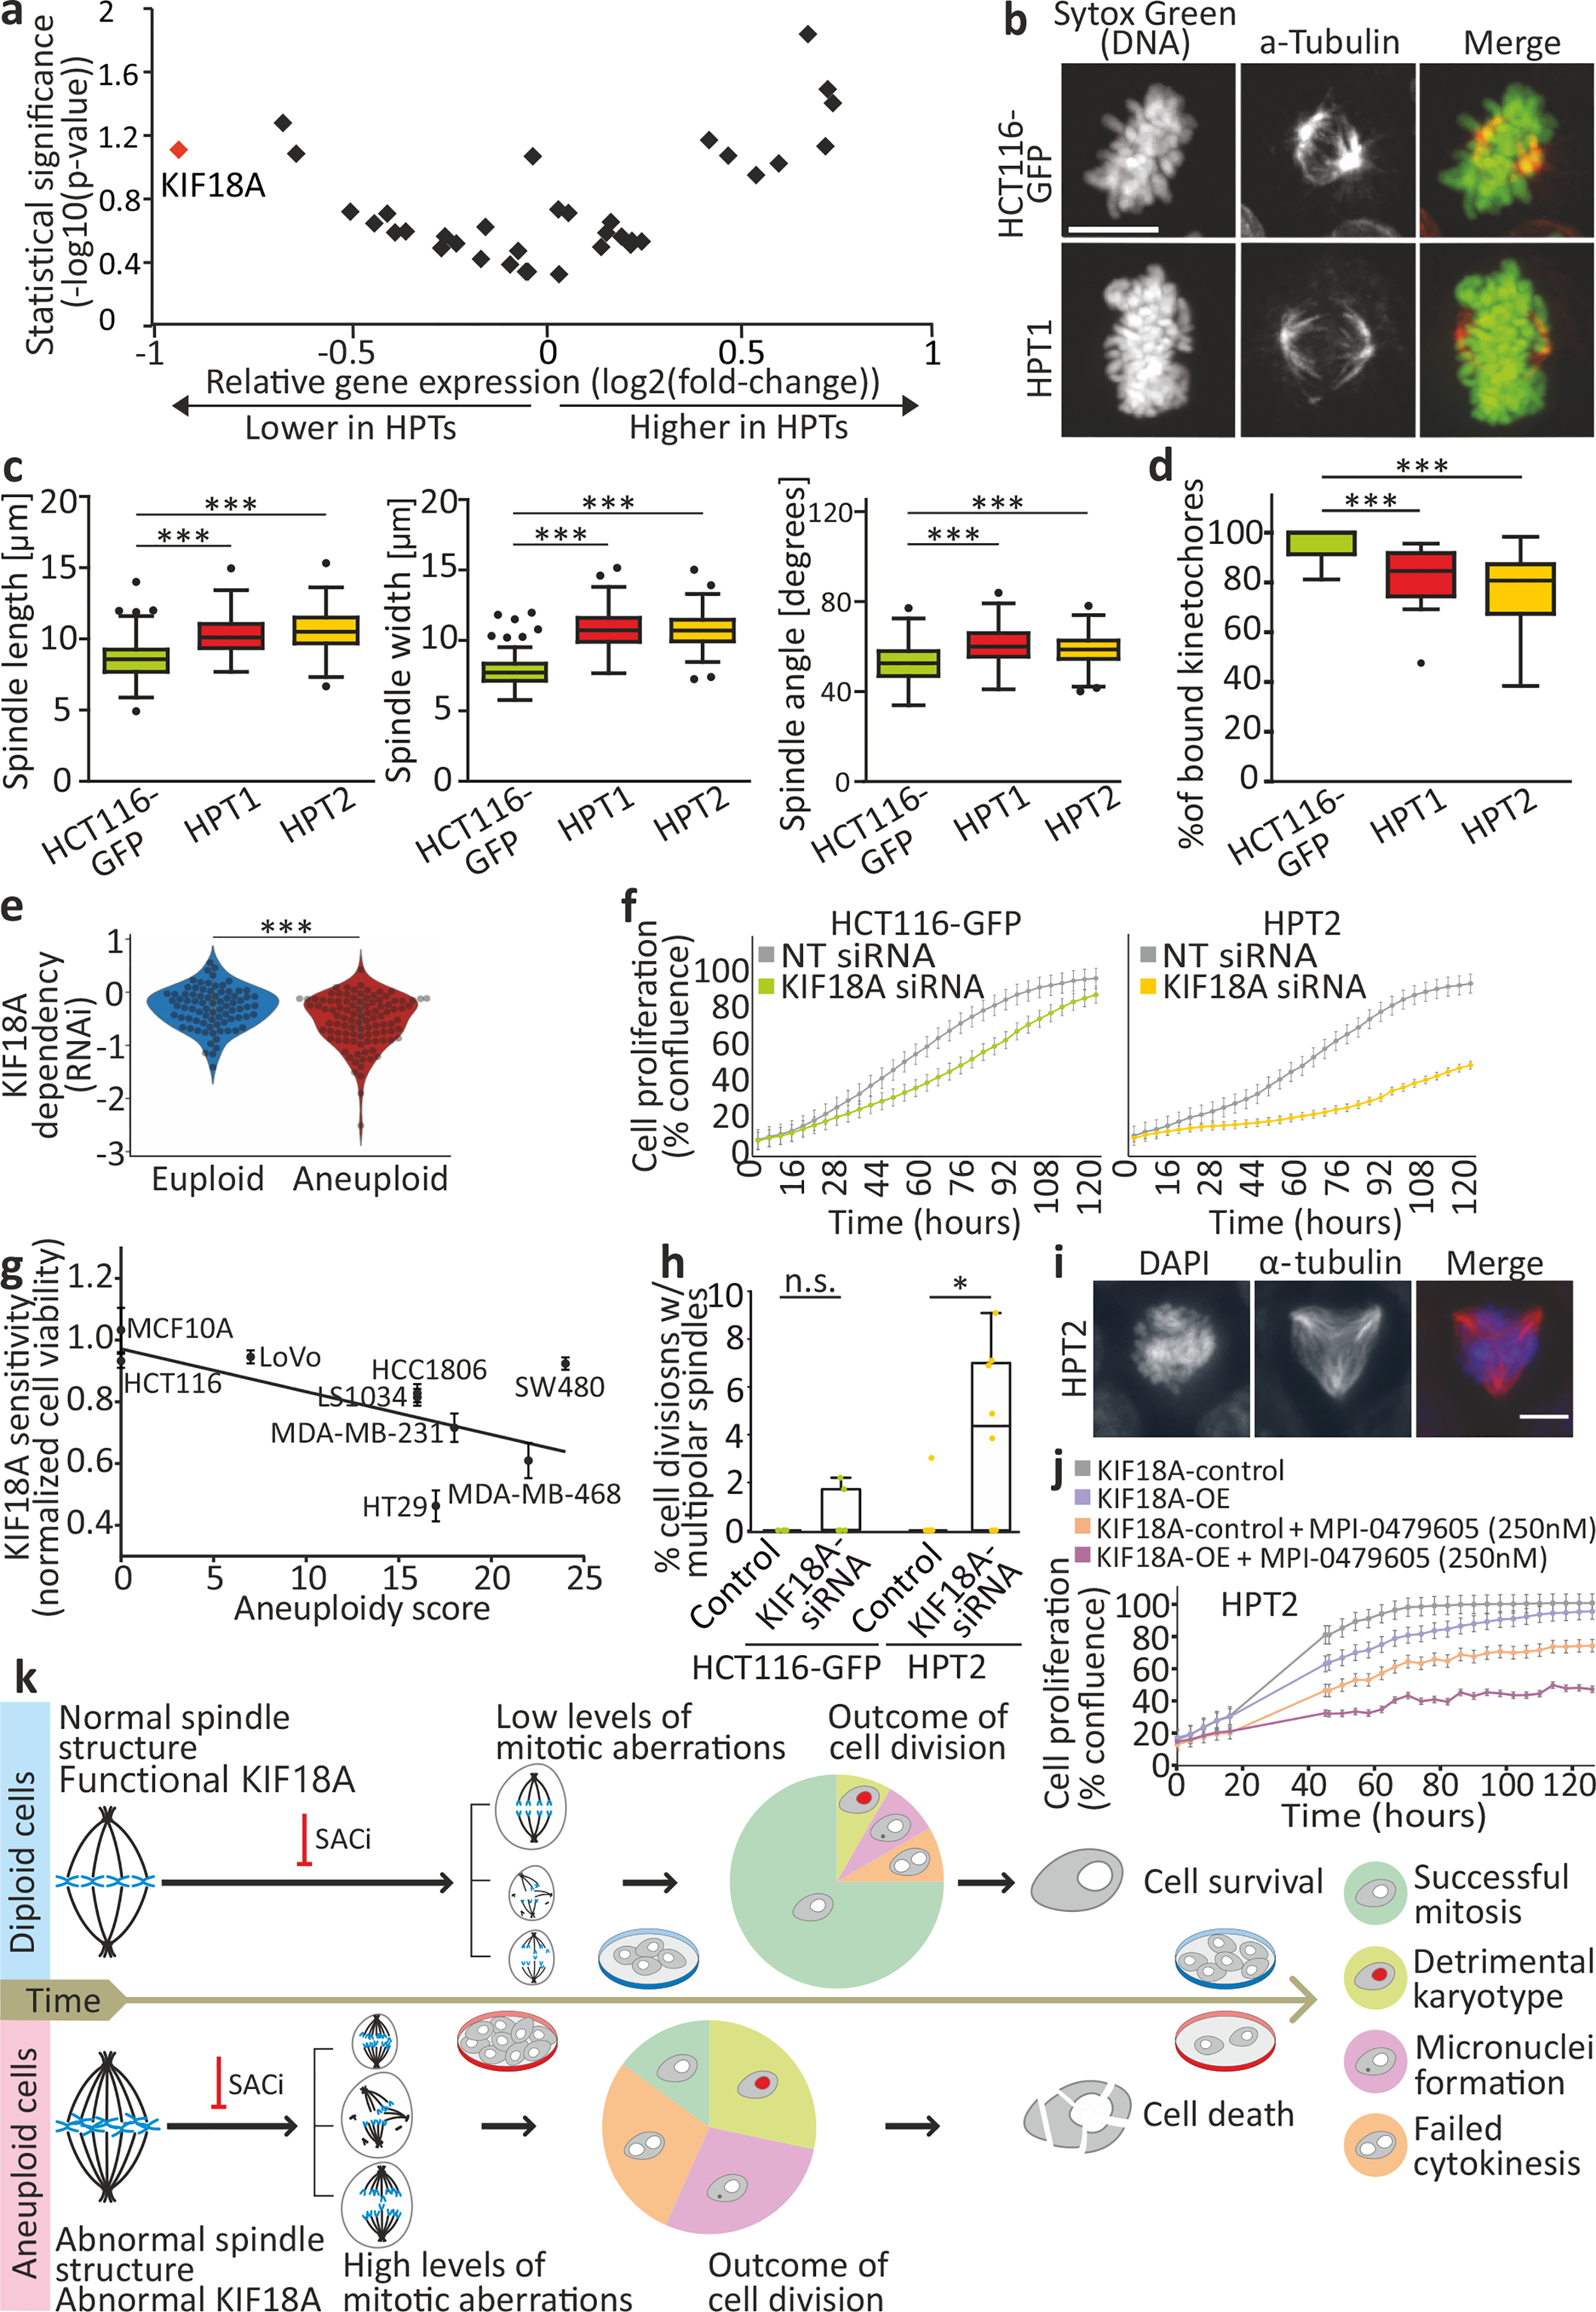
Selective targeting of aneuploid cells is an attractive strategy for cancer treatment1. However, it is unclear whether aneuploidy generates any clinically relevant vulnerabilities in cancer cells. Here we mapped the aneuploidy landscapes of about 1,000 human cancer cell lines, and analysed genetic and chemical perturbation screens2-9 to identify cellular vulnerabilities associated with aneuploidy. We found that aneuploid cancer cells show increased sensitivity to genetic perturbation of core components of the spindle assembly checkpoint (SAC), which ensures the proper segregation of chromosomes during mitosis10. Unexpectedly, we also found that aneuploid cancer cells were less sensitive than diploid cells to short-term exposure to multiple SAC inhibitors. Indeed, aneuploid cancer cells became increasingly sensitive to inhibition of SAC over time. Aneuploid cells exhibited aberrant spindle geometry and dynamics, and kept dividing when the SAC was inhibited, resulting in the accumulation of mitotic defects, and in unstable and less-fit karyotypes. Therefore, although aneuploid cancer cells could overcome inhibition of SAC more readily than diploid cells, their long-term proliferation was jeopardized. We identified a specific mitotic kinesin, KIF18A, whose activity was perturbed in aneuploid cancer cells. Aneuploid cancer cells were particularly vulnerable to depletion of KIF18A, and KIF18A overexpression restored their response to SAC inhibition. Our results identify a therapeutically relevant, synthetic lethal interaction between aneuploidy and the SAC.


Conflict of interest statement

Competing Interests

T.R.G. is a consultant to GlaxoSmithKline and is a founder of Sherlock Biosciences. R.B. own shares in Ampressa and receives grant funding from Novartis. A.J.B. receives funding from Merck, Bayer and Novartis, and is an advisor to Earli and Helix Nano and a co-founder of Signet Therapeutics. The other authors declare no competing interests.

Figures

Extended Data Figure 1:
Extended Data Figure 1:. Increased sensitivity of aneuploid cancer cells to genetic inhibition of the spindle assembly checkpoint.
(a) Copy number profiles of 5 representative breast cancer cell lines from the highly-aneuploid cell line group (top quartile of AS) and 5 representative breast cancer cell lines from the near-euploid cell line group (bottom quartile of AS). (b) A volcano plot showing the differential genetic dependencies between the near-euploid and highly-aneuploid cancer cell lines (top vs. bottom quartiles), based on the genome-wide DRIVE RNAi screen. BUB1B and MAD2, core members of the SAC, are highlighted in red. (c) A Venn diagram showing the overlap of the differentially-dependent genes (q<0.25) between the Achilles and DRIVE RNAi screens. ****, p=1e-16, two-tailed Fisher’s exact test. (d) The pathways enriched in the list of genes that are more essential in near-euploid than in highly-aneuploid cancer cell lines (effect size<−0.1, q<0.1) in the DRIVE RNAi screen, based on DAVID functional annotation enrichment analysis. The full list is available in Supplementary Table 3. *, Benjamini-corrected p-value<0.1; one-tailed Fisher’s Exact Test. (e) The sensitivity of near-euploid and highly-aneuploid cancer cell lines to the knockdown of BUB1B (left) and MAD2 (right) in the DRIVE RNAi screen. The more negative a value, the more essential the gene is in that cell line. ****, p=2e-06 and p=1e-04 for BUB1B and MAD2, respectively; two-tailed t-test. (f) A volcano plot showing the differential genetic dependencies between the near-euploid and highly-aneuploid cancer cell lines (top vs. bottom 10% of cell lines), based on the genome-wide DRIVE RNAi screen. BUB1B, MAD2 and KIF18A are highlighted in red. (g) The sensitivity of near-euploid and highly-aneuploid cancer cell lines to the knockdown of BUB1B (left) and MAD2 (right) in the DRIVE RNAi screen (top vs. bottom 10% of cell lines). The more negative a value, the more essential the gene is in that cell line. *, p=0.037; ***, p=5e-04; two-tailed t-test. (h) Comparison of protein expression levels of BUB1B (left) and MAD2 (right) between near-euploid and highly-aneuploid cancer cell lines. n.s., p>0.05; **, p=0.001; for BUB1B and MAD2, respectively; two-tailed t-test. (i) The correlations between the mRNA expression levels of BUB1B (top) and MAD2 (bottom) and the genetic dependency on these genes in the Achilles (left) and DRIVE (right) RNAi screens. Spearman’s ρ=0.36 (p=3e-08), 0.31 (p=2e-06), 0.26 (p=4e-04) and 0.40 (p=2e-08), respectively. (j) The correlations between the protein expression levels of BUB1B (top) and MAD2 (bottom) and the genetic dependency on these genes in the Achilles (left) and DRIVE (right) RNAi screens. Spearman’s ρ=0.11 (p=0.09), 0.26 (p=4e-05), 0.14 (p=0.016) and 0.24 (p=5e-05), respectively. (k) The mRNA expression levels of BUB1B (left) and MAD2 (right) in near-euploid and highly-aneuploid cancer cell lines across multiple cell lineages. *, p<0.05; two-tailed t-test.
Extended Data Figure 2:
Extended Data Figure 2:. Genomic and phenotypic features associated with the degree of aneuploidy in human cancer cell lines.
(a) The AS distribution across 23 cancer types. Bar, median; box, 25th and 75th percentile; whiskers, 1.5 X interquartile range, individual cell lines. (b) Comparison of AS between cancer cell lines with distinct TP53 mutation status (based on CCLE annotations). ****, p=6e-15 and p=1e-22 for the comparisons between TP53-WT and ‘damaging’ and TP53-WT and ‘hotspot’ mutations, respectively; two-tailed t-test. (c) Comparison of AS between cancer cell with distinct genome doubling (WGD) status. ****, p=1e-192, p=2e-96 and p=6e-13 for the comparisons between WGD=0 and WGD=1, WGD=0 and WGD=2, and WGD=1 and WGD=2, respectively; two-tailed t-test. (d) Comparison of the HET70 score, a measure of karyotypic instability, between the near-diploid and highly-aneuploid cell line groups. ****, p=2e-08; two-tailed t-test. (e) Comparison of doubling time between the near-diploid and highly-aneuploid cell line groups. **, p=0.005; two-tailed t-test.
Extended Data Figure 3:
Extended Data Figure 3:. Increased sensitivity of aneuploid cancer cells to SACi remains significant when associated genomic and phenotypic features are controlled for.
(a) The sensitivity of near-euploid and highly-aneuploid cancer cell lines to the knockdown of BUB1B (top) and MAD2 (bottom) in the Achilles (left) and DRIVE (right) RNAi screens across multiple cell lineages. *, p<0.05; **, p<0.01; two-tailed t-test. (b) The sensitivity of near-euploid and highly-aneuploid cancer cell lines to the knockdown of BUB1B (top) and MAD2 (bottom) in the Achilles (left) and DRIVE (right) RNAi screens, after accounting for lineage-specific differences in gene dependency scores using linear regression. ***, p=2e-04; * p=0.013; for RNAi-Achilles BUB1B and MAD2 dependencies, respectively; ***, p=5e-04; *, p=0.044; RNAi-DRIVE BUB1B and MAD2 dependencies, respectively; one-tailed t-test. (c) The sensitivity of near-euploid and highly-aneuploid cancer cell lines to the knockdown of BUB1B (top) and MAD2 (bottom) in the Achilles (left) and DRIVE (right) RNAi screens, across TP53 mutation classes. *, p<0.05; **, p<0.01, ***, p<0.001; two-tailed t-test. (d) The correlations between AS and the dependency on BUB1B (top) and MAD2 (bottom) in the Achilles (left) and DRIVE (right) RNAi screens, for cell lines that have not undergone whole-genome duplication (i.e., cell lines with basal ploidy of n=2). Spearman’s ρ = −0.32 (p=1e-05), −0.36 (p=7e-07), −0.30 (p=1e-04) and −0.28 (p=4e-04), respectively. (e) The sensitivity of near-euploid and highly-aneuploid cancer cell lines to the knockdown of BUB1B (top) and MAD2 (bottom) in the Achilles (left) and DRIVE (right) RNAi screens, after removing the effect of doubling time on gene dependency scores using linear regression. ****, p=1e-05 and p=9e-07, for RNAi-Achilles BUB1B and MAD2 dependencies, respectively; ****, p=1e-07; **, p=0.002; for RNAi-Achilles BUB1B and MAD2 dependencies, respectively; two-tailed t-test. (f) The sensitivity of near-euploid and highly-aneuploid cancer cell lines without microsatellite instability (MSS lines only) to the knockdown of BUB1B (top) and MAD2 (bottom) in the Achilles (left) and DRIVE (right) RNAi screens. ****, p=7e-07 and p=2e-07, for RNAi-Achilles BUB1B and MAD2 dependencies, respectively; ****, p=6e-07, for RNAi-DRIVE BUB1B dependency; ***, p=1e-04; two-tailed t-test. (g) The sensitivity of near-euploid and highly-aneuploid cancer cell lines to the knockdown of BUB1B (top) and MAD2 (bottom) in the Achilles (left) and DRIVE (right) RNAi screens, in cell lines that are WT for the 4 genes most selectively mutated in aneuploid human tumors (after TP53). **, p<0.01, ***, p<0.001; ****, p<1e-04; two-tailed t-test. (h) The sensitivity of near-euploid and highly-aneuploid cancer cell lines to the knockdown of BUB1B (top) and MAD2 (bottom) in the Achilles (left) and DRIVE (right) RNAi screens, after removing the effect of lineage subtype on gene dependency scores using linear regression. ***, p=4e-04; * p=0.015, for RNAi-Achilles BUB1B and MAD2 dependencies, respectively; **, p=0.002; * p=0.045, for RNAi-DRIVE BUB1B and MAD2 dependencies, respectively; one-tailed t-test. (i) The sensitivity of near-euploid and highly-aneuploid cancer cell lines to the knockdown of BUB1B (top two plots) and MAD2 (bottom two plots) in the Achilles (top) and DRIVE (bottom) RNAi screens, after removing the effect of HET70 scores on gene dependency scores using linear regression. ****, p=9e-07, p=8e-06 and p=5e-07 for RNAi-Achilles BUB1B, RNAi-Achilles MAD2 and RNAi-DRIVE BUB1B dependencies, respectively; **, p=0.001; two-tailed t-test.
Extended Data Figure 4:
Extended Data Figure 4:. Reduced sensitivity of aneuploid cancer cells to chemical inhibition of the spindle assembly checkpoint.
(a) Volcano plots showing the differential drug sensitivities between the near-euploid and highly-aneuploid cancer cell lines, based on the large-scale GDSC and PRISM screens. MPS1-IN-1 and MPI-0479605, the only SAC inhibitors included in each screen, respectively, are highlighted in red. (b) The sensitivity of near-euploid and highly-aneuploid cancer cell lines to the SAC inhibitors MPS1-IN-1 and MPI-0479605 in the GDSC (left) and PRISM (right) screens. ****, p=1e-0.5; n.s., p=0.23; two-tailed t-test. (c) Experimental validation of the response of 5 near-euploid (CAL51, EN, MHHNB11, SW48 and VMCUB1) and 5 highly-aneuploid (MDAMB468, NCIH1693, PANC0813, SH10TC and A101D) cell lines to 72hr exposure to the SAC inhibitor reversine. *, p=0.016, two-tailed Wilcoxon rank-sum test; n=5 cell lines in each group. Bar, median; box, 25th and 75th percentile; whiskers, 1.5 X interquartile range. (d) Comparison of the sensitivity to reversine between near-euploid and highly-aneuploid cancer cell lines subjected to the PRISM cell viability assay, confirming the reduced sensitivity of highly-aneuploid cells to a 120hr exposure to SAC inhibitors. n.s., p>0.05; *, p<0.05; **, p<0.01; two-tailed t-test. (e) An association analysis failed to identify a genomic biomarker of reversine sensitivity. Shown are the top 1000 genomic features identified by our model (see Methods). No feature stands out in terms of importance and/or correlation, and the overall predictive value is poor.
Extended Data Figure 5:
Extended Data Figure 5:. Isogenic model systems of near-diploid and aneuploid cell lines.
(a) scDNAseq-based copy number profiling of the HPT1 and HPT2 aneuploid cell lines. (b) Karyotyping-based chromosome count of the near-diploid HCT116 cells and their highly-aneuploid HPT derivatives. Each dot represents a metaphase spread. Average chromosome number: n=45, n=75 and n=78, for HCT116-GFP, HPT1 and HPT2, respectively. (c) Karyotyping-based chromosome count of the near-diploid RPE1 cells and their highly-aneuploid RPT derivatives. Each dot represents a metaphase spread. Average chromosome number: n=46, n=80 and n=76.5, for RPE1-GFP, RPT1 and RPT2, respectively. (d) Low-pass whole-genome sequencing-based karyotyping of near-diploid and aneuploid RPE1 clones. No karyotypic changes have been observed between passage 0 (p0) and passage 10 (p10) of each clone. Red, large (>5Mb) gains (log2CN>0.3); blue, large (>5Mb) losses (log2CN<−0.3).
Extended Data Figure 6:
Extended Data Figure 6:. The effect of aneuploidy on cellular sensitivity to SACi in isogenic human cell lines.
(a) Left: dose response curves of the response of near-diploid HCT116 cells and their highly-aneuploid derivatives HPT cells, to the SAC inhibitor reversine following 120hr of drug exposure. EC50 = 0.11μM, 0.11μM, 2.32μM and 1.06μM, for HCT116-WT, HCT116-GFP, HPT1 and HPT2, respectively. Right: dose response curves of the response of near-diploid RPE1 cells and their highly-aneuploid derivatives RPT cells, to the SAC inhibitor reversine following 120hr of drug exposure. EC50 = 0.13μM, 1.82μM, 0.57μM and 2.07μM, for RPE1-GFP, RPT1, RPT3 and RPT4, respectively. *, p<0.05; **, p<0.01; ***, p<0.001; two-tailed t-test. Data represent the mean ± s.d.; n=3 biological replicates. (b) Time-lapse imaging-based proliferation curves of HCT116 and HPT cells under standard culture conditions. Data represent the mean ± s.d.; n=3 biological replicates. (c) Dose response curves of the response of HCT116 and HPT cells to three drugs with unrelated mechanisms of action. Doxorubicin EC50 = 0.61μM, 0.32μM, 1.2μM and 0.89μM; Nutlin-3 EC50 = 11.88μM, 19.28μM, 15.26μM and 65.11μM; Imatinib EC50 = 17.94μM, 19.08μM, 18.77μM and 23.31μM; for HCT116-WT, HCT116-GFP, HPT1 and HPT2, respectively. (d) Relative mRNA expression levels of BUB1B, MAD2 and TTK, confirming successful siRNA-mediated knockdown of each gene in all cell lines. *, p=0.011, p=0.012 for HCT116-GFP and HPT1, respectively; **, p=0.0019, p=0.0015, p=0.0039 for BUB1B in HCT116-WT, HPT1 and HPT2, respectively; p=0.0021, p=0.0013 for MAD2 in HCT116-WT and HPT2, respectively; p=0.0011, p=0.0012 for TTK in HCT116-WT and HPT2, respectively; ***, p=0004, p=0.0005 for MAD2 and TTK in HCT116-GFP, respectively; ****, p=9e-05; one-tailed t-test; n=3 biological replicates. Data represent the mean ± s.e.m. (e) The relative viability of 4 near-diploid (CAL51, EN, MHHNB11, VMCUB1) and 3 highly-aneuploid (MDAMB468, PANC0813, SH0TA) cancer cell lines following 72hr of siRNA-mediated knockdown of 3 SAC components: BUB1B, MAD2 and TTK. Results are normalized to a non-targeting siRNA control. *, p=0.010, p=0.016, and p=0.015, for BUB1B, MAD2 and TTK, respectively; two-tailed t-test. Error bars, s.d. (f) Dose response curves of the response of the near-diploid RPE1 clone SS48 and its isogenic aneuploid clones SS51 (+Ts7, +Ts22) and SS111 (+Ts8, +Ts9, +Ts18), to the SAC inhibitor reversine following 120hr of drug exposure. EC50 = 0.66μM, 1.03μM and 1.03μM, for SS48, SS51 and SS111, respectively *, p<0.05; **, p<0.01; ***, p<0.001; two-tailed t-test. Data represent the mean ± s.d.; n=3 biological replicates.
Extended Data Figure 7:
Extended Data Figure 7:. Time-dependent increased sensitivity of aneuploid cancer cells to genetic and chemical SACi.
(a) Comparison of the doubling times of HCT116 and HPT cells exposed to siRNAs against BUB1B, MAD2 or TTK. The drug effect of SACi is stronger in the near-diploid HCT116 cells at d5, but is stronger in the highly-aneuploid HPT cells at d21. (b) Comparison of the doubling times of HCT116 and HPT cells exposed to the SAC inhibitors MPI-0479605 or reversine. The drug effect of SACi is stronger in the near-diploid HCT116 cells at d5, but at d21 it becomes stronger in the highly-aneuploid HPT cells. *, p=0.034, p=0.046 and p=0.049 for MPI-0479605 and reversine at d5 and d14, respectively; **, p=0.0015; one-tailed t-test; n=2 independent cell lines. (c) Representative images of cells from the drug experiment (same images as in Fig. 2g), with cell masking performed using the image analysis software ilastik. Scale bar, 100μm. (d) The relative viability of the aneuploid RPE1 clones, SS111 and SS51, following reversine exposure. The viability effect was normalized to the effect of the drug in the near-diploid RPE1 clone, SS48. The drug effect of SACi is comparable during the first week of drug exposure, but the highly-aneuploid cells become significantly more sensitive with time. *, p=0.045, **, p=0.002, p=0.001 and p=0.005 for the comparisons between d3 and d14, d5 and d14 and d7 and d14, respectively; two-tailed t-test. (e) The relative viability of 5 near-euploid (CAL51, EN, MHHNB11, SW48 and VMCUB1) and 5 highly-aneuploid (MDAMB468, NCIH1693, PANC0813, SH10TC and A101D) cell lines to 72hr and 14d exposure to the SAC inhibitor reversine. *, p=0.012 and p=0.037, for 3d and 14d time points, respectively; two-tailed Wilcoxon rank-sum test.
Extended Data Figure 8:
Extended Data Figure 8:. Transcriptional and cellular characterization of SACi in aneuploid cells.
(a) The top 10 results of a Connectivity Map (CMap) query of the transcriptional response of HCT116 and HPT cells to the SAC inhibitors, reversine (250nM and 500nM) and MPI-0479605 (250nM). The top connection is “Cell cycle inhibition”, correctly identifying the expected mechanism of action of these compounds. GOF, gain of function; OE, over-expression; KD, knockdown. (b) Functional enrichment of gene sets related to cell cycle regulation. Shown are the gene sets that were significantly more affected by SACi in the highly-aneuploid HPT1 and HPT2 cells than in the nearly-diploid HCT116-WT and HCT116-GFP cells. *, p<0.05, one-tailed Fisher’s exact test. (c) Functional enrichment of gene sets related to cell death. Shown are the gene sets that were significantly more affected by SACi in the highly-aneuploid HPT1 and HPT2 cells than in the nearly-diploid HCT116-WT and HCT116-GFP cells. *, p<0.05, one-tailed Fisher’s exact test. (d) The mitotic index of HCT116 and HPT cells cultured under standard conditions or exposed to the SAC inhibitor reversine (500nM) for 24hr. *, p=0.035; n.s., p=0.17; two-tailed t-test; Error bars, s.d.; n=3 biological replicates. (e) Imaging-based quantification of the prevalence of cell divisions with multipolar spindles in HCT116 and HPT cell lines cultured under standard conditions or treated with reversine (500nM) for 24hr; n=3 biological replicates. Error bars, s.d. (f) The prevalence of premature mitotic exit (cytokinesis failure) in HCT116 and HPT cells exposed to the SAC inhibitor reversine (500nM) for 24hr. *, p=0.047; two-tailed Fisher’s exact test. (g) Representative images of premature mitotic exit in HPT2 cells exposed to reversine (500nM). T=0 defines nuclear envelope breakdown (NEB). Scale bar, 10μm. (h) The prevalence of micronuclei formation in RPE1 and RPT cells cultured under standard conditions or exposed to the SAC inhibitor reversine (500nM) for 24hr. n.s., p>0.05; *, p=0.013 and p=0.015 for the differences between the treated and untreated RPT1 and RPT3 cells, respectively; **, p=0.004; ***, p<0.0002; two-tailed t-test. (i) The prevalence of cell divisions with multipolar spindles in RPE1 and RPT cells cultured under standard conditions or exposed to the SAC inhibitor reversine (500nM) for 24hr. n.s., p>0.05; *, p=0.028; two-tailed t-test. Error bars, s.d. (j) The prevalence of premature mitotic exit (cytokinesis failure) in RPE1 and RPT cells exposed to the SAC inhibitor reversine (500nM) for 24hr. *, p=0.044 and p=0.019 for the comparisons between RPE1 and RPT1 or RPT3, respectively; two-tailed t-test. (k) Chromosomal copy number states of HCT116 and HPT cells at each of the 3 time points that were sequenced by scDNAseq. Differences between the pre-treated (d3) and post-treated (d14+3) populations are highlighted. (l) Chromosomal heterogeneity scores of the HCT116 and HPT cells at each of the 3 time points. Highly-heterogeneous chromosomes in the post-treated populations (d14+3) are highlighted; n=23 chromosomes. (m) Comparison of the chromosomal heterogeneity scores between the near-diploid HCT116 cells and the highly-aneuploid HPT cells. Bar, median; box, 25th and 75th percentile; whiskers, 1.5 X interquartile range; circles, individual chromosomes. ****, p=2e-09; two-tailed t-test.
Extended Data Figure 9:
Extended Data Figure 9:. Increased sensitivity of aneuploid cancer cells to perturbation of the mitotic kinesin KIF18A.
(a) Left: Western blot of KIF18A protein expression levels in HCT116 and HPT cell lines. Right: Quantification of KIF18A expression levels (normalized to GAPDH). **, p=0.002; two-tailed t-test; n=5 biological replicates. (b) Left: Imaging kinetochore-bound KIF18A protein levels in HCT116-GFP, HPT1 and HPT2 cells, Scale bars, 10μm. Right: Immunofluorescence-based quantification of KIF18A protein levels. **, p<0.01, two-tailed t-test. Bar, median; box, 25th and 75th percentile; whiskers, 1.5 X interquartile range. (c) Schematics of the definitions of spindle length, width and angle. (d) Left: Imaging-based quantification of microtubule polymerization rate in HCT116 and HPT cells cultured under standard conditions. Right: Imaging-based quantification of microtubule regrowth following complete depolymerization in HCT116 and HPT cells. Bar, median; box, 25th and 75th percentile; whiskers, 1.5 X interquartile range; circles, individual cell lines. *, p<0.05; **, p<0.01; ****, p<1e-4; two-tailed t-test. (e) Imaging-based quantification of EB1α-tubulin co-localization in HCT116 and HPT cells cultured under standard conditions. **, p<0.01. Bar, median; box, 25th and 75th percentile; whiskers, 1.5 X interquartile range. (f) The sensitivity of near-euploid and highly-aneuploid cancer cell lines to the knockout of KIF18A in the CRISPR-Achilles dataset. The more negative a value, the more essential the gene is in that cell line. *, p=0.034; two-tailed t-test. (g) The sensitivity of near-euploid and highly-aneuploid cancer cell lines to the knockdown of KIF18A in the DRIVE RNAi screen (top vs. bottom 10% of cell lines). The more negative a value, the more essential the gene is in that cell line. ****, p=3e-06; two-tailed t-test. (h) Comparison of the mRNA expression levels of KIF18A between near-euploid and highly-aneuploid cancer cell lines. n.s., p>0.05; two-tailed t-test. (i) Comparison of the protein expression levels of KIF18A between near-euploid and highly-aneuploid cancer cell lines. n.s., p>0.05; two-tailed t-test. (j) The correlation between KIF18A mRNA expression and the genetic dependency on this gene in the Achilles-RNAi screen. Spearman’s ρ = 0.17 (p=0.004) (k) The correlation between KIF18A protein expression and the genetic dependency on this gene in the Achilles-RNAi screen. Spearman’s ρ=0.25 (p=0.009). (l) Relative mRNA expression levels of KIF18A, confirming successful siRNA-mediated KD in all cell lines 72hr post-transfection. **, p=0.006, p=0.003 and p=0.002 for HCT116-GFP, HPT1 and HPT2, respectively; ***, p=0.0007; one-tailed t-test. (m) Proliferation curves of HCT116 and HPT1 cells cultured in the presence of a KIF18A-targeting siRNA, or a non-targeting control siRNA. (n) Comparison of the doubling times of HCT116 and HPT cells following siRNA-mediated KIF18A knockdown. **, p=0.001; two-tailed t-test. (o) Time-lapse imaging-based quantification of the time from nuclear envelope breakdown (NEBD) to anaphase onset in HCT116 and HPT cell lines exposed to non-targeting or KIF18A-targeting siRNAs for 72hr. n.s, p>0.05; **, p=0.003; two-tailed t-test. Bar, median; box, 25th and 75th percentile; whiskers, 1.5 X interquartile range; circles, individual cell lines. (p) The prevalence of micronuclei formation in HCT116 and HPT cells exposed to non-targeting or KIF18A-targeting siRNAs for 72hr. n.s., p>0.05; ***, p<0.001; two-tailed Fisher’s exact test. (q) Relative protein expression levels of KIF18A, confirming successful KIF18 overexpression in the highly-aneuploid HPT1 and HPT2 cell lines 48hr post-transfection. Left: Western blot of KIF18A protein expression levels in HPT1 and HPT2 before and after KIF18A overexpression. Right: Quantification of KIF18A expression levels (normalized to α-Tubulin). *, p=0.013, **, p=0.005; one-tailed t-test; n=2 biological replicates. In all bar plots and line plots, data represent the mean ± s.d. unless otherwise noted; n=3 biological replicates unless otherwise noted. (r) Proliferation curves of HPT1 cells before and after over-expression of KIF18A (KIF18A-OE), in the absence or presence of MPI-0479605 (250nM).
Extended Data Figure 10:
Extended Data Figure 10:. Increased sensitivity of aneuploid cells to KIF18A inhibition.
(a) The sensitivity of near-euploid and highly-aneuploid cancer cell lines to the knockdown of KIF18A in the DRIVE RNAi screen across multiple cell lineages. *, p=0.022; two-tailed t-test. (b) The sensitivity of near-euploid and highly-aneuploid cancer cell lines to the knockdown of KIF18A in the DRIVE RNAi screen, after accounting for lineage-specific differences in gene dependency scores using linear regression. *, p=0.012; two-tailed t-test. (c) The sensitivity of near-euploid and highly-aneuploid cancer cell lines to the knockdown of KIF18A in the DRIVE RNAi screen, across TP53 mutation classes. *, p=0.026; two-tailed t-test. (d) The correlations between AS and the dependency on KIF18A in the DRIVE RNAi screen, for cell lines that have not undergone whole-genome duplication (i.e., cell lines with basal ploidy of n=2). Spearman’s ρ = −0.27 (p=7e-04). (e) The sensitivity of near-euploid and highly-aneuploid cancer cell lines to the knockdown of KIF18A in the DRIVE RNAi screen, after removing the effect of doubling time on gene dependency scores using linear regression. *, p=0.022; two-tailed t-test. (f) The sensitivity of near-euploid and highly-aneuploid cancer cell lines without microsatellite instability (MSS lines only) to the knockdown of KIF18A in the DRIVE RNAi screen. ***, p=3e-04; two-tailed t-test. (g) The sensitivity of near-euploid and highly-aneuploid cancer cell lines to the knockdown of KIF18A in the DRIVE RNAi screen, in cell lines that are WT for the 4 genes most selectively mutated in aneuploid human tumors (after TP53). *, p=0.021 and p=0.02, for CTCF and ARID1A, respectively; **, p=0.004; two-tailed t-test. (h) The sensitivity of near-euploid and highly-aneuploid cancer cell lines to the knockdown of KIF18A in the DRIVE RNAi screen, after removing the effect of lineage subtype on gene dependency scores using linear regression. *, p=0.024; two-tailed t-test. (i) The sensitivity of near-euploid and highly-aneuploid cancer cell lines to the knockdown of KIF18A in the DRIVE RNAi screen, after removing the effect of HET70 scores on gene dependency scores using linear regression. **, p=0.003; two-tailed t-test. (j) Left: Western blot of KIF18A protein expression levels in RPE1 and RPT cell lines. Right: Quantification of KIF18A expression levels (normalized to GAPDH). *, p-0.023; one-tailed t-test. Data represent the mean ± s.d.; n=3 biological replicates. (k) Relative protein expression levels of KIF18A, confirming successful KIF18 knockdown in the RPE1 and RPT cell lines 72hr post-transfection. Left: Western blot of KIF18A protein expression levels in RPE1, RPT1 and RPT3 before and after siRNA-mediated KIF18A knockdown. Right: Quantification of KIF18A expression levels (normalized to α-Tubulin). *, p=0.034, **,p=0.004; one-tailed t-test. Data represent the mean ± s.d.; n=3 biological replicates. (l) Time-lapse imaging-based quantification of the time from nuclear envelope breakdown (NEBD) to anaphase onset in RPE1 and RPT cell lines exposed to non-targeting or KIF18A-targeting siRNAs for 72hr. **, p<0.01; ****, p<1e-04; two-tailed t-test. (m) The prevalence of micronuclei formation in HCT116 and HPT cells exposed to non-targeting or KIF18A-targeting siRNAs for 72hr. n.s., p>0.05; **, p<0.01; ***, p<0.001; two-tailed Fisher’s exact test. (n) Imaging-based quantification of the prevalence of cell divisions with multipolar spindles in HCT116 and HPT cell lines treated with non-targeting control or KIF18A-targeting siRNAs for 72hr. *, p<0.05; **, p<0.01; ***, p<0.001; two-tailed t-test; Error bars, s.d.; n=3 biological replicates.
Figure 1:
Figure 1:. Differential sensitivity of aneuploid cancer cells to inhibition of the spindle assembly checkpoint.
(a) Schematics of our large-scale comparison of genetic and chemical dependencies between near-euploid and highly-aneuploid cancer cell lines. Cell lines were assigned aneuploidy scores (AS), and the genetic and chemical dependency landscapes were compared between the top and bottom AS quartiles. (b) The differential genetic dependencies between the near-euploid and highly-aneuploid cancer cell lines (top vs. bottom quartiles), based on the genome-wide Achilles RNAi screen. BUB1B and MAD2 are highlighted in red. (c) The pathways enriched in the list of genes that are more essential in highly-aneuploid than in near-euploid cancer cell lines (effect size<−0.1, q<0.1) in the Achilles RNAi screen. The full list is available in Supplementary Table 3. The most enriched pathway is the SAC. *, Benjamini-corrected p<0.1; one-tailed Fisher’s exact test. (d) The sensitivity of near-euploid and highly-aneuploid cancer cell lines to the knockdown of BUB1B (top) and MAD2 (bottom) in the Achilles RNAi screen. The more negative a value, the more essential the gene is in that cell line. ****, p=7e-07 and p=2e-07 for BUB1B and MAD2, respectively; two-tailed t-test. (e) Comparison of mRNA expression levels of BUB1B (top) and MAD2 (bottom) between near-euploid and highly-aneuploid cancer cell lines. **, p=0.001; ****, p=3e-06 for BUB1B and MAD2, respectively; two-tailed t-test. (f) The differential drug sensitivities between the near-euploid and highly-aneuploid cancer cell lines, based on the large-scale CTD2 drug screen. AZ-3146, the only SAC inhibitor in the screen, is highlighted in red. (g) The sensitivity of near-euploid and highly-aneuploid cancer cell lines to the SAC inhibitor AZ-3146 in the CTD2 drug screen. ***, p=2e-04; two-tailed t-test. (h) The sensitivity of near-euploid and highly-aneuploid cancer cell lines to the SAC inhibitor reversine, as evaluated by the PRISM assay. ***, p=3e-04; two-tailed t-test.
Figure 2:
Figure 2:. The effect of aneuploidy on cellular sensitivity to SACi in isogenic human cell lines.
(a) Dose response curves of HCT116/HPT cells (left), or RPE1/RPT cells (right), to MPI-0479605 (120hr). EC50=0.09μM, 0.08μM, 5.02μM and 4.85μM, for HCT116-WT, HCT116-GFP, HPT1 and HPT2, respectively. EC50=0.16μM, 1.48μM, 1.52μM and 3.31μM, for RPE1-GFP, RPT1, RPT3 and RPT4, respectively. *, p<0.05; **, p<0.01; ***, p<0.001; two-tailed t-test. (b) The response of HCT116 and HPT cells (left; n=3), or RPE1 and RPT cells (right; n=4), to siRNA-mediated knockdown of BUB1B, MAD2 or TTK (72hr). Results are normalized to a non-targeting siRNA control. **, p<0.01; ***, p<0.001; two-tailed t-test. (c) Dose response curves of the near-diploid RPE1 clone SS48 and its isogenic aneuploid clones SS51 and SS111, to MPI-0479605 (120hr). EC50=0.02μM, 0.08μM and 0.04μM, for SS48, SS51 and SS111, respectively. *, p<0.05; **, p<0.01; ***, p<0.001; two-tailed t-test; n=3 for near-diploid and n=4 for aneuploid clones. (d) Response of 3 near-diploid and 4 aneuploid RPE1 clones to siRNA-mediated knockdown of BUB1B, MAD2 or TTK (72hr). Results are normalized to a non-targeting siRNA control. **, p<0.01; ***, p<0.001; two-tailed t-test. (e) Proliferation curves of HCT116 and HPT cells cultured in the presence of siRNAs against BUB1B, MAD2, TTK, or a non-targeting control siRNA. (f) Proliferation curves of HCT116 and HPT cells cultured in the presence of MPI-0479605 (250nM) or DMSO control. (g) Representative images of the cells from the experiment described in (f). Scale bar, 100μm. Calculated doubling times for (e) and (f) are presented in Extended Data Fig. 8a. In all plots, data represent the mean ± s.d. unless otherwise noted; n=3 biological replicates in all experiments unless otherwise noted.
Figure 3:
Figure 3:. Transcriptional, cellular and karyotypic characterization of SACi in aneuploid cells.
(a) Schematics of gene expression profiling. HCT116 and HPT cells were treated with two SAC inhibitors, reversine (250nM and 500nM) and MPI-0479605 (250nM), global gene expression profiles were generated at 6hr, 24hr and 72hr post-drug exposure, and gene set enrichment analysis was performed to compare the transcriptional effect of SACi. (b) Unsupervised hierarchical clustering of the 4 cell lines based on drug-induced transcriptional changes. (c) Time from mitotic arrest to division following nocodazole (200ng/mL) treatment. **, p<0.01; two-tailed t-test. Bar, median; box, 25th and 75th percentile; whiskers, 1.5 X interquartile range; circles, individual cells. (d) Flow cytometry-based quantification of G2/M phase arrest induced by 48hr exposure to MPI-0479605 (250nM). ****, p=1e-05; two-tailed t-test. (e) The prevalence of micronuclei formation in HCT116 and HPT cells cultured under standard conditions or exposed to reversine (500nM) for 24hr. *, p=0.007; ***, p<0.001; two-tailed Fisher’s exact test. (f) Representative images of micronuclei formation in HPT2 cells exposed to reversine (500nM) for 24hr. Scale bar, 10μm. (g) Flow cytometry-based quantification of sub-G1 cell fraction induced by 48hr (left) or 14d (+3d of recovery; right) exposure to MPI-0479605 (250nM). **, p=0.002; ****, p=3e-05; two-tailed t-test. (h) Genome-wide copy number profiles of HCT116 and HPT single cells, as generated by the AneuFinder algorithm, at baseline (untreated; do), after 3d of MPI-0479605 (250nM) treatment (ongoing SACi; d3), and after recovery from 14d of treatment (recovered; d14+3). Individual cells are represented as rows, with chromosomes plotted as columns. In all plots, data represent the mean ± s.d. unless otherwise noted; n=3 biological replicates in all experiments unless otherwise noted.
Figure 4:
Figure 4:. Altered spindle geometry and dynamics, and increased dependency on the mitotic kinesin KIF18A, in aneuploid cancer cells.
(a) Differential mRNA expression levels of mitotic kinesins between HCT116 and HPT cell lines. KIF18A is highlighted in red. (b) Imaging of metaphase spindle in HCT116-GFP and HPT1 cells, Scale bar, 10μm. (c) Spindle length (left), width (middle), and angle (right) in HCT116 and HPT cells. The definitions of length, width and angle are shown in Extended Data Fig. 9c. ***, p<0.001; two-tailed t-test. (d) The percentage of spindle microtubule-bound kinetochores in HCT116 and HPT cells. ***, p<0.001; two-tailed t-test. (e) The sensitivity of near-euploid and highly-aneuploid cancer cell lines to the knockdown of KIF18A in the RNAi-DRIVE dataset. The more negative a value, the more essential the gene is. ***, p=3e-04; two-tailed t-test. (f) Proliferation curves of HCT116-GFP and HPT2 cells cultured in the presence of a KIF18A-targeting siRNA, or a non-targeting control siRNA. (g) The sensitivity of cancer cell lines to the knockdown of KIF18A as a function of their AS. Spearman’s ρ = −0.66 (p=0.026; one-tailed test). (h) The prevalence of cell divisions with multipolar spindles in HCT116 and HPT2 cells treated with KIF18A-targeting siRNAs or a non-targeting control siRNA. n.s., p>0.05; *, p=0.03; two-tailed t-test. (i) Representative images of multipolar spindles in HPT2 cells following siRNA-mediated KIF18A knockdown. Scale bar, 10μm. (j) Proliferation curves of HPT2 cells before and after over-expression of KIF18A (KIF18A-OE), in the absence or presence of MPI-0479605 (250nM). KIF18A-OE increases the inhibitory effect of SACi. (k) A model of the evolving response of aneuploid cancer cells to SACi. For more details, see Supplementary Note 12. In all plots, data represent the mean ± s.d. unless otherwise noted; n=3 biological replicates in all experiments. In all box plots: bar, median; box, 25th and 75th percentile; whiskers, 1.5 X interquartile range; circles, individual data points.

References

    1. Ben-David U & Amon A Context is everything: aneuploidy in cancer. Nat Rev Genet (2019) doi:10.1038/s41576-019-0171-x. - DOI - PubMed
    1. Ghandi M et al. Next-generation characterization of the Cancer Cell Line Encyclopedia. Nature (2019) doi:10.1038/s41586-019-1186-3. - DOI - PMC - PubMed
    1. Tsherniak A et al. Defining a Cancer Dependency Map. Cell 170, 564–576 e16 (2017). - PMC - PubMed
    1. McDonald ER et al. Project DRIVE: A Compendium of Cancer Dependencies and Synthetic Lethal Relationships Uncovered by Large-Scale, Deep RNAi Screening. Cell (2017) doi:10.1016/j.cell.2017.07.005. - DOI - PubMed
    1. Aguirre AJ et al. Genomic copy number dictates a gene-independent cell response to CRISPR/Cas9 targeting. Cancer Discov. (2016) doi:10.1158/2159-8290.CD-16-0154. - DOI - PMC - PubMed

Publication types