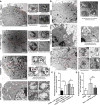
. 2021 Jan 5:11:610021.
doi: 10.3389/fimmu.2020.610021. eCollection 2020.

MicroRNA-106a Inhibits Autophagy Process and Antimicrobial Responses by Targeting ULK1, ATG7, and ATG16L1 During Mycobacterial Infection

Affiliations

MicroRNA-106a Inhibits Autophagy Process and Antimicrobial Responses by Targeting ULK1, ATG7, and ATG16L1 During Mycobacterial Infection

Kunmei Liu et al. Front Immunol. .

Abstract

Autophagy is a key element of innate immune response against invading pathogens including Mycobacterium tuberculosis (M. tuberculosis). The emerging roles of microRNAs in regulating host antimicrobial responses against M. tuberculosis have gained widespread attention. However, the process by which miRNAs specifically influence antibacterial autophagy during mycobacterial infection is largely uncharacterized. In this study, we demonstrate a novel role of miR-106a in regulating macrophage autophagy against M. tuberculosis. H37Ra infection leads to downregulation of miR-106a in a time- and dose-dependent manner and concomitant upregulation of its three targets (ULK1, ATG7, and ATG16L1) in THP-1 macrophages. MiR-106a could inhibit autophagy activation and antimicrobial responses to M. tuberculosis by targeting ULK1, ATG7, and ATG16L1. Overexpression of miR-106a dramatically inhibited H37Ra-induced activation of autophagy in human THP-1 macrophages, whereas inhibitors of miR-106a remarkably promoted H37Ra-induced autophagy. The inhibitory effect of miR-106a on autophagy process during mycobacterial infection was also confirmed by Transmission Electron Microscope (TEM) observation. More importantly, forced expression of miR-106a increased mycobacterial survival, while transfection with miR-106a inhibitors attenuated the survival of intracellular mycobacteria. Taken together, these data demonstrated that miR-106a functioned as a negative regulator in autophagy and antimicrobial effects by targeting ULK1, ATG7, and ATG16L1 during M. tuberculosis infection, which may provide a potential target for developing diagnostic reagents or antibacterials against tuberculosis.

Keywords: ATG16L1; ATG7; Mycobacterium tuberculosis; ULK1; autophagy; miR-106a.


Conflict of interest statement

The authors declare that the research was conducted in the absence of any commercial or financial relationships that could be construed as a potential conflict of interest.

Figures
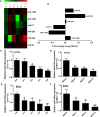
Figure 1
Figure 1
miR-106a is reduced after mycobacterial infection in vitro. (A) Heatmap analysis shows downregulated (green) and upregulated (red) miRNAs in miR-17 family from tuberculosis (TB) patients and healthy controls (HCs) in the GEO public databases (GSE119494). (B) Expression levels of miR-17 family miRNAs in TB patients and HCs from the GEO public databases (GSE119494). Fold change was calculated by dividing the average signal intensity of TB patients by that of HCs. (C) The differentiated THP-1 macrophages were infected with H37Ra at a MOI of 10 for the indicated time points, and miR-106a expression was subsequently determined using qRT-PCR. The miR-106a expression levels are indicated relative to expression at 0 h. (D) The differentiated THP-1 macrophages were infected with H37Ra at indicated MOIs for 24 h. The miR-106a expression levels are indicated relative to expression without H37Ra infection. (E) The differentiated THP-1 macrophages were infected with BCG (MOI of 10) for the indicated time points, and miR-106a expression was subsequently determined using qRT-PCR. The miR-106a expression levels are indicated relative to expression at 0 h. (F) The differentiated THP-1 macrophages were infected with BCG at indicated MOIs for 24 h. The miR-106a expression levels are indicated relative to expression without BCG infection. All data above represent the means ± SD from at least three independent experiments. *p < 0.05, **p < 0.01, ***p < 0.001.
Figure 2
Figure 2
miR-106a directly targets ULK1, ATG7, and ATG16L1. (A) Predicted binding between miR-106a and the seed matches in ULK1, ATG7 and ATG16L1 3′-UTRs. The sequence of the ULK1, ATG7, and ATG16L1 3′-UTR seed mutants used for the reporter assays. (B) miR-106a regulates ULK1, ATG7, and ATG16L1 3′-UTR reporters. Luciferase reporter assays 24 h after transfection with indicated pmirGLO dual-luciferase reporter vector, co-transfected with miR-106a mimics, miR-106a inhibitor or relevant negative controls (nc). (C) Representative fluorescent microscopic image confirm that GFP expression of the pEGFP-ULK1, pEGFP-ATG16L1 and pEGFP-ATG7 reporters was inhibited by miR-106a. HEK-293 cells were co-transfected with the GFP reporter vectors and compared with cells transfected with a mimic or control of miR-106a. Scale bars: 10 μm. (D) The THP-1 macrophages were transfected with miR-106a mimics, mimic nc, miR-106a inhibitor or inhibitor nc. The expression levels of miR-106a were measured by qRT-PCR. (E) miR-106a decreases ULK1, ATG7 and ATG16L1 protein levels. Western blot analysis 24 h after transfection with miR-106a mimics, mimic nc, miR-106a inhibitor or inhibitor nc. The ULK1, ATG7 and ATG16L1 bands were quantified relative to glyceraldehyde 3-phosphate dehydrogenase (GAPDH). Data represent the means ± SD from at least three independent experiments. *p < 0.05, **p < 0.01, ***p < 0.001.
Figure 3
Figure 3
miR-106a inhibits autophagy induction in macrophages by targeting ULK1, ATG7 and ATG16L1. (A) THP-1 macrophages were treated with Baf A1 (100 nM) for 2 h, and then were uninfected or infected with H37Ra. LC3-II expression was determined by Western blot, normalized to GAPDH expression. (B) THP-1 macrophages were uninfected or infected with H37Ra for 24 h. The cells were fixed and incubated with rabbit anti-LC3 antibody, and stained with goat anti-rabbit IgG (Alexa Fluor 488; green) to detect LC3 puncta by confocal microscopy. Scale bars: 5 μm. The number of LC3 puncta in each cell was also counted. (Uninfected, n = 20; Infected, n = 20). Experiments performed in triplicate. **p < 0.01. (C) THP-1 macrophages were transfected with an miR-106a mimic or mimic nc; miR-106a inhibitor or inhibitor nc, and then infected with H37Ra for 24 h. ULK1, ATG7 and ATG16L1 protein levels were determined by Western blot, normalized to GAPDH expression. (D, E) The ratio of LC3-II to LC3-I were also determined by Western blot, normalized to GAPDH expression. Data represent the means ± SD from at least three independent experiments. *p < 0.05, **p < 0.01.
Figure 4
Figure 4
miR-106a mimics significantly decreased the number of LC3 puncta in macrophages. (A) THP-1 macrophages were transfected with miR-106a mimic or inhibitor, and then treated with H37Ra for 24 h. The THP-1 macrophages were fixed and incubated with rabbit anti-LC3 antibody, and stained with goat anti-rabbit IgG (Alexa Fluor 488; green) to detect LC3 puncta by confocal microscopy (left, uninfected; right, infected). Scale bars: 1 μm. (B, C) Quantitative data of LC3 puncta analysis. (Mimic nc, n = 20; Inhibitor nc, n = 20; Mimic, n = 20; Inhibitor, n = 20). Data represent the means ± SD from three independent experiments. **p < 0.01, ***p < 0.001.
Figure 5
Figure 5
miR-106a and the siRNAs of ATG7, ATG16L1 and ULK1 can inhibit the expression of LC3-II. (A–C) The THP-1 macrophages were treated with 50 μg/ml rapamycin for 2 h, and then transfected with miR-106a mimics, ATG7 siRNA, ATG16L1 siRNA or ULK1 siRNA for 24 h. After that, the protein levels of ATG16L1, ATG7 and ULK1 was determined by Western blot. (D) The THP-1 macrophages were treated with 50 μg/ml rapamycin for 2 h, and then transfected with miR-106a mimics, or mixture of ATG7 siRNA, ATG16L1 siRNA and ULK1 siRNA for 24 h. After that, LC3-II expression was determined by Western blot. (E) The THP-1 macrophages were transfected with miR-106a mimics, or mixture of ATG7 siRNA, ATG16L1 siRNA and ULK1 siRNA for 24 h. After that, LC3-II expression was determined by Western blot. Data represent the means ± SD from three independent experiments. *p < 0.05, **p < 0.01, ***p < 0.001.
Figure 6
Figure 6
The siRNAs of ATG7, ATG16L1 and ULK1 inhibited autophagosome formation. (A) The THP-1 macrophages were treated with 50 μg/ml rapamycin for 2 h, and then transfected with ATG7 siRNA, ATG16L1 siRNA, ULK1 siRNA or miR-106a mimics for 24 h. After that, the THP-1 macrophages were fixed and incubated with Rabbit Anti-LC3 antibody, followed by Alexa Fluor 488-conjugated goat anti-rabbit IgG. LC3 puncta formation was then detected by confocal microscopy. (B) Quantitative data of LC3 puncta analysis. (Rapa, n = 10; Rapa plus miR-106a mimics, n = 10; Rapa plus ATG7 siRNA, n = 10; Rapa plus ATG16L1 siRNA, n = 10; Rapa plus ULK1 siRNA, n = 10). Data represent the means ± SD from three independent experiments. ***p < 0.001.
Figure 7
Figure 7
The inhibitory effect on autophagy by miR-106a was confirmed by TEM detection. (A) The THP-1 macrophages were transfected with miR-106a mimic or miR-106a inhibitor, and then infected with H37Ra for 24 h. Representative images of TEM. Scale bars represent 2 μm. Autophagosomes or suspected autolysosomes denoted by red arrow heads. H37Ra indicated by yellow triangle. (B) The THP-1 macrophages were treated with 50 μg/ml rapamycin for 2 h, and then transfected with miR-106a mimics for 24 h. Representative images of TEM. Scale bars represent 2 μm. Autophagosomes or suspected autolysosomes denoted by red arrow heads. (C, D) The number of autophagosomes per cross-sectioned cell was counted (n = 15). Data represent the means ± SD from three independent experiments. **p < 0.01, ***p < 0.001.
Figure 8
Figure 8
Intracellular survival of H37Ra analyzed by counting CFU. (A) The THP-1 macrophages were treated with mimic nc, miR-106a mimics, rapamycin (50 μg/ml) or rapamycin plus miR-106a mimics for 24 h. After infection with H37Ra at a MOI of 10 for 3h, the cells were washed to remove extracellular bacteria, and cultured for an additional 24 h. The cells were lysed and mycobacterial viability (CFU) determined. **p < 0.01, ***p < 0.001. (B) The THP-1 macrophages were treated with inhibitor nc, miR-106a inhibitor, mixed siRNA or mixed siRNA plus miR-106a inhibitor for 24 h. After infection with H37Ra at a MOI of 10 for 3h, the cells were washed to remove extracellular bacteria, and cultured for an additional 24 h. The cells were lysed and mycobacterial viability (CFU) determined. *p < 0.05.
Figure 9
Figure 9
Schematic diagram of miR-106a regulating autophagy by targeting ULK1, ATG7 and ATG16L1. miR-106a expression was downregulated in human macrophages after mycobacterial infection, however it remains unclear about the mechanisms by which miR-106a is reduced. miR-106a can perform the regulation of autophagy and antimicrobial responses by targeting ULK1, ATG7 and ATG16L1.

Similar articles

Cited by

References

    1. World Health Organization Global tuberculosis report 2020. World Health Organization (2020). Available at: https://apps.who.int/iris/handle/10665/336069. License: CC BY-NC-SA 3.0 IGO.
    1. Banuls AL, Sanou A, Anh NT, Godreuil S. Mycobacterium tuberculosis: ecology and evolution of a human bacterium. J Med Microbiol (2015) 64(11):1261–9. 10.1099/jmm.0.000171 - DOI - PubMed
    1. Getahun H, Matteelli A, Chaisson RE, Raviglione M. Latent Mycobacterium tuberculosis infection. N Engl J Med (2015) 372(22):2127–35. 10.1056/NEJMra1405427 - DOI - PubMed
    1. Philips JA, Ernst JD. Tuberculosis pathogenesis and immunity. Annu Rev Pathol (2012) 7:353–84. 10.1146/annurev-pathol-011811-132458 - DOI - PubMed
    1. Franco LH, Nair VR, Scharn CR, Xavier RJ, Torrealba JR, Shiloh MU, et al. The Ubiquitin Ligase Smurf1 Functions in Selective Autophagy of Mycobacterium tuberculosis and Anti-tuberculous Host Defense. Cell Host Microbe (2017) 21(1):59–72. 10.1016/j.chom.2016.11.002 - DOI - PMC - PubMed

Publication types

MeSH terms