

Retinal Pigment Epithelium Atrophy in Recessive Stargardt Disease as Measured by Short-Wavelength and Near-Infrared Autofluorescence
- PMID: 33505770
- PMCID: PMC7794276
- DOI: 10.1167/tvst.10.1.3
Retinal Pigment Epithelium Atrophy in Recessive Stargardt Disease as Measured by Short-Wavelength and Near-Infrared Autofluorescence
Abstract
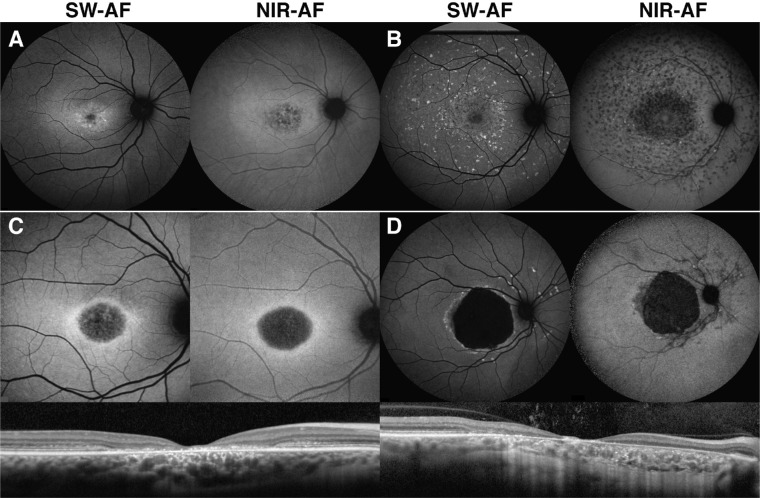
Purpose: To compare the detection of retinal pigment epithelium (RPE) atrophy in short-wavelength (SW-AF) and near-infrared autofluorescence (NIR-AF) images in Stargardt disease (STGD1) patients.
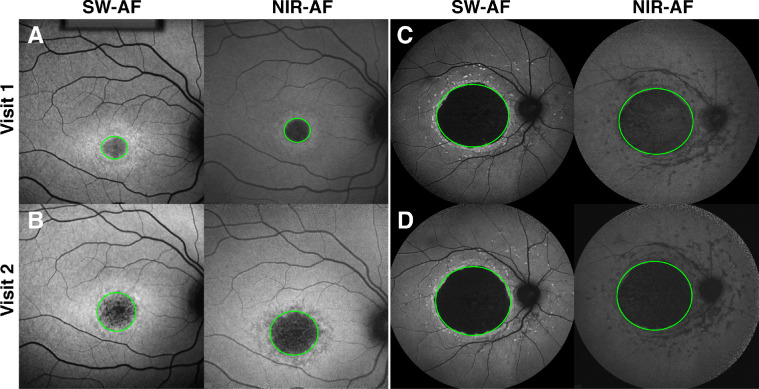
Methods: SW-AF and NIR-AF images (115 eyes from 115 patients) were analyzed by two independent graders. Hypoautofluorescent (hypoAF) areas, indicative of RPE atrophy, were measured, and the two modalities were compared.
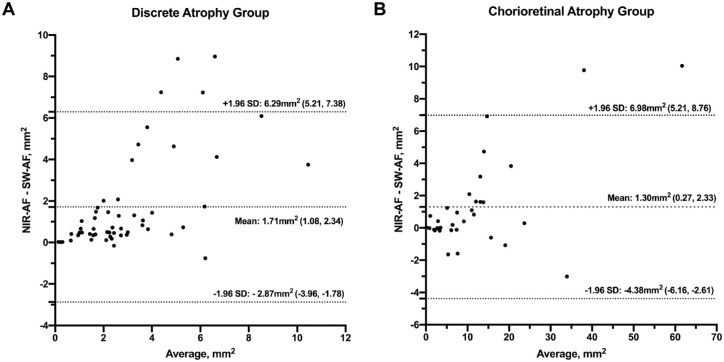
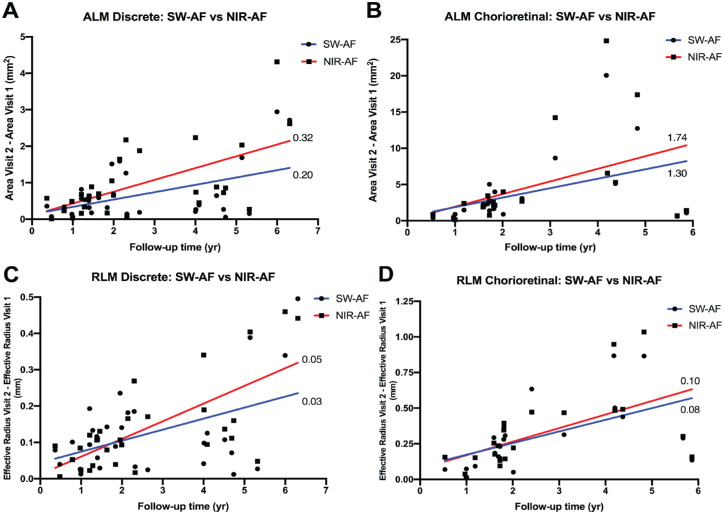
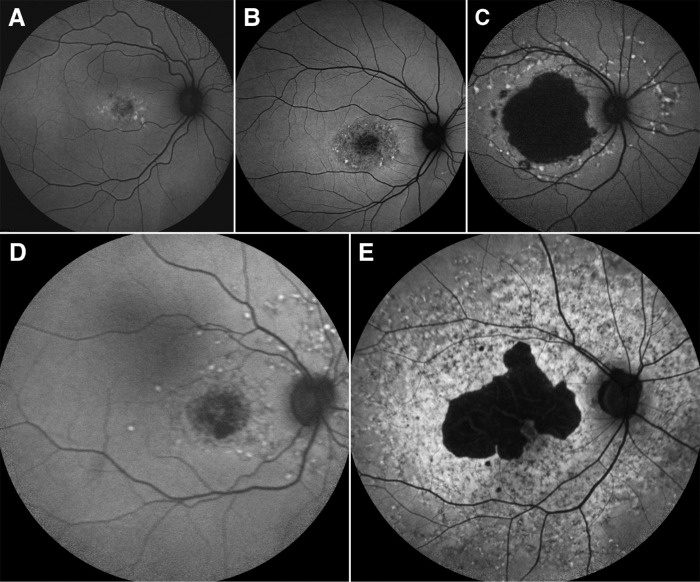
Results: Patients were segregated into four groups: nascent (6 [5%]), widespread (21 [18%]), discrete (55 [48%]), and chorioretinal atrophy (33 [29%]). The areas of hypoAF were larger in NIR-AF compared to SW-AF images in discrete (3.9 vs. 2.2 mm2, P < 0.001) and chorioretinal atrophy (12.7 vs. 11.4 mm2, P = 0.015). Similar findings were observed qualitatively in nascent and widespread atrophy patients. Using the area linear model (ALM), lesion area increased at similar rates in SW-AF and NIR-AF images of discrete atrophy (0.20 vs. 0.32 mm2/y, P = 0.275) and chorioretinal atrophy (1.30 vs. 1.74 mm2/y, P = 0.671). Using the radius linear model (RLM), the lesion effective radius also increased similarly in SW-AF and NIR-AF images in discrete (0.03 vs. 0.05 mm2/y, P = 0.221) and chorioretinal atrophy (0.08 vs. 0.10 mm2/y, P = 0.754) patients.
Conclusions: NIR-AF reveals a larger area of RPE atrophy in STGD1 patients compared to SW-AF images, but rates of lesion enlargement in the two modalities are similar.
Translational relevance: Measurements of RPE atrophy by AF imaging are crucial for monitoring STGD1 disease progression and given our findings we advocate greater use of NIR-AF for patients.
Keywords: Stargardt disease; near-infrared autofluorescence; short-wavelength autofluorescence.
Copyright 2021 The Authors.
Conflict of interest statement
Disclosure: R. Jauregui, None; Y. Nuzbrokh, None; P.-Y. Su, None; J. Zernant, None; R. Allikmets, None; S.H. Tsang, None; J.R. Sparrow, None
Figures
Similar articles
-
Factors Influencing Retinal Pigment Epithelium-Atrophy Progression Rate in Stargardt Disease.Transl Vis Sci Technol. 2020 Jun 25;9(7):33. doi: 10.1167/tvst.9.7.33. eCollection 2020 Jun. Transl Vis Sci Technol. 2020. PMID: 32832238 Free PMC article.
-
Near-infrared autofluorescence: its relationship to short-wavelength autofluorescence and optical coherence tomography in recessive stargardt disease.Invest Ophthalmol Vis Sci. 2015 May;56(5):3226-34. doi: 10.1167/iovs.14-16050. Invest Ophthalmol Vis Sci. 2015. PMID: 26024107 Free PMC article.
-
Correlations among near-infrared and short-wavelength autofluorescence and spectral-domain optical coherence tomography in recessive Stargardt disease.Invest Ophthalmol Vis Sci. 2014 Oct 23;55(12):8134-43. doi: 10.1167/iovs.14-14848. Invest Ophthalmol Vis Sci. 2014. PMID: 25342616 Free PMC article.
-
Natural History of Autosomal Recessive Stargardt Disease in Untreated Eyes: A Systematic Review and Meta-analysis of Study- and Individual-Level Data.Ophthalmology. 2019 Sep;126(9):1288-1296. doi: 10.1016/j.ophtha.2019.05.015. Epub 2019 May 17. Ophthalmology. 2019. PMID: 31227323
-
[Pathophysiology of macular diseases--morphology and function].Nippon Ganka Gakkai Zasshi. 2011 Mar;115(3):238-74; discussion 275. Nippon Ganka Gakkai Zasshi. 2011. PMID: 21476310 Review. Japanese.
Cited by
-
ABCA4 Variant c.5714+5G>A in Trans With Null Alleles Results in Primary RPE Damage.Invest Ophthalmol Vis Sci. 2023 Sep 1;64(12):33. doi: 10.1167/iovs.64.12.33. Invest Ophthalmol Vis Sci. 2023. PMID: 37728905 Free PMC article.
-
Natural History of Stargardt Disease: The Longest Follow-Up Cohort Study.Genes (Basel). 2023 Jul 2;14(7):1394. doi: 10.3390/genes14071394. Genes (Basel). 2023. PMID: 37510299 Free PMC article.
-
Stargardt disease: Multimodal imaging: A review.Clin Exp Ophthalmol. 2021 Jul;49(5):498-515. doi: 10.1111/ceo.13947. Epub 2021 Jun 1. Clin Exp Ophthalmol. 2021. PMID: 34013643 Free PMC article. Review.
-
Comparisons Among Optical Coherence Tomography and Fundus Autofluorescence Modalities as Measurements of Atrophy in ABCA4-Associated Disease.Transl Vis Sci Technol. 2022 Jan 3;11(1):36. doi: 10.1167/tvst.11.1.36. Transl Vis Sci Technol. 2022. PMID: 35089312 Free PMC article.
-
Multi-spectral autofluorescence variability of the individual retinal pigmented epithelial cells in healthy aging eyes.Sci Rep. 2024 Dec 3;14(1):30012. doi: 10.1038/s41598-024-81433-8. Sci Rep. 2024. PMID: 39622926 Free PMC article.
References
-
- Fishman GA, Farber M, Patel BS, Derlacki DJ.. Visual acuity loss in patients with Stargardt's macular dystrophy. Ophthalmology . 1987; 94(7): 809–814. - PubMed
-
- Rotenstreich Y, Fishman GA, Anderson RJ.. Visual acuity loss and clinical observations in a large series of patients with Stargardt disease. Ophthalmology . 2003; 110(6): 1151–1158. - PubMed
-
- Allikmets R, Singh N, Sun H, et al. .. A photoreceptor cell-specific ATP-binding transporter gene (ABCR) is mutated in recessive Stargardt macular dystrophy. Nat Genet . 1997; 15(3): 236–246. - PubMed
-
- Weng J, Mata NL, Azarian SM, Tzekov RT, Birch DG, Travis GH. Insights into the function of Rim protein in photoreceptors and etiology of Stargardt's disease from the phenotype in abcr knockout mice. Cell . 1999; 98(1): 13–23. - PubMed
Publication types
MeSH terms
Grants and funding
LinkOut - more resources
Full Text Sources
Other Literature Sources
Miscellaneous
