

Dosimetry of Submandibular Glands on Xerostomia for Nasopharyngeal Carcinoma
- PMID: 33505916
- PMCID: PMC7832343
- DOI: 10.3389/fonc.2020.601403
Dosimetry of Submandibular Glands on Xerostomia for Nasopharyngeal Carcinoma
Abstract
Purpose: To investigate dosimetry of submandibular glands on xerostomia after intensity-modulated radiotherapy for nasopharyngeal carcinoma (NPC).
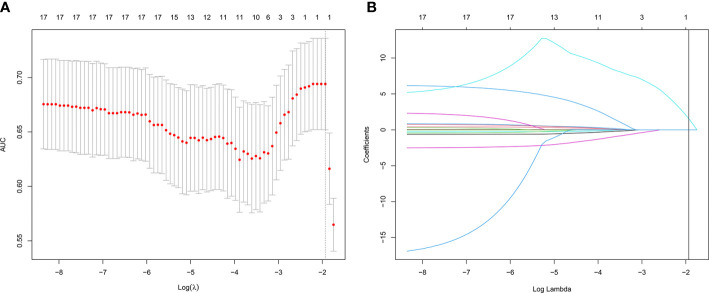
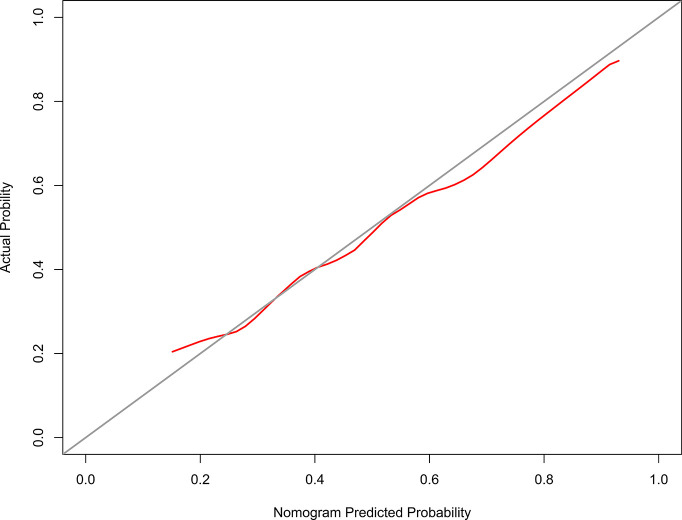
Methods: From September 2015 to March 2016, 195 NPC patients were investigated. Xerostomia was evaluated at 12 months after treatment via the RTOG/EORTC system. The least absolute shrinkage and selection operator regression model was used to optimize feature selection for grades 2-3 xerostomia. Multivariable logistic regression analysis was applied to build a predicting model incorporating the feature selected in the least absolute shrinkage and selection operator regression model. Discrimination, calibration, and clinical usefulness of the predicting model were assessed using the C-index, calibration plot, and decision curve analysis.
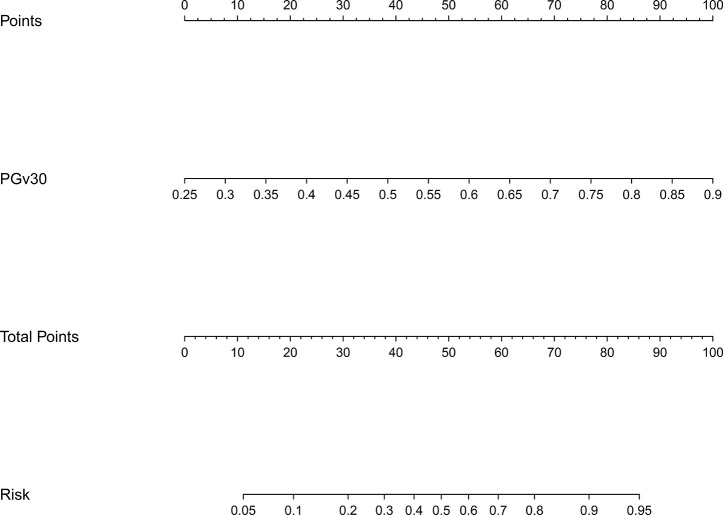
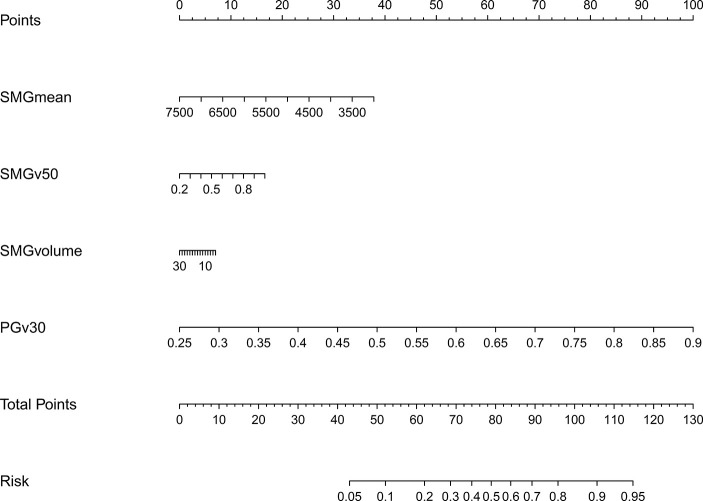
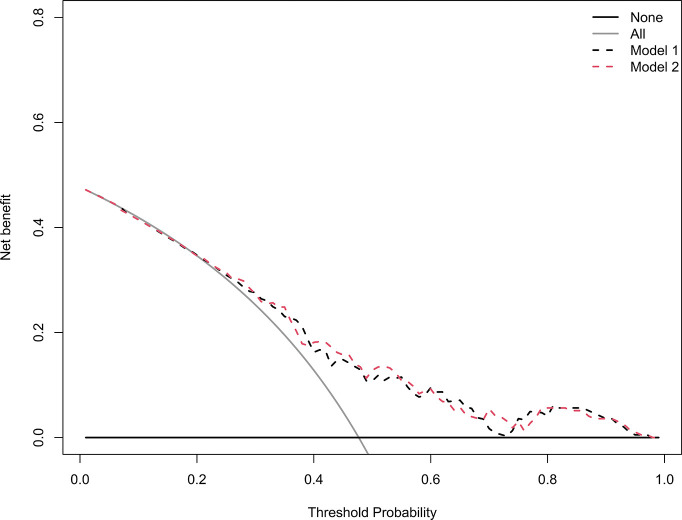
Results: The V30 of the parotid glands was selected based on the least absolute shrinkage and selection operator regression. The nomogram displayed good discrimination with a C-index of 0.698 (95% confidence interval [CI]: 0.626-0.771) and good calibration (model 1). Addition of the dosimetric parameters including the mean dose to the submandibular glands, V50 of the submandibular glands, and volume of the submandibular glands to the model 1 failed to show incremental prognostic value (model 2). The model 2 showed a C-index of 0.704 (95% CI: 0.632-0.776). Decision curve analysis demonstrated that the model 1 was clinically useful when intervention was decided at the possibility threshold of > 20%. Within this range, net benefit was comparable between the model 1 and model 2.
Conclusion: PGv30 was a major predictive factor of grades 2-3 xerostomia for NPC. In contrast, the mean dose to the submandibular glands, V50 of the submandibular glands, and volume of the submandibular glands were not independent predictive factors.
Keywords: NPC; intensity-modulated radiotherapy; nasopharyngeal carcinoma; submandibular glands; xerostomia.
Copyright © 2021 Pan, Liu, Huang, Pei, Chen, Qu, Li and Zhu.
Conflict of interest statement
The authors declare that the research was conducted in the absence of any commercial or financial relationships that could be construed as a potential conflict of interest.
Figures

Similar articles
-
Development and validation of a nomogram for prediction of recovery from moderate-severe xerostomia post-radiotherapy in nasopharyngeal carcinoma patients.Radiother Oncol. 2023 Jul;184:109683. doi: 10.1016/j.radonc.2023.109683. Epub 2023 Apr 28. Radiother Oncol. 2023. PMID: 37120102
-
Prognostic nomogram of xerostomia for patients with nasopharyngeal carcinoma after intensity-modulated radiotherapy.Aging (Albany NY). 2020 Jan 31;12(2):1857-1866. doi: 10.18632/aging.102717. Epub 2020 Jan 31. Aging (Albany NY). 2020. PMID: 32005029 Free PMC article.
-
A prediction model for xerostomia in locoregionally advanced nasopharyngeal carcinoma patients receiving radical radiotherapy.BMC Oral Health. 2022 Jun 17;22(1):239. doi: 10.1186/s12903-022-02269-0. BMC Oral Health. 2022. PMID: 35715856 Free PMC article. Clinical Trial.
-
Patient- and therapy-related factors associated with the incidence of xerostomia in nasopharyngeal carcinoma patients receiving parotid-sparing helical tomotherapy.Sci Rep. 2015 Aug 20;5:13165. doi: 10.1038/srep13165. Sci Rep. 2015. PMID: 26289304 Free PMC article.
-
Prospective investigation and literature review of tolerance dose on salivary glands using quantitative salivary gland scintigraphy in the intensity-modulated radiotherapy era.Head Neck. 2016 Apr;38 Suppl 1:E1746-55. doi: 10.1002/hed.24310. Epub 2016 Feb 15. Head Neck. 2016. PMID: 26875880 Review.
Cited by
-
Analysis of the Parotid Glands on an Energy Spectrum CT Iodine Map to Evaluate Irradiation-Induced Acute Xerostomia in Patients With Nasopharyngeal Carcinoma.Technol Cancer Res Treat. 2024 Jan-Dec;23:15330338241256814. doi: 10.1177/15330338241256814. Technol Cancer Res Treat. 2024. PMID: 38773777 Free PMC article.
References
-
- Siegel RL, Miller KD, Jemal A. Cancer statistics, 2018. CA Cancer J Clin (2018) 68:7–30. - PubMed
-
- Chen W, Zheng R, Baade PD, Zhang S, Zeng H, Bray F, et al. Cancer statistics in China, 2015. CA Cancer J Clin (2016) 66:115–32. - PubMed
-
- Lin A, Kim HM, Terrell JE, Dawson LA, Ship JA, Eisbruch A. Quality of life after parotid-sparing IMRT for head-and-neck cancer: a prospective longitudinal study. Int J Radiat Oncol Biol Phys (2003) 57:61–70. - PubMed
LinkOut - more resources
Full Text Sources
Other Literature Sources