Review
. 2021 Jan 11:8:591311.
doi: 10.3389/fchem.2020.591311. eCollection 2020.

Recent Progress in Quantitatively Monitoring Vesicular Neurotransmitter Release and Storage With Micro/Nanoelectrodes

Affiliations
Review

Recent Progress in Quantitatively Monitoring Vesicular Neurotransmitter Release and Storage With Micro/Nanoelectrodes

Yuying Liu et al. Front Chem. .

Abstract

Exocytosis is one of the essential steps for chemical signal transmission between neurons. In this process, vesicles dock and fuse with the plasma membrane and release the stored neurotransmitters through fusion pores into the extracellular space, and all of these steps are governed with various molecules, such as proteins, ions, and even lipids. Quantitatively monitoring vesicular neurotransmitter release in exocytosis and initial neurotransmitter storage in individual vesicles is significant for the study of chemical signal transmission of the central nervous system (CNS) and neurological diseases. Electrochemistry with micro/nanoelectrodes exhibits great spatial-temporal resolution and high sensitivity. It can be used to examine the exocytotic kinetics from the aspect of neurotransmitters and quantify the neurotransmitter storage in individual vesicles. In this review, we first introduce the recent advances of single-cell amperometry (SCA) and the nanoscale interface between two immiscible electrolyte solutions (nanoITIES), which can monitor the quantity and release the kinetics of electrochemically and non-electrochemically active neurotransmitters, respectively. Then, the development and application of the vesicle impact electrochemical cytometry (VIEC) and intracellular vesicle impact electrochemical cytometry (IVIEC) and their combination with other advanced techniques can further explain the mechanism of neurotransmitter storage in vesicles before exocytosis. It has been proved that these electrochemical techniques have great potential in the field of neuroscience.

Keywords: amperometry; electrodes; exocytosis; neurotransmitter; vesicle; vesicle impact electrochemical cytometry (VIEC).


Conflict of interest statement

The authors declare that the research was conducted in the absence of any commercial or financial relationships that could be construed as a potential conflict of interest.

Figures

Figure 1
Figure 1
(A) Illustration of the microelectrode array (MEA) device side view (not drawn to scale), where the thin film platinum electrodes are placed to touch and probe a cell. (B) Scanning electron microscope (SEM) image of a MEA showing the 16 exposed microelectrodes within an open window of the Si3N3 insulation layer. MEA electrodes are indicated by odd numbering (1–15) in the lower electrode row and even numbering (2–16) in the upper electrode row. Scale bar is 10 μm. (C) Light microscopy image of a MEA probe placed on top of a chromaffin. Scale bar is 30 μm. Reprinted from Wigstrom et al. (2016), with permission from American Chemical Society.
Figure 2
Figure 2
(A) Microelectrode placement on the Type II varicosities in muscle 13 in Drosophila larvae. (B) Same view as 1C but with fluorescence, mCherry-labeled octopaminergic terminals (Type II varicosities) presented as a red line and the white ring shows the placement of the microelectrode. (C) A potential of 900 mV (vs Ag/AgCl reference electrode) was applied, with no light stimulation. (D) A potential of 0 mV was applied, with blue light stimulation. (E) A 900-mV potential, stimulated with blue light. Same scale for all traces. Reprinted from Majdi et al. (2015), with permission from Wiley Online Library.
Figure 3
Figure 3
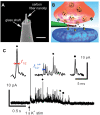
(A) Amplified picture of the tip of the nanoelectrode; the scale bar is 1 μm. (B) Schematic representation of a nanosensor's tip inside an individual synapse. (C) High K+-induced amperometric spike and two complex events were amplified above. Reprinted from Li et al. (2014), with permission from Wiley Online Library.
Figure 4
Figure 4
Correlation of amperometric and fluorescence information for a single exocytotic event of fluorescent false neurotransmitter102 (FFN102)-stained BON N13 cells over an indium tin oxide (ITO) microdevice. Top: An exocytotic event appeared as the current spike in electrochemical detection. Bottom: Sequential pseudocolor total internal reflection fluorescence microscopy (TIRFM) images of a single exocytotic event viewed as a flash of fluorescence. Scale bar = 500 nm. Reprinted from Liu et al. (2017), with permission from Wiley Online Library.
Figure 5
Figure 5
(A) (Left) Amperometric spikes recorded with the pretreated carbon fiber microelectrode (CFE) closely attached to a single rat adrenal chromaffin cell that was cultured in the standard extracellular solution (i.e., containing 2 mM Ca2+) and stimulated by K+-stimulating solution. (Right) Current-time trace recorded with the pretreated CFE closely attached to a single rat adrenal chromaffin cell that was cultured in the Ca2+-free extracellular solution and stimulated by Ca2+-free K+-stimulating solution. Inset, schematic illustration of the single-cell amperometry with the pretreated CFE. (B) High K+ evoked amperometric spikes recorded with the pretreated CFE closely attached to a single rat adrenal chromaffin cell cultured in the standard extracellular solution (i.e., containing 2 mM Ca2+) at different holding potentials of 0.0 V (left) and −0.20 V (right). Inset, a typical amperogram spike for ascorbate secretion. Reprinted from Wang et al. (2017), with permission from the American Chemical Society.
Figure 6
Figure 6
(A) Schematic diagram showing the process of amperometric monitoring of glutamate exocytosis from single hippocampal varicosity; the top right shows the scanning electron microscope (SEM) images of a platinized carbon fiber microelectrode, and the bottom right shows the mechanism of Glu detection on the microsensor. (B) Schematic diagram of the amperometric glutamate sensor design consisting of a glutamate oxidase (GluOx)-coated gold nanoparticle-modified carbon fiber microelectrode. It displays the chemical enzyme catalysis reaction chain for glutamate with the subsequent detection scheme for electrochemical detection of the reporter molecule H2O2 produced. The red hemispheres represent gold nanoparticles, and GluOx that is immobilized at the surface is displayed in yellow (not drawn to scale). (C) Top: Amperometric current–time trace detecting spontaneous glutamate release during individual exocytotic events in mouse brain slice. Below: Definition of the current spike parameters used for exocytosis kinetic analysis after converting the amperometric recording to positive reduction current (left). Illustration of the placement of sensor in the nucleus accumbens of rodent brain slice for amperometric recording. Schemes are not drawn to scale (right). Reprinted from Yang et al. (2019) and Wang et al. (2019b), with permission from the American Chemical Society.
Figure 7
Figure 7
Study of cholinergic neurotransmission at the single synaptic cleft with nanoelectrode and scanning electrochemical microscope (SECM). (A) Illustration of synaptic cleft dimensions. (B) Cultured living aplysia pedal ganglion neurons used for the experiment, where the axon from cell 1 (pink) formed a synaptic connection with the body of cell 2. Scale bar: 200 μm. (C) A nanoscale interface between two immiscible electrolyte solutions (nanoITIES) pipette electrode was positioned around the synaptic cleft to measure the concentration and release dynamics of acetylcholine (ACh+) simultaneously using amperometry; the positioning of the nanoelectrode was achieved using the SECM with a spatial resolution of 5 nm. The zoom shows the nanoITIES formed at the tip of the nanoITIES pipette electrode, and ionic transmitter (ACh+) transfers across the interface, generating a current and thus getting detected. (D) Cyclic voltammogram corresponding to ACh detection, where the detection potential follows the Nernstian equation, and a steady-state transfer potential, EACh = −0.48 V vs. E1/2, TBA, selective for cholinergic neurotransmitter detection was used in amperometry to study its synaptic concentration dynamics. (E) A SECM and a lab-built side view optical microscope were used for the positioning of the nanoelectrode around synapses with a nm spatial resolution. The lab-built side-view optical microscope provided rough positioning before the fine positioning of 5 nm spatial resolution with SECM. After SECM positioning, the optical microscopic view of the nanoelectrode and the synapse are shown in (F), where it can be seen that it is very hard to locate the synapse by visual observation alone. The combined use of the side-view optical microscope and nano-positioning platform, SECM, is critical. (F) A stimulating pipette was used to provide high-concentration K+ stimulation. Reflection was used for the rough positioning of the nanoelectrode and stimulating pipette in the x, y, and z axes by an optical microscope, which was followed by the nanometer positioning of the nanoelectrode around the synapse achieved using nano-resolution SECM with details described in the supporting information. Scale bar: 150 μm. (G) High-resolution scanning electron microscope (SEM) picture of the nanopipette tip with the radius to be around 15 nm. Reprinted from Shen et al. (2018), with permission from the American Chemical Society.
Figure 8
Figure 8
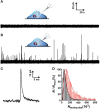
(A) Representative current–time trace of VIEC in a suspension of chromaffin cell vesicles. (B) A 5-s baseline at 0 mV vs. Ag/AgCl in the presence of vesicles. (C) Expanded view of current transients. The pink squares represent the Imax of all peak candidates submitted for further analysis. The green lines represent the root mean square (RMS) and the red lines five times the RMS of the baseline noise. Reprinted from Dunevall et al. (2015), with permission from the American Chemical Society.
Figure 9
Figure 9
Schematic illustration of a proposed mechanism of vesicle impact electrochemical cytometry (VIEC).
Figure 10
Figure 10
(A,B) Amperometric traces for a nanotip conical carbon-fiber microelectrode pushed against a pheochromocytoma (PC12) cell without breaking into the cytoplasm (A) or placed inside a PC12 cell (B). (C) Amplified amperometric current trace. (D) Normalized frequency histograms describing the distribution of the vesicular catecholamine amount as quantified from untreated PC12 cells by intracellular vesicle electrochemical cytometry (red, n = 1,017 events from 17 cells) and by K+-stimulated exocytosis at the same electrode (black, n = 1,128 events from 17 cells). Bin size: 2 × 10⁴ molecules. Fits were obtained from a log-normal distribution of the data. Reprinted from Li X. et al. (2015), with permission from Wiley Online Library.
Figure 11
Figure 11
Schematic representation of (A) single-cell amperometry (SCA) and (B) intracellular vesicle impact electrochemical cytometry (IVIEC). Reprinted from Ren et al. (2017), with permission from Wiley Online Library.
Figure 12
Figure 12
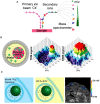
(A) Principle of nano secondary ion mass spectrometry (NanoSIMS) measurement. (B) Correlation of transmission electron microscopy (TEM) and NanoSIMS imaging to study the distribution of dopamine loading inside single vesicles of PC12 by treatment with 13C-L-DOPA and reserpine. From left to right: schematic of a dense core vesicle; 3D surface plots of TEM signals and NanoSIMS signal of 13C14N. (C) The basic concept of a cell pellet embedded in epoxy resin and SIMS concentration imaging. Reprinted from Lovric et al. (2017), Thomen et al. (2020), with permission from the American Chemical Society.
Figure 13
Figure 13
Schematic diagram of resistive pulse-vesicle impact electrochemical cytometry (RP-VIEC). (A) Electrode configuration for RP-VIEC. Amplifier 1 records the RP at a potential of +13 mV vs. Ag/AgCl reference electrode. Amplifier 2 records the current spike for VIEC with electrode potential set to +700 mV vs. the same reference electrode. (B–D) Schematics showing a cycle induced by periodic pressure: (B) Pressure is applied to push a vesicle across the nanopore and generate an RP signal. (C) The vesicle attaches on the electrode surface and is surrounded by the outflowing buffer with relatively high osmolality (similar to vesicular lumen). LO, low osmolarity; HO, high osmolality. (D) Suspended pressure results in capillary force (CF) stopping solution outflow. The vesicle on the surface opens by electroporation aided by the relatively low osmolarity of the surrounding solution. Electroactive content of the vesicle is electrooxidized and generates a current spike. Reprinted from Zhang et al. (2020), with permission from the American Chemical Society.

Similar articles

Cited by

References

    1. Abramov E., Dolev I., Fogel H., Ciccotosto G. D., Ruff E., Slutsky I. (2009). Amyloid-beta as a positive endogenous regulator of release probability at hippocampal synapses. Nat. Neurosci. 12, 1567–1576. 10.1038/nn.2433 - DOI - PubMed
    1. Amemiya S., Kim J., Izadyar A., Kabagambe B., Shen M., Ishimatsu R. (2013). Electrochemical sensing and imaging based on ion transfer at liquid/liquid interfaces. Electrochim. Acta 110, 836–845. 10.1016/j.electacta.2013.03.098 - DOI - PMC - PubMed
    1. Borges R. (2013). The ATP or the natural history of neurotransmission. Purinergic Signal 9, 5–6. 10.1007/s11302-012-9330-7 - DOI - PMC - PubMed
    1. Borges R., Travis E. R., Hochstetler S. E., Wightman R. M. (1997). Effects of external osmotic pressure on vesicular secretion from bovine adrenal medullary cells. J. Biol. Chem. 272, 8325–8331. 10.1074/jbc.272.13.8325 - DOI - PubMed
    1. Brito-Moreira J., Paula-Lima A. C., Bomfim T. R., Oliveira F. B., Sepulveda F. J., De Mello F. G., et al. . (2011). Abeta oligomers induce glutamate release from hippocampal neurons. Curr. Alzheimer Res. 8, 552–562. 10.2174/156720511796391917 - DOI - PubMed

LinkOut - more resources