

Comparison of Canine and Feline Meningiomas Using the Apparent Diffusion Coefficient and Fractional Anisotropy
- PMID: 33506001
- PMCID: PMC7829344
- DOI: 10.3389/fvets.2020.614026
Comparison of Canine and Feline Meningiomas Using the Apparent Diffusion Coefficient and Fractional Anisotropy
Abstract
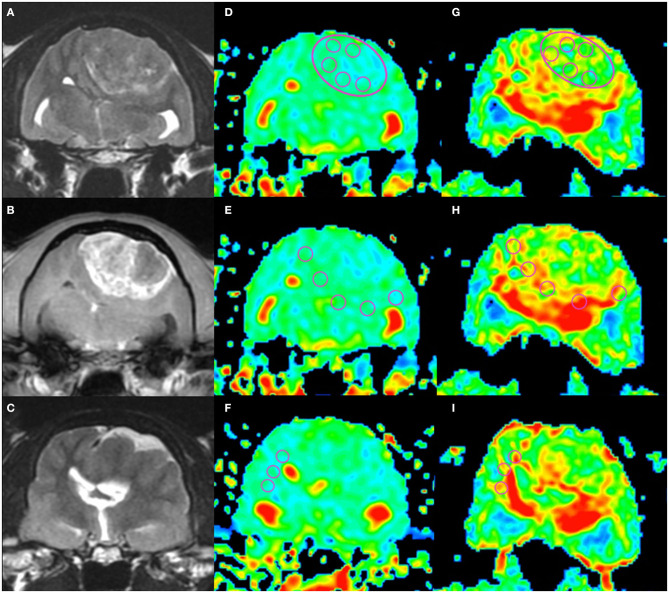
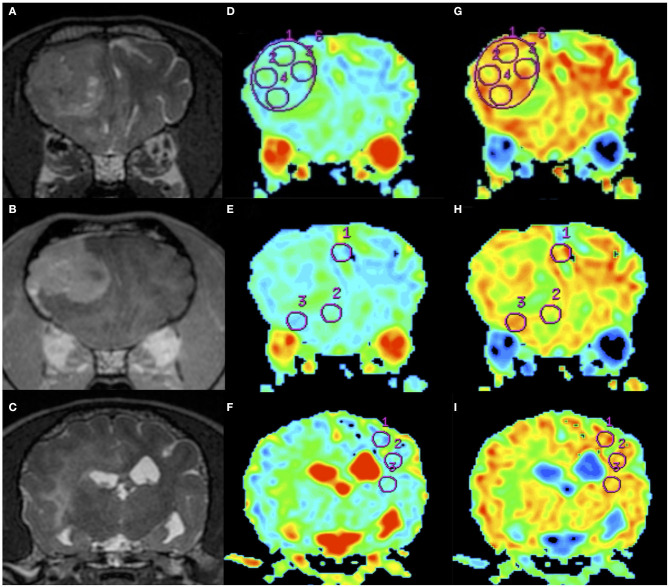
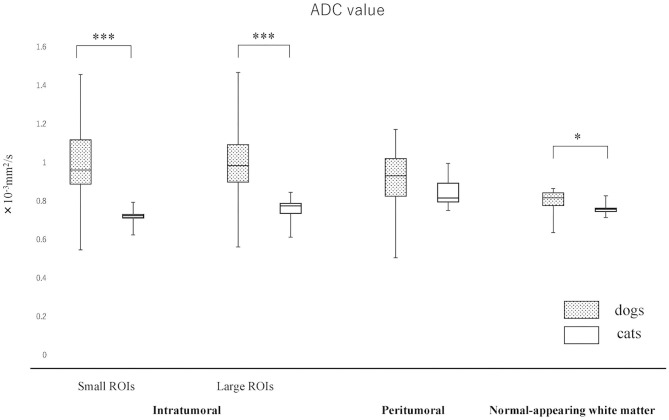
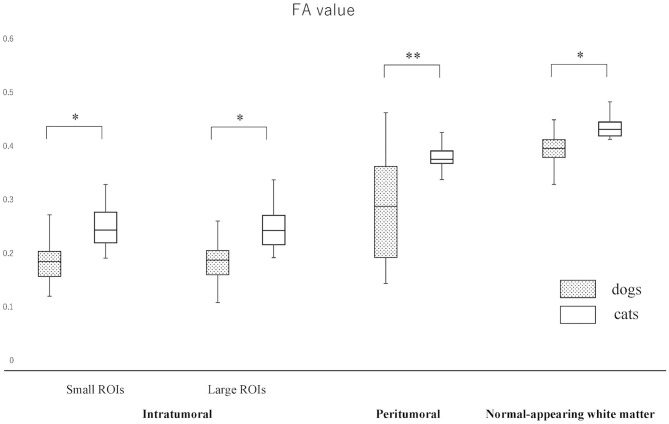
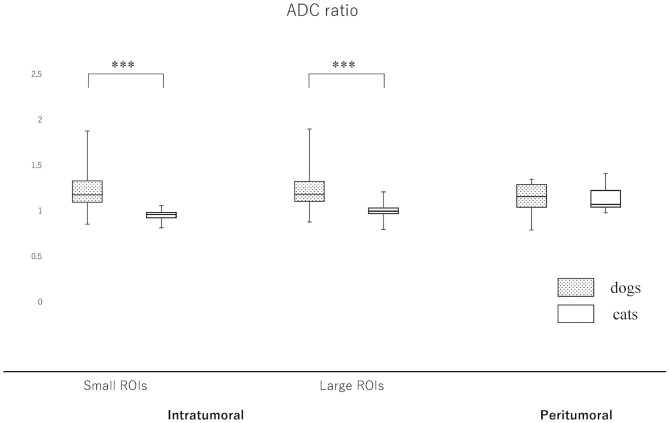
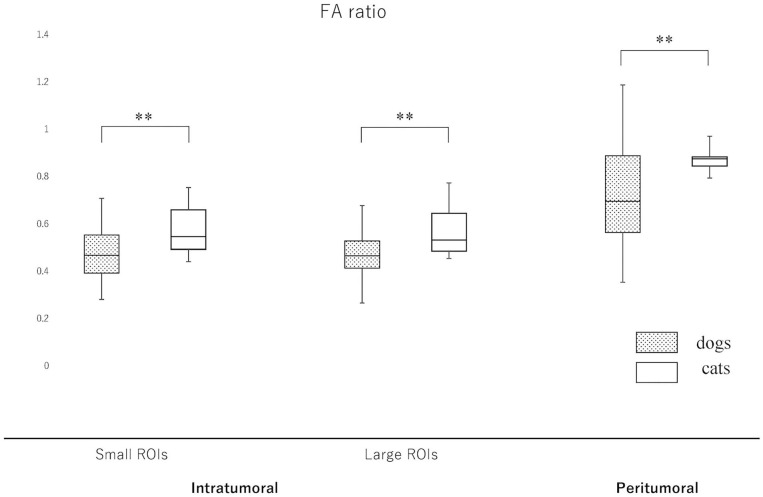
Meningiomas are the most common intracranial tumor in dogs and cats, and their surgical resection is often performed because they are present on the brain surface. Typical meningiomas show comparatively characteristic magnetic resonance imaging findings that lead to clinical diagnosis; however, it is necessary to capture not only macroscopic changes but also microstructural changes to devise a strategy for surgical resection and/or quality of removal. To visualize such microstructural changes, diffusion-weighted imaging (DWI) and diffusion tensor imaging (DTI) have been used in human medicine. The aim of this retrospective study was to investigate the different characteristics of the apparent diffusion coefficient (ADC) from DWI and fractional anisotropy (FA) from DTI of meningioma between dogs and cats. Statistical analyses were performed to compare ADC and FA values between the intratumoral or peritumoral regions and normal-appearing white matter (NAWM) among 13 dogs (13 lesions, but 12 each in ADC and FA analysis) and six cats (seven lesions). The NAWM of cats had a significantly lower ADC and higher FA compared to dogs. Therefore, for a comparison between dogs and cats, we used ADC and FA ratios that were calculated by dividing the subject (intra- or peritumoral) ADC and FA values by those of NAWM on the contralateral side. Regarding the intratumoral region, feline meningiomas showed a significantly lower ADC ratio and higher FA ratio than canine meningiomas. This study suggested that ADC and FA may be able to distinguish a meningioma that is solid and easy to detach, like as typical feline meningiomas.
Keywords: cats; diffusion tensor imaging; diffusion-weighted imaging; dogs; magnetic resonance imaging; meningioma.
Copyright © 2021 Wada, Hasegawa, Hamamoto, Yu, Asada, Fujiwara-Igarashi and Fujita.
Conflict of interest statement
MW is employed by the company ORM Co, Ltd., which provides veterinary diagnostic imaging advisory services. The remaining authors declare that the research was conducted in the absence of any commercial or financial relationships that could be construed as a potential conflict of interest.
Figures
Similar articles
-
Diffusion tensor imaging provides an insight into the microstructure of meningiomas, high-grade gliomas, and peritumoral edema.J Comput Assist Tomogr. 2012 Sep-Oct;36(5):577-82. doi: 10.1097/RCT.0b013e318261e913. J Comput Assist Tomogr. 2012. PMID: 22992609
-
Tumor extension in high-grade gliomas assessed with diffusion magnetic resonance imaging: values and lesion-to-brain ratios of apparent diffusion coefficient and fractional anisotropy.Acta Radiol. 2006 Apr;47(3):311-9. doi: 10.1080/02841850500539058. Acta Radiol. 2006. PMID: 16613314
-
Differentiation between classic and atypical meningiomas with use of diffusion tensor imaging.AJNR Am J Neuroradiol. 2008 Oct;29(9):1630-5. doi: 10.3174/ajnr.A1170. Epub 2008 Jun 26. AJNR Am J Neuroradiol. 2008. PMID: 18583409 Free PMC article.
-
The role of diffusion tensor imaging and fractional anisotropy in the evaluation of patients with idiopathic normal pressure hydrocephalus: a literature review.Neurosurg Focus. 2016 Sep;41(3):E12. doi: 10.3171/2016.6.FOCUS16192. Neurosurg Focus. 2016. PMID: 27581308 Review.
-
Diffusion-weighted MR of the brain: methodology and clinical application.Radiol Med. 2005 Mar;109(3):155-97. Radiol Med. 2005. PMID: 15775887 Review. English, Italian.
Cited by
-
Regional ADC values of the morphologically normal canine brain.Front Vet Sci. 2023 Nov 8;10:1219943. doi: 10.3389/fvets.2023.1219943. eCollection 2023. Front Vet Sci. 2023. PMID: 38026624 Free PMC article.
-
Diffusion Tensor Imaging in Syringomyelia Secondary to Chiari Malformation in Cavalier King Charles Spaniel-A Preliminary Study.Animals (Basel). 2022 Dec 2;12(23):3405. doi: 10.3390/ani12233405. Animals (Basel). 2022. PMID: 36496926 Free PMC article.
-
Relationship between admission vitals and brain herniation in 32 cats: a retrospective study.J Feline Med Surg. 2022 Aug;24(8):770-778. doi: 10.1177/1098612X211048639. Epub 2021 Oct 6. J Feline Med Surg. 2022. PMID: 34612748 Free PMC article.
-
Temporal and sequence-related variability in diffusion-weighted imaging of presumed cerebrovascular accidents in the dog brain.Front Vet Sci. 2022 Nov 7;9:1008447. doi: 10.3389/fvets.2022.1008447. eCollection 2022. Front Vet Sci. 2022. PMID: 36419725 Free PMC article.
-
An Illustrated Scoping Review of the Magnetic Resonance Imaging Characteristics of Canine and Feline Brain Tumors.Animals (Basel). 2024 Mar 29;14(7):1044. doi: 10.3390/ani14071044. Animals (Basel). 2024. PMID: 38612283 Free PMC article.
References
LinkOut - more resources
Full Text Sources
Other Literature Sources
Miscellaneous