

An updated histology recode for the analysis of primary malignant and nonmalignant brain and other central nervous system tumors in the Surveillance, Epidemiology, and End Results Program
- PMID: 33506208
- PMCID: PMC7813198
- DOI: 10.1093/noajnl/vdaa175
An updated histology recode for the analysis of primary malignant and nonmalignant brain and other central nervous system tumors in the Surveillance, Epidemiology, and End Results Program
Abstract
Background: There are over 100 histologically distinct types of primary malignant and nonmalignant brain and other central nervous system (CNS) tumors. Our study presents recent trends in the incidence of these tumors using an updated histology recode that incorporates major diagnostic categories listed in the 2016 World Health Organization Classification of Tumours of the CNS.
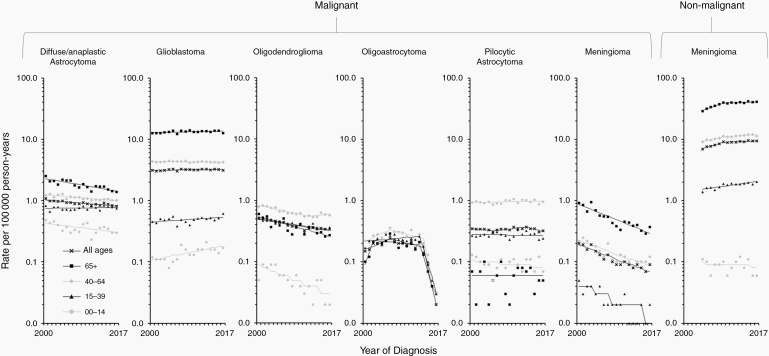
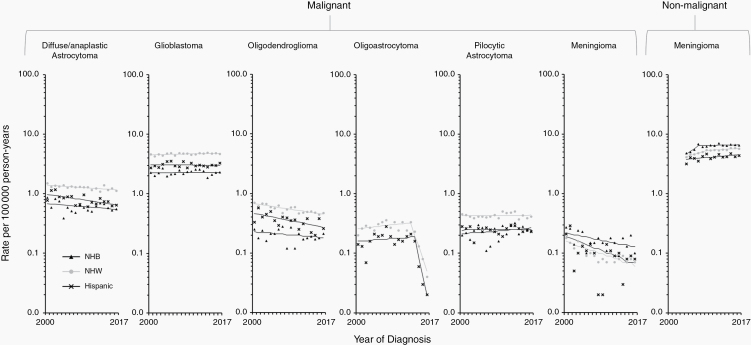
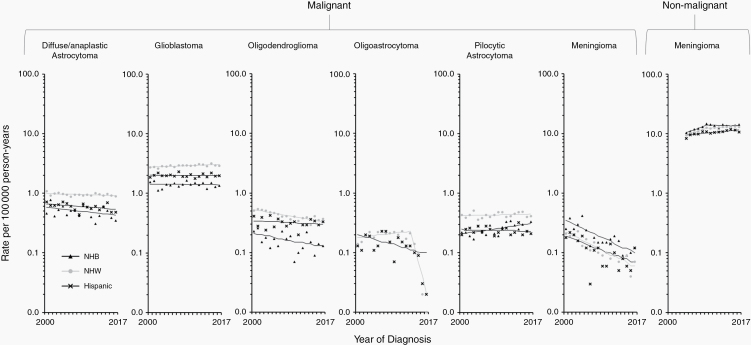
Methods: We used data from the SEER-21 registries for patients of all ages diagnosed in 2000-2017. We calculated age-adjusted incidence rates and fitted a joinpoint regression to the observed data to estimate the Annual Percent Change and 95% confidence intervals over the period 2000-2017.
Results: There were 315,184 new malignant (34.2%; 107,890) and nonmalignant (65.8%; 207,294) brain tumor cases during 2004-2017. Nonmalignant meningioma represented 46.5% (146,498) of all brain tumors (malignant and nonmalignant), while glioblastoma represented 50.8% (54,832) of all malignant tumors. Temporal trends were stable or declining except for nonmalignant meningioma (0.7% per year during 2004-2017). Several subtypes presented decreases in trends in the most recent period (2013-2017): diffuse/anaplastic astrocytoma (-1.3% per year, oligodendroglioma (-2.6%), pilocytic astrocytoma (-3.8%), and malignant meningioma (-5.9%).
Conclusions: Declining trends observed in our study may be attributable to recent changes in diagnostic classification and the coding practices stemming from those changes. The recode used in this study enables histology reporting to reflect the changes. It also provides a first step toward the reporting of malignant and nonmalignant brain and other CNS tumors in the Surveillance, Epidemiology, and End Results (SEER) Program by clinically relevant histology groupings.
Keywords: brain tumors; classifications; incidence; trends.
© The Author(s) 2020. Published by Oxford University Press, the Society for Neuro-Oncology and the European Association of Neuro-Oncology.
Figures
References
-
- Siegel RL, Miller KD, Jemal A. Cancer statistics, 2020. CA Cancer J Clin. 2020;70(1):7–30. - PubMed
-
- Howlader N, Noone AM, Krapcho M, et al. SEER Cancer Statistics Review, 1975–2017, National Cancer Institute; Bethesda, MD, based on November 2019 SEER data submission, posted to the SEER web site, April 2020 https://seer.cancer.gov/csr/1975_2017/.
-
- SEER*Explorer: An interactive website for SEER cancer statistics [Internet]. Surveillance research program National Cancer Institute; https://seer.cancer.gov/explorer/. Accessed March 12, 2020.
-
- Amirian ES, Ostrom QT, Liu Y, Barnholtz-Sloan JS, Bondy ML. Nervous system. In: Thun M, Linet MS, Cerhan JR, Haiman CA, Schottenfeld D, eds. Schottenfeld and Fraumeni Cancer Epidemiology and Prevention. New York: Oxford University Press; 2018: 1039–1060.
LinkOut - more resources
Full Text Sources