. 2021 Apr 2;72(8):2995-3011.
doi: 10.1093/jxb/erab033.

The F-box protein MIO1/SLB1 regulates organ size and leaf movement in Medicago truncatula

Affiliations

The F-box protein MIO1/SLB1 regulates organ size and leaf movement in Medicago truncatula

Shaoli Zhou et al. J Exp Bot. .

Abstract

The size of leaf and seed organs, determined by the interplay of cell proliferation and expansion, is closely related to the final yield and quality of forage and crops. Yet the cellular and molecular mechanisms underlying organ size modulation remain poorly understood, especially in legumes. Here, MINI ORGAN1 (MIO1), which encodes an F-box protein SMALL LEAF AND BUSHY1 (SLB1) recently reported to control lateral branching in Medicago truncatula, was identified as a key regulator of organ size. We show that loss-of-function of MIO1/SLB1 severely reduced organ size. Conversely, plants overexpressing MIO1/SLB1 had enlarged organs. Cellular analysis revealed that MIO1/SLB1 controlled organ size mainly by modulating primary cell proliferation during the early stages of leaf development. Biochemical analysis revealed that MIO1/SLB1 could form part of SKP1/Cullin/F-box (SCF) E3 ubiquitin ligase complex, to target BIG SEEDS1 (BS1), a repressor of primary cell division, for degradation. Interestingly, we found that MIO1/SLB1 also played a key role in pulvinus development and leaf movement by modulating cell proliferation of the pulvinus as leaves developed. Our study not only demonstrates a conserved role of MIO1/SLB1 in the control of organ size in legumes, but also sheds light on the novel function of MIO1/SLB1 in leaf movement.

Keywords: BIG SEEDS1 (BS1); F-box protein; MINI ORGAN1 (MIO1)/SMALL LEAF AND BUSHY1 (SLB1); SCF E3 ligase; organ size; proteasome-mediated degradation; pulvinus.


Figures

Fig. 1.
Fig. 1.
Phenotype comparisons between the wild type (WT) and mio1 mutant. (A, B) Four-week-old seedlings of the WT (A) and mio1-1 mutant (B). Scale bar=2 cm. (C, D) Branch of a 12-week-old plant of the WT (C) and mio1-1 mutant (D). Scale bar=2 cm. (E, F) The fifth compound leaf of five-week-old seedlings of the WT (E) and mio1-1 mutant (F). Insets provide a close-up view of the stipules. Scale bar=1 cm for leaves, 0.5 cm for stipules. (G) Flower (open petal) of the WT (upper) and mio1-1 mutant (bottom) plants. Scale bar=2 mm. (H) Comparison of the terminal leaflet length (TLL), terminal leaflet width (TLW), terminal leaflet area (TLA), and terminal leaflet perimeter (TLP) of the WT and mio1-1 mutant plants. Values indicate the mean±SD (n=3 biological replicates, with 20 plants per replicate); asterisks indicate significant differences from the WT (**P<0.01; Student’s t-test).
Fig. 2.
Fig. 2.
Molecular cloning and characterization of MIO1/SLB1. (A) The MIO1/SLB1 gene structure and Tnt1 retrotransposon insertion sites in the mio1 mutant alleles. White and grey boxes represent the exon and 3 UTR, respectively, and the bold line represents the intron. Triangles indicate the Tnt1 insertion sites of mio1 mutant alleles, while the black and white ones indicate mutants obtained from forward and reverse screening, respectively. (B-J) Genetic complementation of the mio1 mutant. Five-week-old seedlings of the WT (B), mio1 mutant (C), and complemented mio1 line proMIO1::MIO1/mio1 (D). The fifth trifoliate leaf of five-week-old seedling of WT (E), mio1 mutant (F), and complemented mio1 line proMIO1::MIO1/mio1 (G). Flower (open petal) of the WT (H), mio1 mutant (I), and complemented mio1 line proMIO1::MIO1/mio1 (J). Scale bars=2 cm (B-D), 1 cm (E-G), 2 mm (H-J). (K) RT–PCR analysis of MIO1/SLB1 gene expression in the complemented mio1 lines. The expression of MIO1/SLB1 was restored in the independent complemented line 1 (1#) and line 2 (2#). Total RNA was extracted from the shoot apices of five-week-old seedlings. MW, molecular weight markers; MtActin was used as an internal control. (L) Phylogenetic analysis of MIO1/SLB1 and its closely related homologs. SAP from Arabidopsis thaliana, LL from Cucumis sativus, with other homologs from several Fabaceae species including Trifolium pratense, Lupinus angustifolius, Cicer arietinum, Lotus japonicus, Glycine max, Cajanus cajan, Phaseolus vulgaris, Vigna unguiculata, Vigna radiata, Vigna angularis, Arachis ipaensis, and Arachis duranensis. (M) Amino acid sequence alignment of MIO1/SLB1 and its closely related homologs. The red and green underlining indicates the F-box and WD40 repeat domain, respectively. SAP from A. thaliana, LL from C. sativus, Tp57577 from T. pratense, Lup029705 from L. angustifolius, cicar.ICC4958 from C. arietinum, Lj2g3v3337320 from L. japonicus, and Glyma.02G304600 and Glyma.14G009200 from G. max. Dotted lines indicate the abridged conserved amino acids.
Fig. 3
Fig. 3
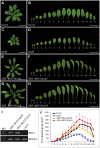
Ectopic expression of MIO1/SLB1 in Arabidopsis sod3-3 (35S::MIO1/sod3) mutant and wild type (35S::MIO1/ Col-0) plants. (A-H) Five-week-old seedlings of Col-0 (A), sod3-3 mutant (C), 35S::MIO1/sod3 (E), and 35S::MIO1/Col-0 (G). Scale bar=2cm. The first to sixteenth leaves of five-week-old seedlings of Col-0 (B), sod3-3 mutant (D), 35S::MIO1/sod3 (F), and 35S::MIO1/Col-0 (H). Scale bar=2cm. (I) RT–PCR analysis of MIO1/SLB1 expression in the complemented sod3 line and Col-0 plants. (J) The first to sixteenth leaves area of five-week-old seedlings of the Col-0, sod3-3 mutant, 35S::MIO1/sod3, and 35S::MIO1/Col-0. The leaves 1 and 2 are cotyledons. Values indicate the mean±SD (n=3 biological replicates; 10 plants per replicate). Asterisks indicate significant differences from the WT (**P<0.01, *P<0.05; Student’s t-test).
Fig. 4.
Fig. 4.
Expression pattern of MIO1/SLB1 and sub-cellular localization of MIO1/SLB1. (A) Expression of MIO1/SLB1 in different plant tissues analysed by qRT–PCR, with MtActin used as an internal control. Values indicate the mean±SD (n=3). (B-H) RNA in situ hybridization of MIO1. Cross (B) and longitudinal (C and D) sections of shoot apices from three-week-old wild type (WT) seedlings (vegetative stage) that were hybridized with the MIO1/SLB1 anti-sense probe. Longitudinal sections of shoot apices from 10-week-old WT plants (E), floral meristem (F), and 1 mm flower bud (G) that were hybridized with the MIO1/SLB1 anti-sense probe. P+number, plastochron; FM, floral meristem; AB, axillary buds; P, petal; C, carpel; S, stamen; O, ovule; asterisks denote the shoot apical meristem. The black arrow points to the pulvinus primordium. The MIO1/SLB1 sense probe was used as the control (H). Scale bar=50 μm. (I-L) GUS staining of single leaf (I and J) and trifoliate leaf (K and L) of four-week-old seedlings of proMIO1::GUS transgenic plants. J and L are the close-up views of the framed area in I and K, respectively. Scale bars=1 cm (I and K), 2 mm (J and L). (M-O) Sub-cellular localization of the MIO1-GFP (M) and GFP-MIO1 (N) fusion proteins. Free GFP driven by the CaMV35S promoter was used as the control (O). Scale bar=20 μm.
Fig. 5.
Fig. 5.
MIO1/SLB1 positively regulates primary cell division during leaf development. (A) MIO1/SLB1 transcript abundance in the wild type (WT) and MIO1-overexpressing line, with MtActin used as an internal control. Values indicate the mean±SD (n=3); asterisks indicate significant differences with respect to the WT (**P<0.01; Student’s t-test). (B-D) The fifth compound leaf of five-week-old seedlings of WT (B), mio1 mutant (C), and MIO1-overexpressing line 35S::MIO1 (D). Insets are close-up views of stipules. Scale bars=1 cm for leaves, 0.5 cm for stipules. (E) Flower (open petal) of the WT (left), mio1 mutant (middle), and MIO1-overexpressing (right) plants. Scale bar=1 cm. (F, G) The pod (F) and seed (G) of the WT (upper) and MIO1-overexpressing (bottom) plants. Scale bars=1 cm (E), 0.5 cm (F). (H-J) The epidermal cell outlines for the abaxial epidermis of a mature leaflet of the WT (H), mio1 mutant (I), and MIO1-overexpressing line (J). These pictures were outlined with Photoshop software based on photos from the microscope observations. Green and yellow-colored cells represent epidermal and guard cells, respectively. (K) The leaf epidermal cell area of the WT, mio1 mutant, and MIO1-overexpressing line. Values indicate the means±SD (n=3 biological replicates, with 10 plants per replicate); asterisks indicate significant differences from the WT (*P<0.05, **P<0.01; Student’s t-test). (L) Leaflet area of the terminal leaflet (TT), left lateral leaflet (LLL), and right lateral leaflet (RLL) of the WT, mio1 mutant, and MIO1-overexpressing line. Values indicate the mean±SD (n=3 biological replicates, with 10 plants per replicate); asterisks indicate significant differences from the WT (**P<0.01; Student’s t-test). (M) Average total number of epidermal cells for the adaxial epidermis of a mature leaflet of the WT, mio1 mutant, and MIO1/SLB1 overexpressing-line. Values indicate the mean±SD (n=3 biological replicates, with 10 plants per replicate); asterisks indicate significant differences from the WT (**P<0.01; Student’s t-test). (N-P) Statistical analysis of terminal leaflet abaxial epidermal cell area (N), terminal leaflet area (O), and total number of epidermal cells for the abaxial epidermis (P) of P5-P9 (plastochron 5 to plastochron 9) of WT, mio1 mutant, and MIO1-overexpressing line. Values indicate the mean±SD (n=3 biological replicates, with 10 plants per replicate); asterisks indicate significant differences from the WT (*P<0.05; **P<0.01, Student’s t-test). (Q) The stomatal index for the abaxial leaflet epidermis of the WT, mio1 mutant, and MIO1-overexpressing line. Values indicate the mean±SD (n=3 biological replicates, with 20 plants per replicate); asterisks indicate significant differences from the WT (*P<0.05, **P<0.01; Student’s t-test).
Fig. 6.
Fig. 6.
F-box protein MIO1/SLB1 physically interacts with, and regulates BS1 stability. (A) Yeast two-hybrid (Y2H) assay showing the interaction between MIO1/SLB1 and MtASK. -2, SD/-Leu/-Trp; -4, SD/-Ade/-His/-Leu/-Trp. (B) Bimolecular fluorescence complementation (BiFC) assay showing the interaction between MIO1/SLB1 and MtASK in the nuclei of tobacco (Nicotiana benthamiana) leaf epidermal cells. MIO1-nYFP and MtASK-cYFP were coexpressed in the leaves of tobacco; DAPI signals indicate the nuclei. (C) Y2H assay showing the interaction between MIO1/SLB1 and BS1. MIO1/SLB1 interacts with BS1 through its WD40 repeat domain. AD+BD was used as the control. -2, SD/-Leu/-Trp; -4, SD/-Ade/-His/-Leu/-Trp. (D) BiFC assay showing the interaction between MIO1/SLB1 and BS1 in the nuclei of tobacco leaf epidermal cells. MIO1-nYFP and BS1-cYFP are coexpressed in leaves of tobacco, DAPI signals indicate the nuclei. (E) N-terminal WD40 repeat domain of MIO1/SLB1 (MIO1 WD40) interacts with BS1 in vitro. His-BS1 was pulled down (PD) by GST-MIO1 WD40 immobilized on glutathione sepharose, and analysed by immunoblotting (IB) using an anti-His antibody. GST was used as a negative control. (F) MIO1/SLB1 regulates BS1 stability in vitro. The His-BS1 fusion protein was detected with the His antibody. MG132 was used to inhibit the proteasome activity. The total proteins extracted from plants were used as a loading control. (G) Yeast two-hybrid (Y2H) assay showing the interaction between MIO1/SLB1 and MtKIX. -2, SD/-Leu/-Trp; -4, SD/-Ade/-His/-Leu/-Trp. (H-K) Expression of MtCYCD3;3 (H), MtCDKB1;1 (I), MtE2Fb (J), and MtKRP3 (K) in the WT and mio1 mutant, for which MtActin served as the internal control. SAM, shoot apical meristem; P, plastochron. Values indicate the mean±SD (n=3); asterisks indicate significant differences from the WT (*P<0.05, **P<0.01; Student’s t-test). (L-U) RNA in situ hybridization of MtH4 (Medicago truncatula HISTONE4) and MtCYCD3;3. Longitudinal sections of shoot apices (SAM+P1-P3) and P4 of the wild type (WT) and mio1 mutant were hybridized with anti-sense probe of MtH4 (L to O) and MtCYCD3;3 (P to S). The shoot apices and P4 were collected from three-week-old WT and mio1 seedlings. P+number, plastochron; asterisks denote the shoot apical meristem. The MtH4 and MtCYCD3;3 sense probes were used as the control (T and U). Scale bar=50 μm.
Fig. 7.
Fig. 7.
MIO1/SLB1 rescues the leaf movement and pulvinus of the mio1 mutant. (A-C) MIO1/SLB1 restored the defective leaf movement of the mio1 mutant. A representative trifoliate leaf of wild type (WT) (A), mio1 mutant (B), and complemented mio1 line proMIO1::MIO1/mio1 (C) at night. Scale bar=1cm. (D-I) MIO1/SLB1 rescued the defective pulvinus structure of the mio1 mutant. Scanning electron microscope (SEM) images of WT (D and E), mio1 mutant (F and G), and complemented mio1 line (H and I). The pulvini were highlighted by the red dotted line. Open boxes in D, F, and H, indicate those areas shown in E, G, and I, respectively. Scale bar=100 μm (D, F, H),10 μm (E, G, I). (J-L) Pulvinus longitudinal-sections of the WT (J), mio1 mutant (K), and complemented mio1 line (L). The pulvinus region in each longitudinal section is highlighted by the red dotted line. Scale bar=10 μm.

Similar articles

Cited by

References

    1. Andersen SU, Buechel S, Zhao Z, Ljung K, Novák O, Busch W, Schuster C, Lohmann JU. 2008. Requirement of B2-type cyclin-dependent kinases for meristem integrity in Arabidopsis thaliana. The Plant Cell 20, 88–100. - PMC - PubMed
    1. Andriankaja M, Dhondt S, De Bodt S, et al. . 2012. Exit from proliferation during leaf development in Arabidopsis thaliana: a not-so-gradual process. Developmental Cell 22, 64–78. - PubMed
    1. Baekelandt A, Pauwels L, Wang Z, et al. . 2018. Arabidopsis leaf flatness is regulated by PPD2 and NINJA through repression of CYCLIN D3 genes. Plant Physiology 178, 217–232. - PMC - PubMed
    1. Baute J, Polyn S, De Block J, Blomme J, Van Lijsebettens M, Inzé D. 2017. F-Box protein FBX92 affects leaf size in Arabidopsis thaliana. Plant & Cell Physiology 58, 962–975. - PMC - PubMed
    1. Byzova MV, Franken J, Aarts MG, de Almeida-Engler J, Engler G, Mariani C, Van Lookeren Campagne MM, Angenent GC. 1999. Arabidopsis STERILE APETALA, a multifunctional gene regulating inflorescence, flower, and ovule development. Genes & Development 13, 1002–1014. - PMC - PubMed

Publication types

LinkOut - more resources