

Enhanced humoral immunity in breast cancer patients with high serum concentration of anti-HER2 autoantibody
- PMID: 33506656
- PMCID: PMC7926031
- DOI: 10.1002/cam4.3742
Enhanced humoral immunity in breast cancer patients with high serum concentration of anti-HER2 autoantibody
Abstract
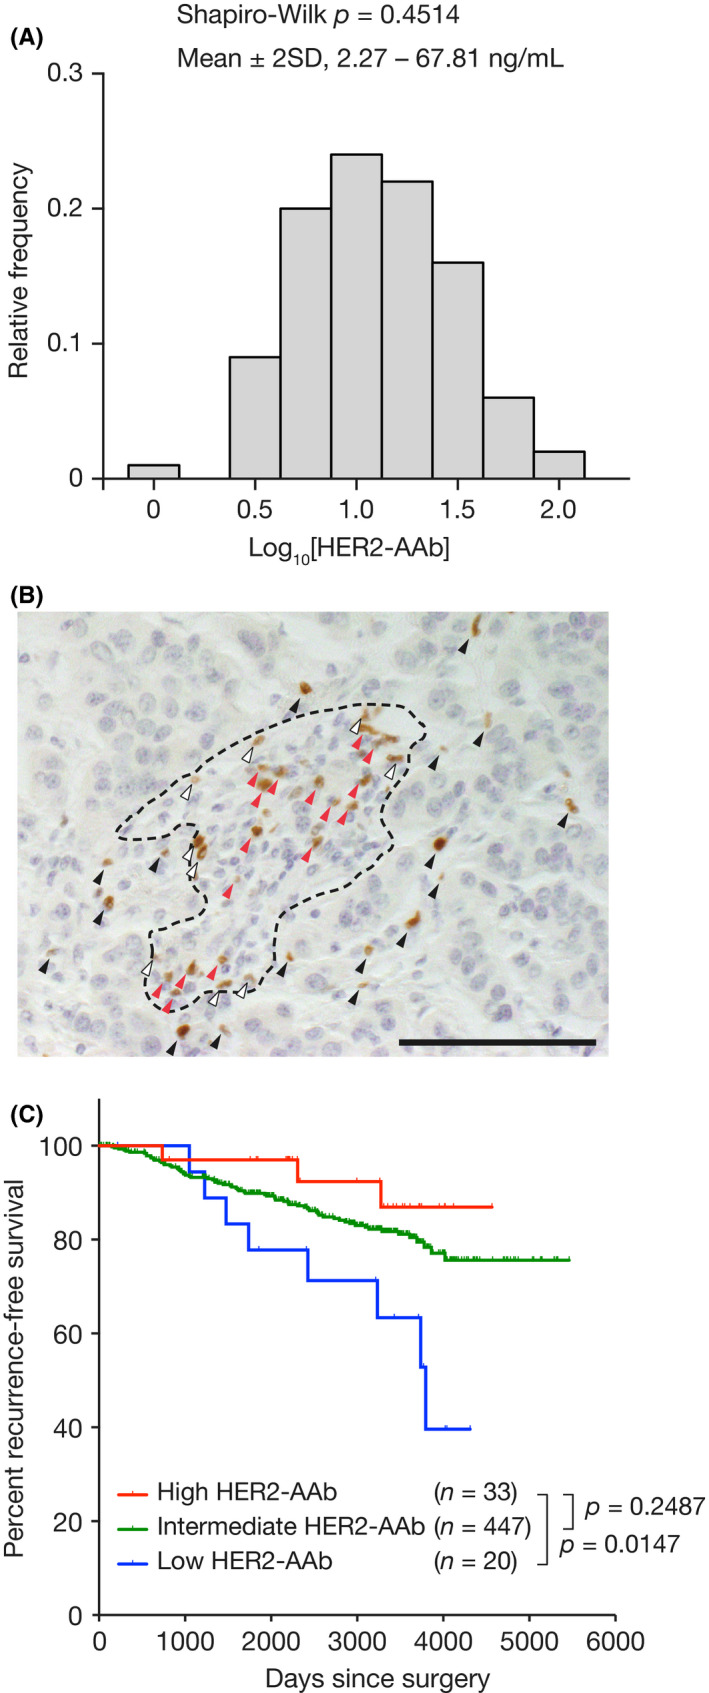
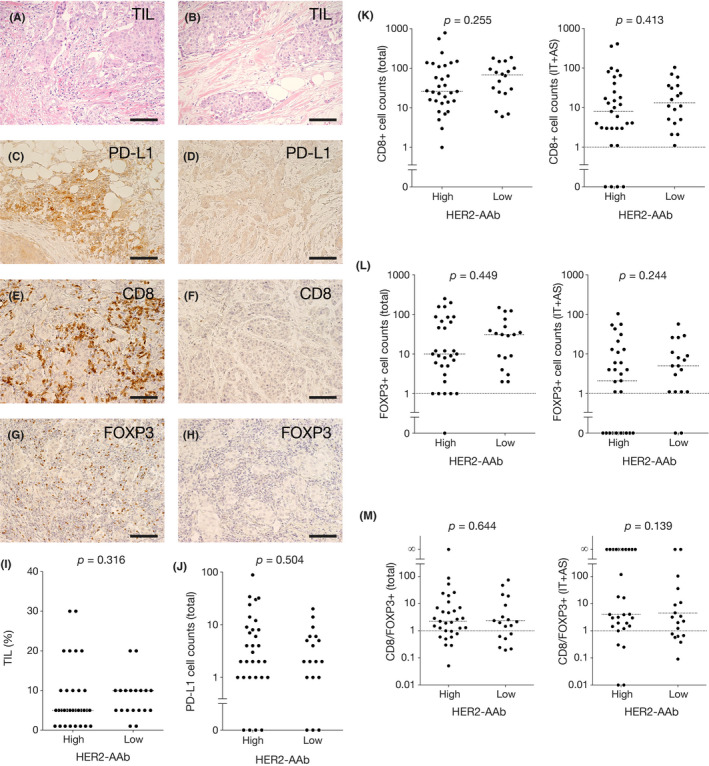
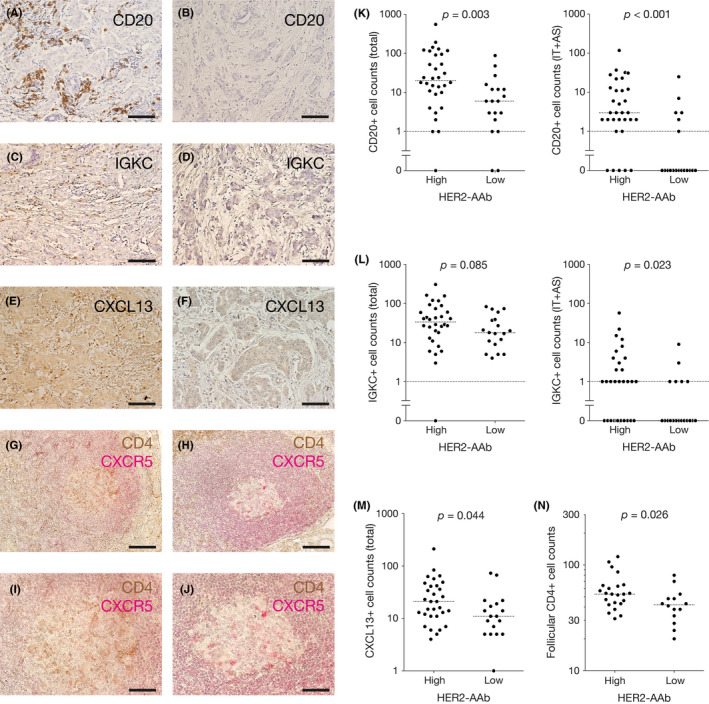
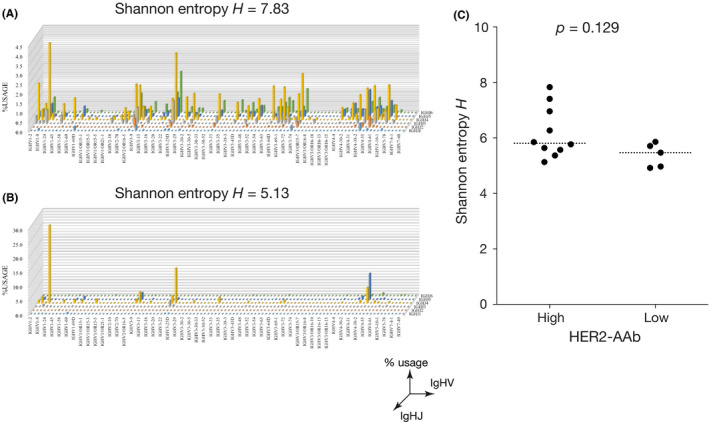
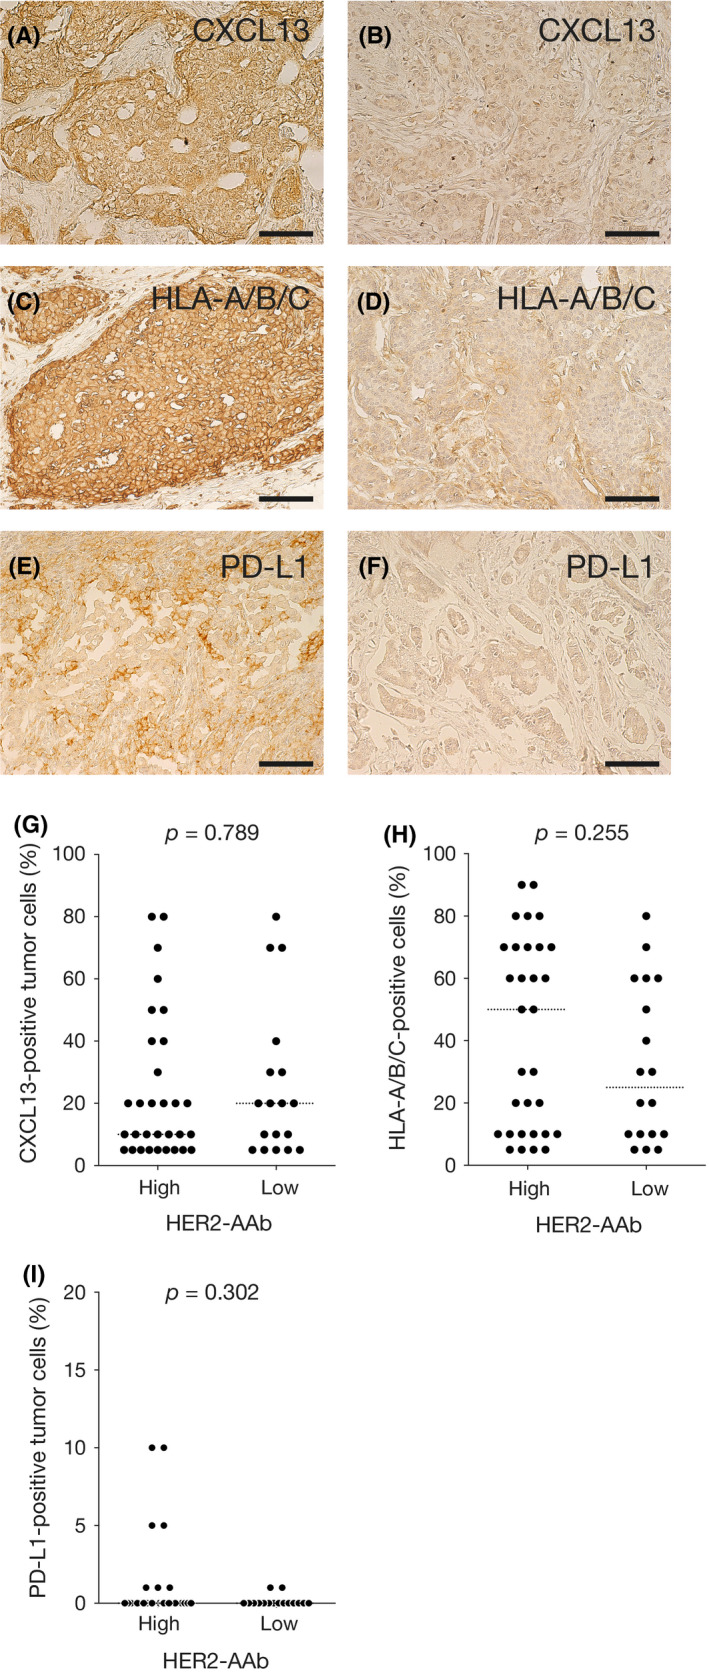
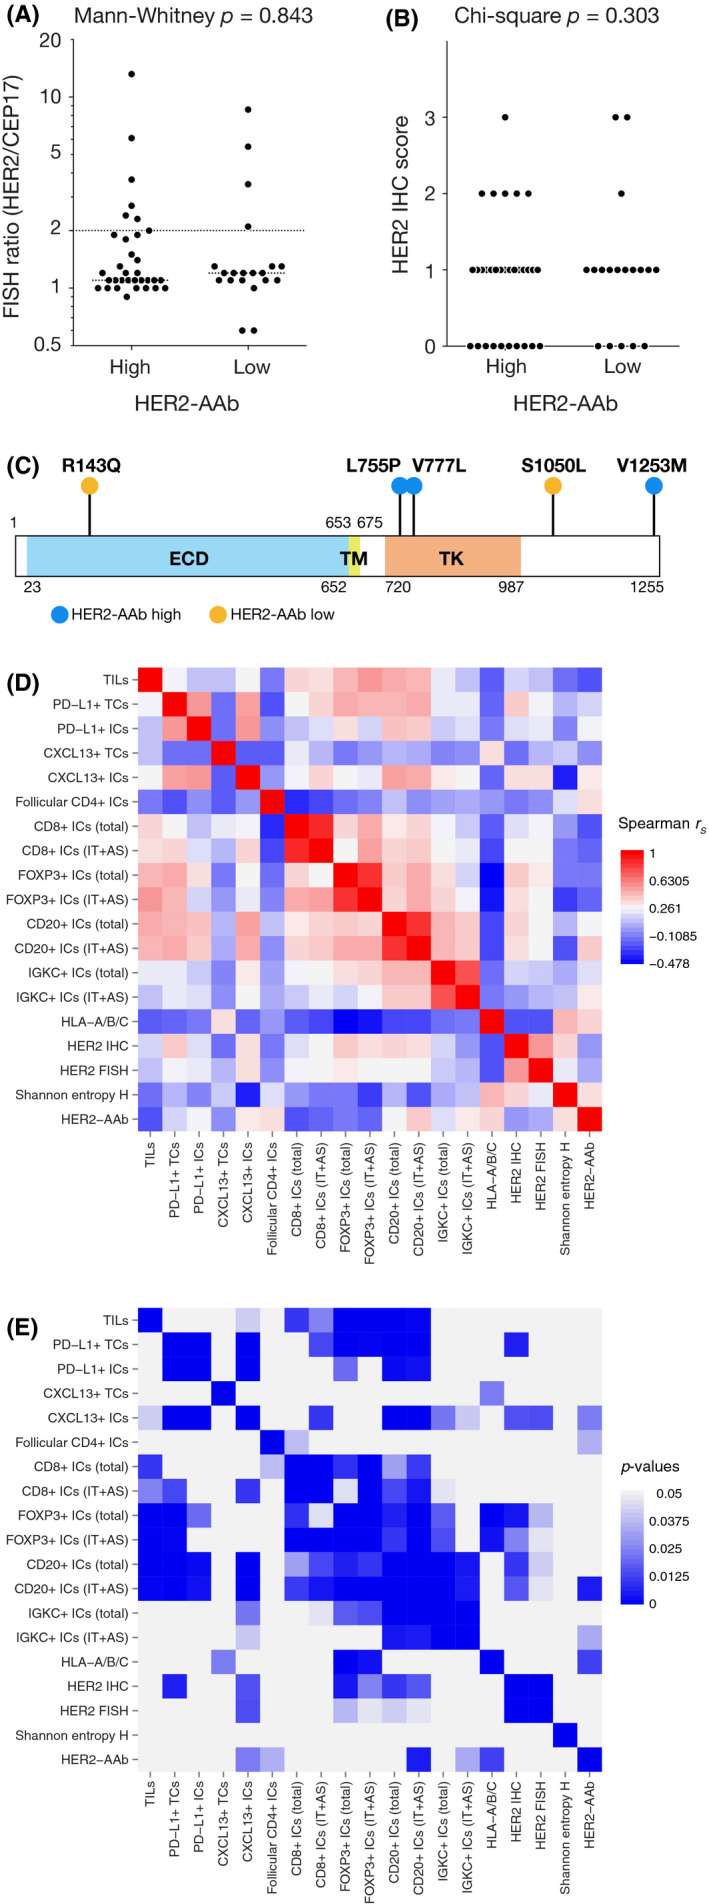
Humoral immunity plays a substantial role in the suppression of breast cancer. We have revealed that a high serum concentration of anti-HER2 autoantibody (HER2-AAb) is associated with favorable outcomes in patients with invasive breast cancer. Thus, we aimed to clarify the association between high serum concentration of HER2-AAb and humoral immune response in the tumor microenvironment. Out of 500 consecutive patients with invasive breast cancer, we selected those whose HER2-AAb values were high (n = 33) or low (n = 20) based on the distribution of HER2-AAb values of 100 healthy individuals. Tumor and regional lymph node formalin-fixed paraffin-embedded samples prepared from the surgical specimens were subjected to immunohistochemistry. We confirmed that the recurrence-free survival of the high HER2-AAb group was significantly longer than that of the low HER2-AAb group (p = 0.015). The numbers of tumor-infiltrating CD20+ immune cells (ICs) (p < 0.001), IGKC+ICs (p = 0.023), and CXCL13+ ICs (p = 0.044) were significantly higher in the high HER2-AAb group than in the low HER2-AAb group. The number of CD4+ ICs in the B-cell follicles of the regional lymph nodes was also significantly greater in the high HER2-AAb group than in the low HER2-AAb group (p = 0.026). Our findings indicate that a high level of HER2-AAb is associated with enhanced humoral immunity against breast cancer and thus may provide a rationale for the association of HER2-AAb with favorable prognosis.
Keywords: B-lymphocytes; CD4-positive T-lymphocytes; humoral immunity; tumor microenvironment; tumor-infiltrating lymphocytes.
© 2021 The Authors. Cancer Medicine published by John Wiley & Sons Ltd.
Conflict of interest statement
The authors declare that they have no conflict of interests.
Figures
Similar articles
-
Protective effect of naturally occurring anti-HER2 autoantibodies on breast cancer.Breast Cancer Res Treat. 2016 May;157(1):55-63. doi: 10.1007/s10549-016-3801-4. Epub 2016 Apr 25. Breast Cancer Res Treat. 2016. PMID: 27113738
-
A subset of activated fibroblasts is associated with distant relapse in early luminal breast cancer.Breast Cancer Res. 2020 Jul 14;22(1):76. doi: 10.1186/s13058-020-01311-9. Breast Cancer Res. 2020. PMID: 32665033 Free PMC article.
-
Tumour-infiltrating lymphocytes and response to neoadjuvant letrozole in patients with early oestrogen receptor-positive breast cancer: analysis from a nationwide phase II DBCG trial.Breast Cancer Res. 2020 May 14;22(1):46. doi: 10.1186/s13058-020-01285-8. Breast Cancer Res. 2020. PMID: 32410705 Free PMC article. Clinical Trial.
-
Immune infiltrates in the breast cancer microenvironment: detection, characterization and clinical implication.Breast Cancer. 2017 Jan;24(1):3-15. doi: 10.1007/s12282-016-0698-z. Epub 2016 May 2. Breast Cancer. 2017. PMID: 27138387 Review.
-
The Role of Immune Cells in Breast Tissue and Immunotherapy for the Treatment of Breast Cancer.Clin Breast Cancer. 2021 Feb;21(1):e63-e73. doi: 10.1016/j.clbc.2020.06.011. Epub 2020 Jul 2. Clin Breast Cancer. 2021. PMID: 32893093 Free PMC article. Review.
Cited by
-
Stromal and Immune Cell Dynamics in Tumor Associated Tertiary Lymphoid Structures and Anti-Tumor Immune Responses.Front Cell Dev Biol. 2022 Jul 8;10:933113. doi: 10.3389/fcell.2022.933113. eCollection 2022. Front Cell Dev Biol. 2022. PMID: 35874810 Free PMC article. Review.
-
Autoantibodies as biomarkers for breast cancer diagnosis and prognosis.Front Immunol. 2022 Nov 14;13:1035402. doi: 10.3389/fimmu.2022.1035402. eCollection 2022. Front Immunol. 2022. PMID: 36451832 Free PMC article. Review.
-
Revolutionizing anti-tumor therapy: unleashing the potential of B cell-derived exosomes.Front Immunol. 2023 Jun 5;14:1188760. doi: 10.3389/fimmu.2023.1188760. eCollection 2023. Front Immunol. 2023. PMID: 37342327 Free PMC article. Review.
-
An Eleven-microRNA Signature Related to Tumor-Associated Macrophages Predicts Prognosis of Breast Cancer.Int J Mol Sci. 2022 Jun 23;23(13):6994. doi: 10.3390/ijms23136994. Int J Mol Sci. 2022. PMID: 35805995 Free PMC article.
-
Syngeneic mouse model of human HER2+ metastatic breast cancer for the evaluation of trastuzumab emtansine combined with oncolytic rhabdovirus.Front Immunol. 2023 Apr 19;14:1181014. doi: 10.3389/fimmu.2023.1181014. eCollection 2023. Front Immunol. 2023. PMID: 37153626 Free PMC article.
References
Publication types
MeSH terms
Substances
LinkOut - more resources
Full Text Sources
Other Literature Sources
Medical
Research Materials
Miscellaneous
