. 2021 Jan 28:10:e63677.
doi: 10.7554/eLife.63677.

Stem cell transplantation rescued a primary open-angle glaucoma mouse model

Affiliations

Stem cell transplantation rescued a primary open-angle glaucoma mouse model

Siqi Xiong et al. Elife. .

Abstract

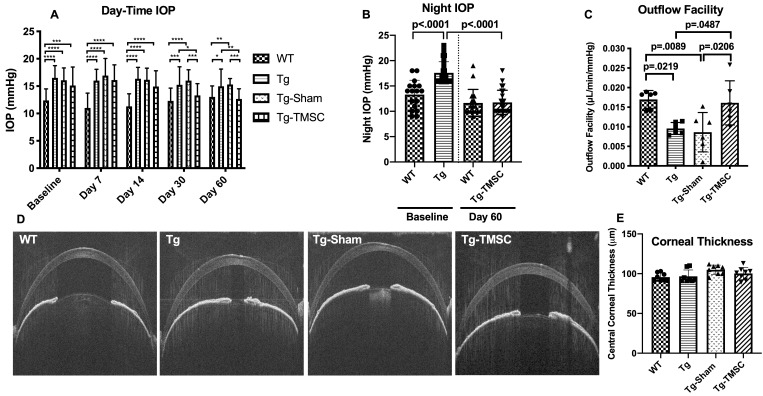
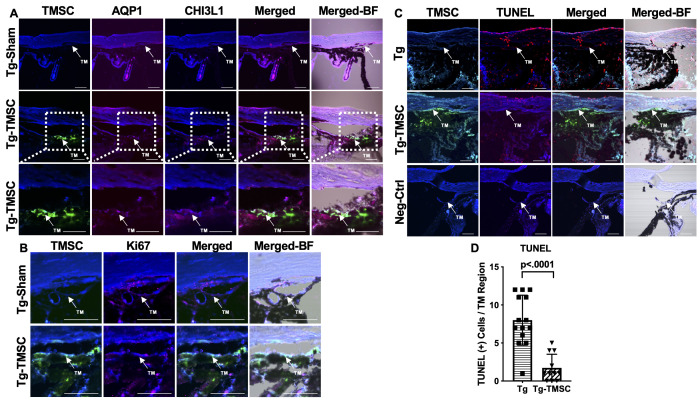
Glaucoma is a leading cause of irreversible blindness. In this study, we investigated if transplanted stem cells are able to rescue a glaucoma mouse model with transgenic myocilin Y437H mutation and explored the possible mechanisms. Human trabecular meshwork stem cells (TMSCs) were intracamerally transplanted which reduced mouse intraocular pressure, increased outflow facility, protected the retinal ganglion cells and preserved their function. TMSC transplantation also significantly increased the TM cellularity, promoted myocilin secretion from TM cells into the aqueous humor to reduce endoplasmic reticulum stress, repaired the TM tissue with extracellular matrix modulation and ultrastructural restoration. Co-culturing TMSCs with myocilin mutant TM cells in vitro promoted TMSCs differentiating into phagocytic functional TM cells. RNA sequencing revealed that TMSCs had upregulated genes related to TM regeneration and neuroprotection. Our results uncovered therapeutic potential of TMSCs for curing glaucoma and elucidated possible mechanisms by which TMSCs achieve the treatment effect.

Keywords: RNAseq; glaucoma; human; mouse; mouse model; regenerative medicine; stem cells; trabecular meshwork; transplantation.


Conflict of interest statement

SX, AK, ST, ET, EY, PK, XX No competing interests declared, YD The University of Pittsburgh has a patent named "trabecular meshwork stem cells" with Yiqin Du as one of the inventors.

Figures

Figure 1.
Figure 1.. Transplanted TMSCs reduce the IOP and increase the outflow facility of Tg-MyocY437H mice.
(A) Day-time IOP was measured in the wildtype mice (WT, n=26), Tg-MyocY437H mice (Tg, n=26), Tg mice treated with basal medium (Tg-Sham, n=26) and Tg mice with TMSC transplantation (Tg-TMSC, n=26). (B) Night IOP was measured in WT mice (n=17) and Tg-MyocY437H mice (n=24) before the treatment and 2 months post treatment. Data are presented as mean ± SD. (C) Outflow facility was evaluated at 2-month after TMSC transplantation (n=6 eyes/group). (D) Representative pictures of anterior OCT show the corneal thickness and anterior chamber angle in the mice at 2 months after transplantation. (E) The central corneal thickness was calculated from the OCT images (n=8 eyes/group). Data are presented as mean ± SD. Two-way ANOVA (A) or one-way ANOVA (B,C,E) followed by Tukey’s multiple comparisons test. *p<0.05, **p<0.01, ***p<0.001, **** p<0.0001.
Figure 1—figure supplement 1.
Figure 1—figure supplement 1.. Genotyping of transgenic Myoc Y437H mice by polymerase chain reaction (PCR).
Tg-Myoc Y437H mice (+) displayed with PCR products of 249 bp (MyocY437H) and weak band at 610 bp (mouse DNA). The mice with only 610 bp band were transgenic negative mice (-). M: DNA markers.
Figure 1—figure supplement 2.
Figure 1—figure supplement 2.. Representative perfusion outflow data from each mouse group.
X-axis: perfusion pressure (mmHg), Y-axis: flow rate (μL/min), y is the slope indicating outflow facility (μL/min/mmHg).
Figure 2.
Figure 2.. TMSCs preserve the RGC function and prevent RGC loss in Tg-MyocY437H mice.
The function of RGCs in the mice was evaluated by pattern electroretinogram (PERG). (A) Representative examples of PERG from different groups at 2 months after transplantation. (B) Bar graphs of averaged P1 amplitude in PERG (n = 10 eyes/group). (C) RGC numbers counted on the retinal sections in each group (n = 12–16 sections/eyes, and 4–6 eyes/group). Data are presented as mean ± SD. One-way ANOVA followed by Tukey’s multiple comparisons test. WT: wild-type mice, Tg: Tg-MyocY437H mice, Tg-Sham: Tg mice with medium injection, Tg-TMSC: Tg mice with TMSC injection.
Figure 2—figure supplement 1.
Figure 2—figure supplement 1.. Transplanted TMSCs rescue RGCs and prevent neurodegeneration in Tg-MyocY437H mice.
Eye sections stained hematoxylin and eosin show the RGC layer in the eyes. The black INSET boxes in the left picture show the areas from which RGCs were captured so that the RGCs in the whole retina were counted in the central sections that containing optic nerve.
Figure 3.
Figure 3.. TMSCs increase the TM cellularity in the Tg-MyocY437H mice.
(A) Evaluation of the cellular density in the mouse TM region. Sections of the anterior segment were immunostained with collagen IV (red) and DAPI (blue). The TM region was determined by bright-field (BF) image together with collagen IV staining in the region between the two white vertical lines. Scale Bars, 50 µm. (B) The TM cellularity was averaged (n=12-14/group) and displayed as the number of cells in the TM region per section. Data are presented as mean ± SD. One-way ANOVA followed by Tukey’s multiple comparisons test. C: cornea, SC: Schlemm’s canal, TM: trabecular meshwork.
Figure 4.
Figure 4.. Transplanted TMSCs differentiate into TM cells and viable up to 2 months post-transplantation.
(A) AQP1/CHI3L1 immunofluorescent staining shows integration of transplanted TMSCs (DiO+, green) into the TM and differentiation of TMSCs into TM cells with expression of AQP1 (red) and CHI3L1 (magenta). (B) Ki67 staining shows part of the transplanted TMSCs (green) positive to Ki67 (red) in the TM while few of the TM cells in the Tg-Sham were Ki67+ too. (C) TUNEL staining shows some of the corneal cells and TM cells in the Tg mice were positive to TUNEL (apoptosis) while the transplanted TMSCs (green) in the Tg-TMSC were viable as the TMSC population was TUNEL negative. Scale bars, 50 μm. (D) Quantification of TUNEL + cells in the TM region of both Tg-MYocY437H mice without treatment (Tg) and with TMSC transplantation (Tg-TMSC). Data are presented as mean ± SD. Student t-test. TM: trabecular meshwork.
Figure 5.
Figure 5.. TMSCs reduce the Myoc retention in the TM tissue, promote the Myoc secretion into the aqueous humor, and reverse the ECM expression in the Tg-MyocY437H mice.
(A) Immunofluorescent staining shows accumulated Myoc in the TM, iris, and ciliary body of the Tg and Tg-sham mice. TMSC transplantation alleviated the aggregation of Myoc in the TM, similar to the WT mice. Scale bars, 50 mm. Western blotting results show: (B) The representative bands of Myoc expression in the mouse limbal tissue and the relative Myoc protein levels with b-actin as internal control (n=5). (C) The representative bands of Myoc expression in the mouse aqueous humor and the relative Myoc protein levels with b-actin as internal control (n=5). (D) The representative bands of the expression of ECM components fibronectin (FN), collagen IV, and elastin in the limbal tissue and the relative ECM protein levels with b-actin as internal control (n=4-6). Data are presented as mean ± SD. One-way ANOVA (B,C) or two-way ANOVA (D) followed by Tukey’s multiple comparisons test. C: cornea, SC: Schlemm’s canal, TM: trabecular meshwork.
Figure 6.
Figure 6.. The effect of TMSCs on ER stress and ultrastructure of the TM in the Tg-Myoc Y437H mice.
(A): Western blotting results show the representative bands of CHOP and GRP78 expression in the mouse limbal tissue and the relative protein levels with β-actin as internal control (n = 6). (B) TEM results indicates the ultrastructure of mouse TM tissue (40,000x) with black arrows pointing to the ER. Scale Bar = 500 nm. (C) ER size quantification calculated as area (nm2)/perimeter (nm) (n = 18–23). Data are presented as mean ± SD. Two-way ANOVA (A) or one-way ANOVA (C) followed by Tukey’s multiple comparisons test.
Figure 7.
Figure 7.. TMSCs could not reverse ER stress and stimulate proliferation of Myoc mutant TM cells in vitro.
(A) The TM cells were transduced with recombinant lentivirus encoding GFP and Myoc Y437H mutation. The transduced GFP+ cells were sorted by Flow cytometry and the cultured sorted TM cells were almost 100% with GFP (green) in the cytoplasm. Scale Bars, 100 µm. (B) Transduced TM cells with Myoc Y437H mutation expressed high Myoc by western blotting and TM cells had increased Myoc expression after 5-day Dex treatment (TM2, TM3). TM1 did not have increased Myoc expression after Dex treatment so TM1 cells were discarded. (C) Schematic illustration shows co-culturing of TMSCs with TM cells for detection of TM cell changes. (D) Flow cytometry analysis of EdU incorporation shows neither co-culture nor direct contact with TMSCs for 4 days would affect TM cell proliferation (n=3-5). (E) Representative western blotting bands show the levels of ER stress markers and Myoc in the TM cells with or without TMSC co-culturing. (F) Relative protein levels with b-actin as internal control (n=3). Data are presented as mean ± SD. One-way ANOVA (D) or two-way ANOVA (F) followed by Tukey’s multiple comparisons test.
Figure 7—figure supplement 1.
Figure 7—figure supplement 1.. Structure of lentiviral packaging plasmid: pLentiCMV-Y437H-IRES-GFP.
Figure 8.
Figure 8.. TMSCs differentiate into TM cells in vitro under ER stress environment.
(A) Schematic illustration shows co-culturing of TMSCs with TM cells for detection of TMSC changes. (B) The expression of TM cell marker CHI3L1 was upregulated in the TMSCs after 10 days of co-culturing with normal TM cells or MyocY437H mutant TM cells (n = 3). (C) After co-culturing for 10 days, the co-cultured TM cells in the Transwell insert were removed, and TMSCs were further treated with Dex for another 7 days. The levels of Myoc were detected by western blotting and quantified (n = 3). (D) After co-culturing of TMSCs with the TM cells or Myoc Y437H mutant TM cells in the Transwell insert for 10 days, the phagocytic ability of the TMSCs was evaluated by ingestion of bioparticles shown green in the cytoplasm. Scale Bars, 50 µm. (E) Percentage of phagocytic cells averaged from 10 different views. Data are presented as mean ± SD. One-way ANOVA followed by Tukey’s multiple comparisons test.
Figure 9.
Figure 9.. Transcriptome analysis of TM regeneration and neuroprotection genes among TMSC and fibroblasts.
(A) Heatmap shows gene expression profile of TMSCs as compared to fibroblasts for genes involved in maintenance of TM extracellular matrix (ECM), TM integrity and motility, (false discover rate (FDR) < 1%, p<0.01). Scale, bright red squares: highest gene expression levels, bright blue squares: lowest gene expression levels. (B) Interactome analysis shows activation of different neuroprotection pathways in TMSCs as obtained by RNA sequencing analysis. Interactome networks were generated using STRING v11.
Figure 10.
Figure 10.. Graphical abstract.

Similar articles

Cited by

References

    1. Abu-Hassan DW, Li X, Ryan EI, Acott TS, Kelley MJ. Induced pluripotent stem cells restore function in a human cell loss model of open-angle Glaucoma. Stem Cells. 2015;33:751–761. doi: 10.1002/stem.1885. - DOI - PMC - PubMed
    1. Acott TS, Kelley MJ. Extracellular matrix in the trabecular meshwork. Experimental Eye Research. 2008;86:543–561. doi: 10.1016/j.exer.2008.01.013. - DOI - PMC - PubMed
    1. Alvarado J, Murphy C, Polansky J, Juster R. Age-related changes in trabecular meshwork cellularity. Investigative Ophthalmology & Visual Science. 1981;21:714–727. - PubMed
    1. Alvarado J, Murphy C, Juster R. Trabecular meshwork cellularity in primary open-angle Glaucoma and nonglaucomatous normals. Ophthalmology. 1984;91:564–579. doi: 10.1016/S0161-6420(84)34248-8. - DOI - PubMed
    1. Basu S, Hertsenberg AJ, Funderburgh ML, Burrow MK, Mann MM, Du Y, Lathrop KL, Syed-Picard FN, Adams SM, Birk DE, Funderburgh JL. Human limbal biopsy-derived stromal stem cells prevent corneal scarring. Science Translational Medicine. 2014;6:266ra172. doi: 10.1126/scitranslmed.3009644. - DOI - PMC - PubMed

Publication types

Substances

LinkOut - more resources