. 2021 Mar 1;220(3):e202004211.
doi: 10.1083/jcb.202004211.

The deubiquitylase USP9X controls ribosomal stalling

Affiliations

The deubiquitylase USP9X controls ribosomal stalling

Anne Clancy et al. J Cell Biol. .

Erratum in

  • Correction: The deubiquitylase USP9X controls ribosomal stalling.
    Clancy A, Heride C, Pinto-Fernández A, Elcocks H, Kallinos A, Kayser-Bricker KJ, Wang W, Smith V, Davis S, Fessler S, McKinnon C, Katz M, Hammonds T, Jones NP, O'Connell J, Follows B, Mischke S, Caravella JA, Ioannidis S, Dinsmore C, Kim S, Behrens A, Komander D, Kessler BM, Urbé S, Clague MJ. Clancy A, et al. J Cell Biol. 2021 Mar 1;220(3):jcb.20200421102102021c. doi: 10.1083/jcb.20200421102102021c. J Cell Biol. 2021. PMID: 33600552 Free PMC article. No abstract available.

Abstract

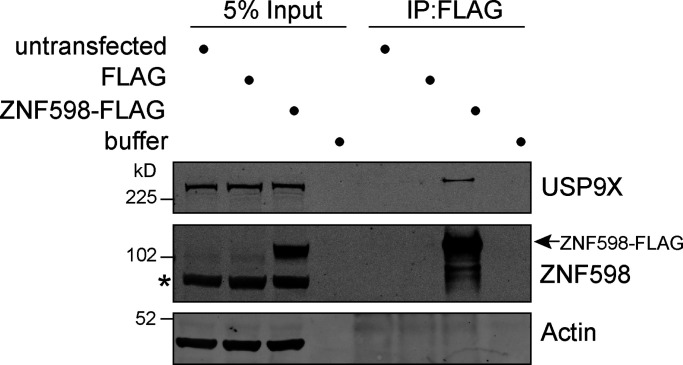
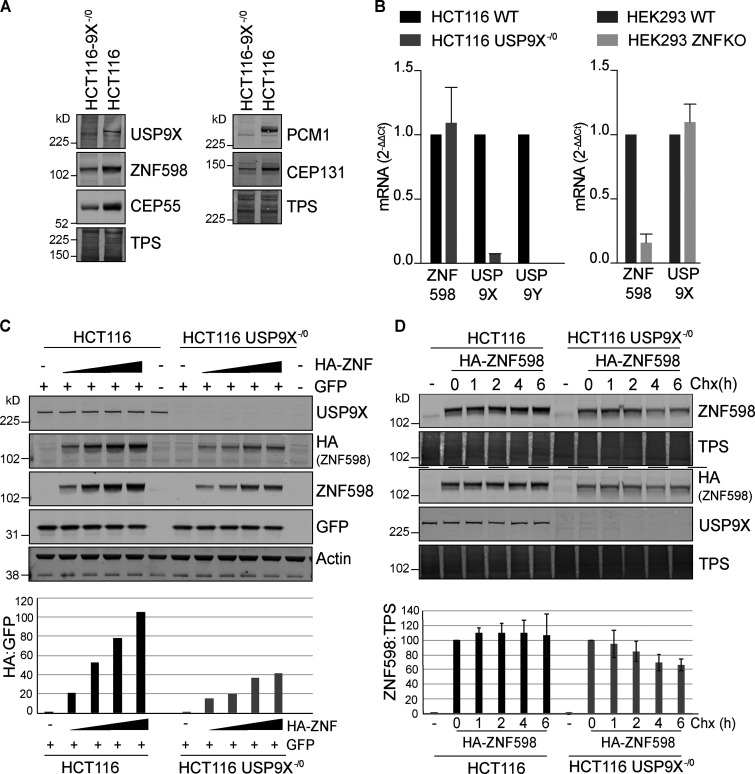
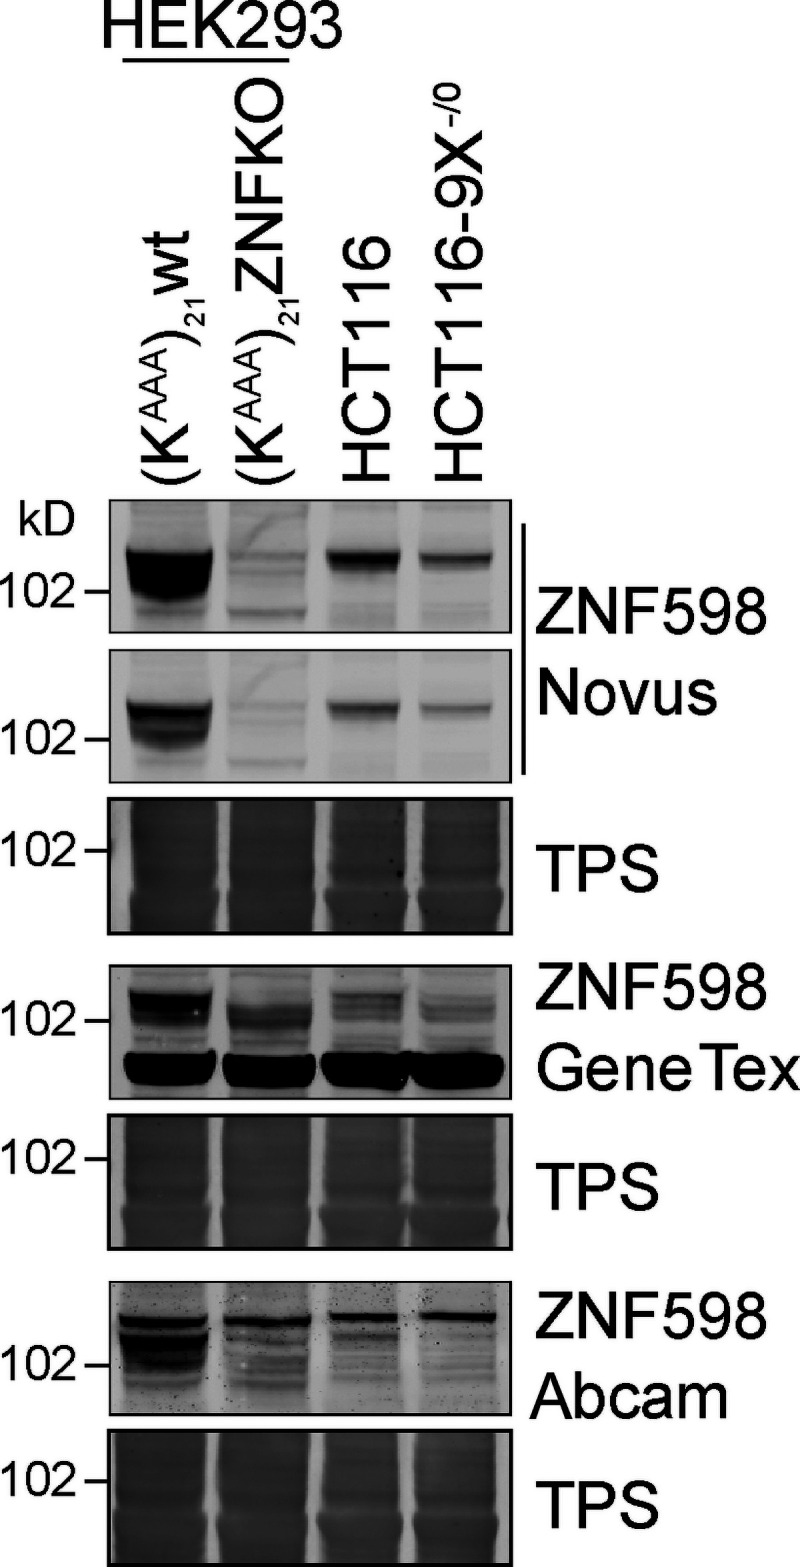
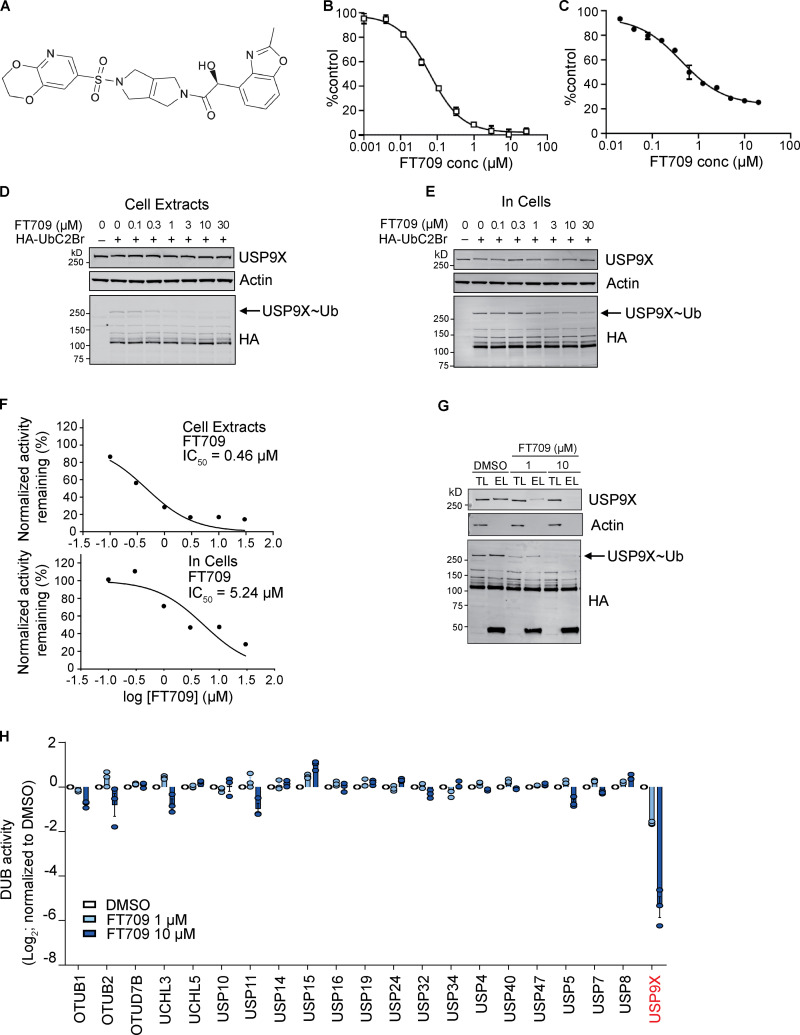
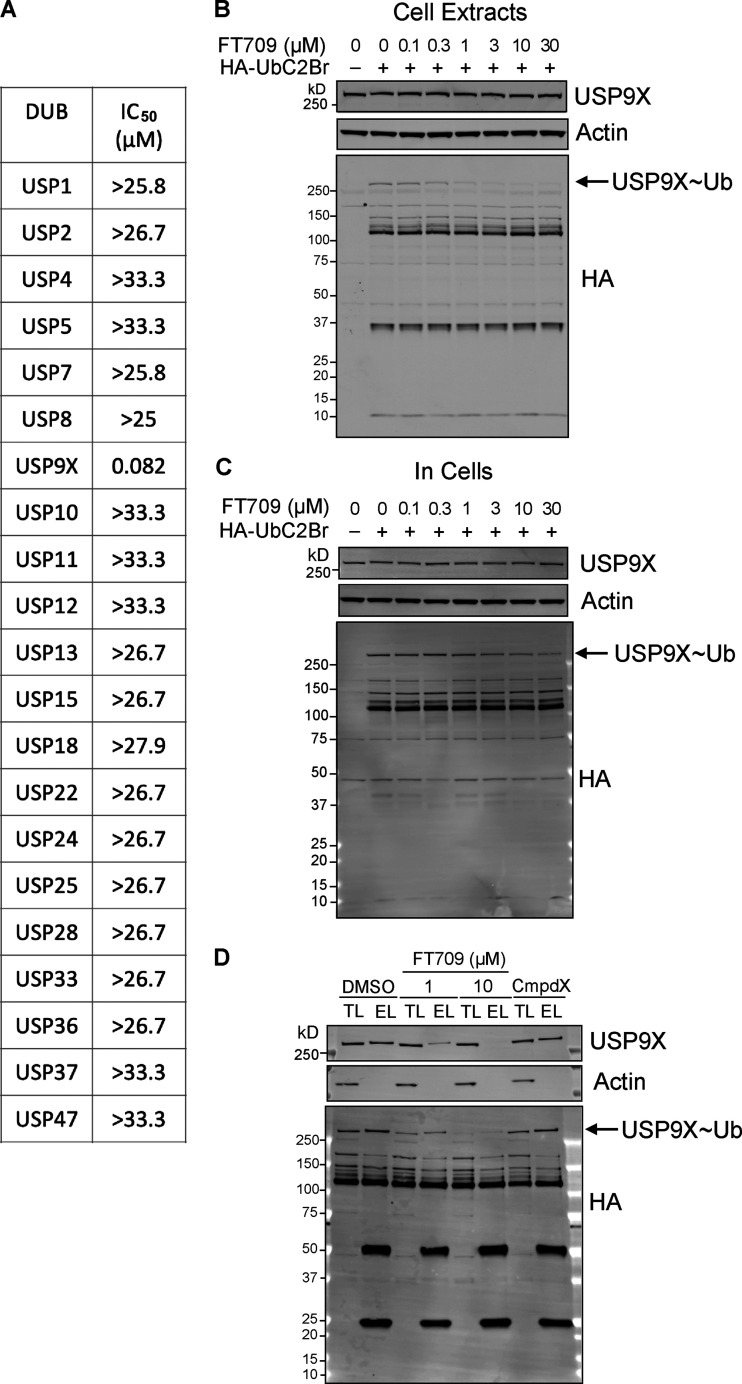
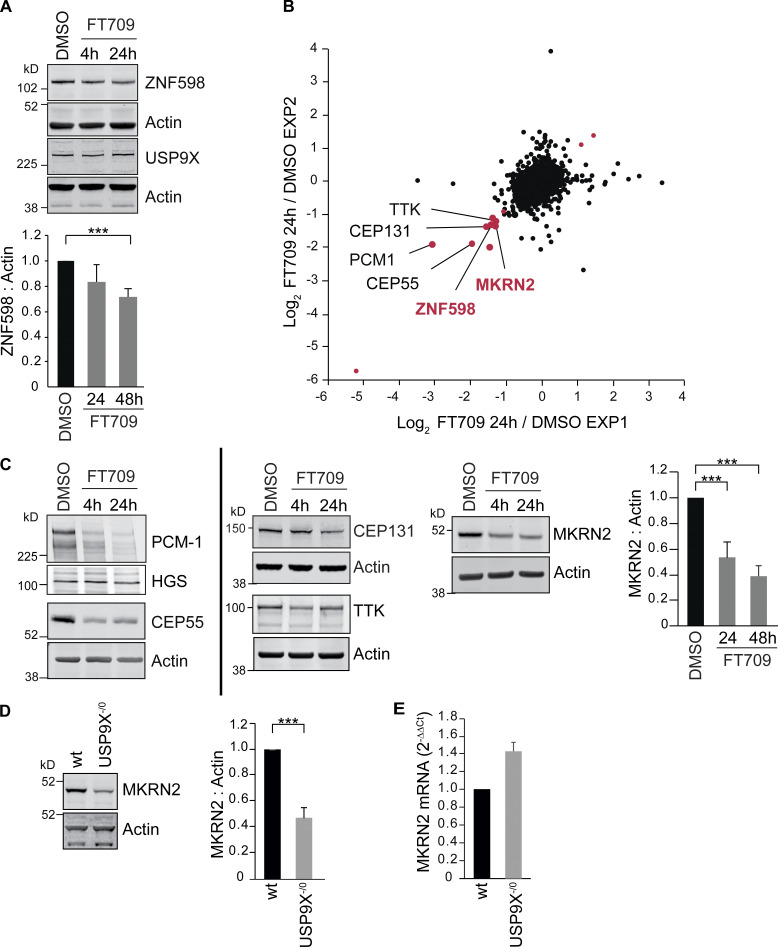
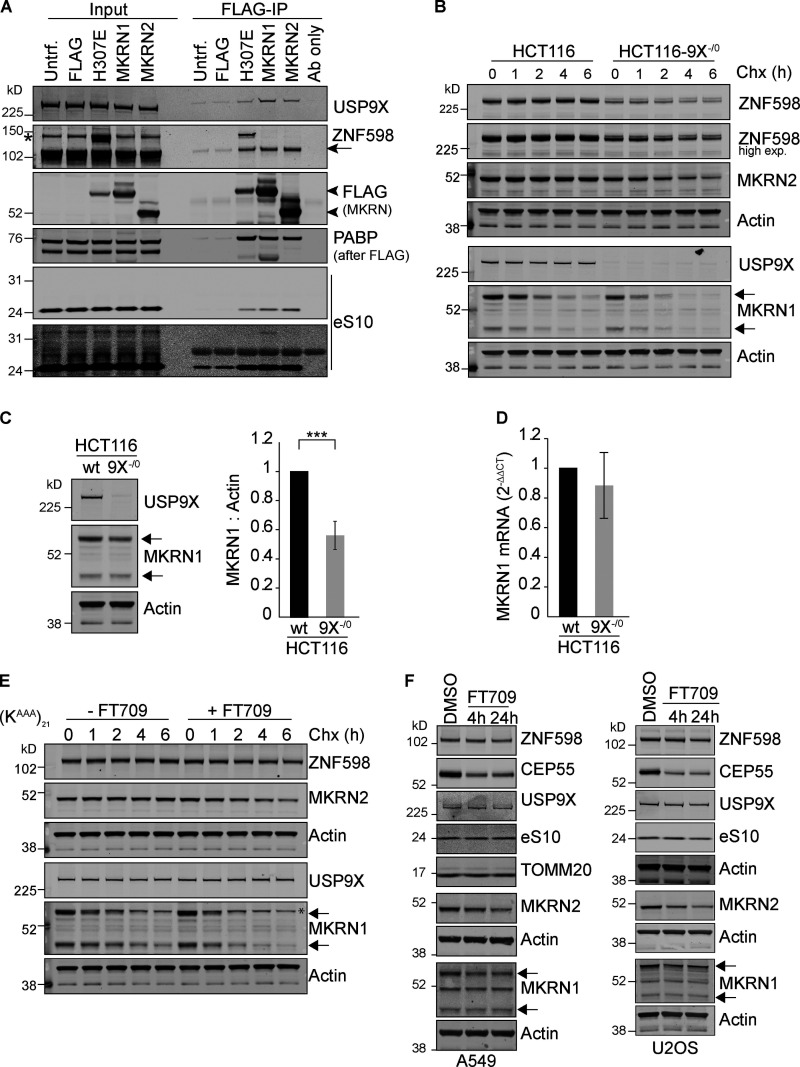
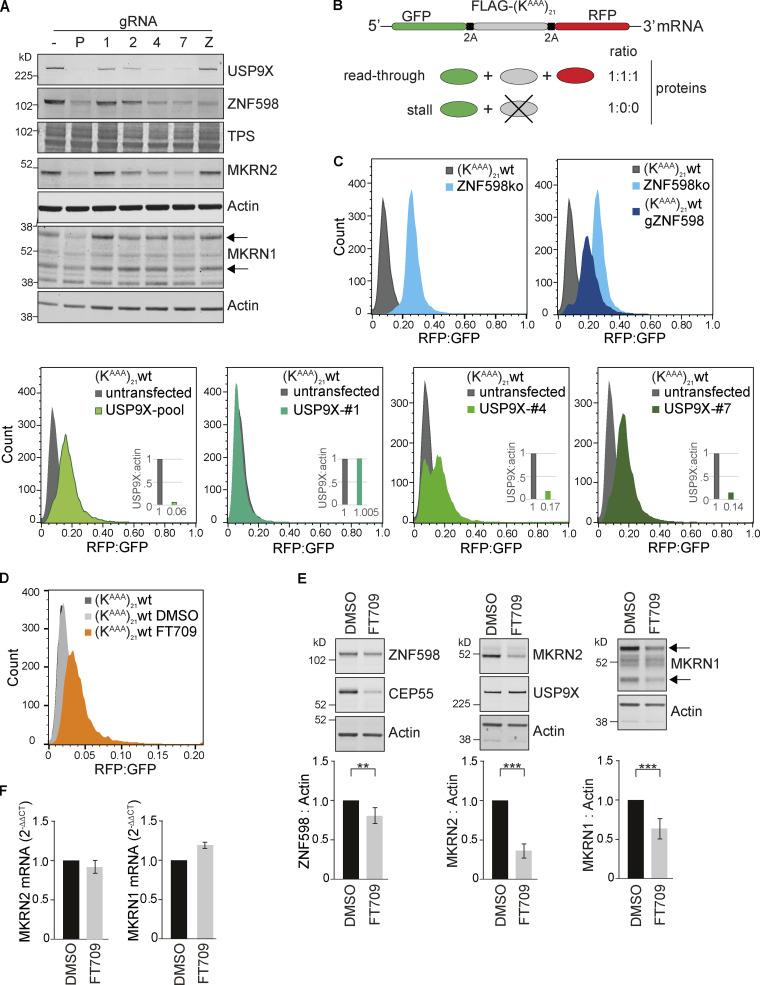
When a ribosome stalls during translation, it runs the risk of collision with a trailing ribosome. Such an encounter leads to the formation of a stable di-ribosome complex, which needs to be resolved by a dedicated machinery. The initial stalling and the subsequent resolution of di-ribosomal complexes requires activity of Makorin and ZNF598 ubiquitin E3 ligases, respectively, through ubiquitylation of the eS10 and uS10 subunits of the ribosome. We have developed a specific small-molecule inhibitor of the deubiquitylase USP9X. Proteomics analysis, following inhibitor treatment of HCT116 cells, confirms previous reports linking USP9X with centrosome-associated protein stability but also reveals a loss of Makorin 2 and ZNF598. We show that USP9X interacts with both these ubiquitin E3 ligases, regulating their abundance through the control of protein stability. In the absence of USP9X or following chemical inhibition of its catalytic activity, levels of Makorins and ZNF598 are diminished, and the ribosomal quality control pathway is impaired.


Figures

Figure 1.
Figure 1.
USP9X coimmunoprecipitates with FLAG-tagged ZNF598. HEK293T cells were transfected with ZNF598-FLAG or FLAG alone (pCMV-Tag2B), and cell lysates were subjected to immunoprecipitation (IP) with FLAG-antibody–coupled agarose beads. IPs were probed alongside 5% of the input as indicated, representative of two independent experiments. Arrow indicates ZNF598-FLAG; *, a nonspecific band.
Figure 2.
Figure 2.
ZNF598 is destabilized in USP9X KO cells. (A) HCT116 or HCT116 USP9X/0 lysates were analyzed by immunoblot with the indicated antibodies (representative of three independent experiments). (B) Quantitative RT-PCR reactions for ZNF598, USP9X, and USP9Y (normalized to Actin) were performed with cDNA derived from the indicated cell lines. The mean of three independent biological replicates is shown, and error bars indicate the standard deviation. (C) HCT116 or HCT116 USP9X/0 cells were transfected with 0, 0.2, 0.4, 0.8, or 1.6 µg HA-ZNF598 and 0.2 µg GFP as a transfection control, and lysates analyzed by immunoblot with the indicated antibodies. Graph shows HA-ZNF598 relative to cotransfected GFP. Panel is representative of three experiments. (D) HCT116 or HCT116 USP9X/0 cells were transfected with 0.2 µg HA-ZNF598 and treated for the indicated times with 100 µg/ml cycloheximide (Chx). Lysates (8 µg for HCT116 and 20 µg HCT116-USP9X/0) were probed with the indicated antibodies. Graph represents the results from four independent experiments. Error bars represent the standard deviation. TPS, total protein stain.
Figure S1.
Figure S1.
ZNF598 antibody validation. HEK293 Flp-In T-Rex GFP-P2A-(KAAA)21-P2A-RFP WT or ZNF598 KO, and HCT116 WT or HCT116 USP9X/0 cell lysates were analyzed by immunoblotting with the indicated antibodies. TPS, total protein stain.
Figure 3.
Figure 3.
Characterization of a highly selective USP9X inhibitor. (A) Chemical structure of FT709. (B) In vitro potency of FT709 against USP9X. Activity is monitored by a fluorescence increase following cleavage of a Ub-rhodamine substrate. (C) BxPC3 cell-based potency of FT709 for reduction of CEP55 measured using a MSD ELISA assay. Graphs in B and C show the average of two experiments with error bars indicating the range. (D–F) Cell lysates (D) or intact MCF7 cells (E) were incubated with FT709 (30 min at 25°C for cell extracts, 3 h at 37°C for cells) at the indicated concentrations. Cells were lysed, and extracts were incubated with 0.1 µg HA-UbC2Br probe for 5 min at 37°C, followed by SDS-PAGE analysis. Samples were immunoblotted with USP9X and HA antibodies as indicated. Arrow indicates HA-probe labeled band corresponding to the USP9X~Ub probe adduct. Modification of USP9X with a ubiquitin probe (USP9X~Ub) was lost with increasing concentrations of inhibitor. (F) Quantitation of Western blots shown in D and E. (G and H) HA-based immunoprecipitation of HA-UbC2Br probe–labeled DUBs from cell lysates incubated first with DMSO, 1 or 10 µM FT709, for 1 h at 37°C. Immunoprecipitated proteins were eluted and either analyzed side by side with total lysate samples by immunoblotting (TL, total lysate; EL, eluate) or subjected to mass spectrometry–based quantification in three technical replicates. Differences in DUB-probe binding were quantified for 21 identified DUBs and normalized relative to DMSO control (error bars represent standard deviation of three technical replicates). See Fig. S2 for uncropped immunoblots. conc, concentration.
Figure S2.
Figure S2.
Characterisation of FT709. (A)IC50 values for FT709 inhibition across a panel of DUBs using an Ub-rhodamine as substrate. (B–D) Full Western blots of Fig. 3, D, E, and G. EL, eluate; TL, total lysate.
Figure 4.
Figure 4.
Inhibition of USP9X catalytic activity depletes ZNF598 and MKRN2 protein levels. (A) HCT116 cells were treated for 4 or 24 h with a selective USP9X inhibitor (FT709, 10 µM). Cells were lysed in RIPA buffer and samples analyzed by SDS-PAGE and immunoblotted for ZNF598 and USP9X. Graph represents quantification of four independent experiments. (B) Correlation of two distinct experimental SILAC-based proteomic datasets showing the de-enrichment of ZNF598 and MKRN2 alongside known USP9X substrates (in black type) in HCT116 cells treated for 24 h with USP9X inhibitor (FT709, 10 µM). Outliers for which the ratio is either lower than Log2(−1.0) or larger than Log2(+1.0) in both datasets are shown in red. (C) Western blot validation of USP9X inhibitor–sensitive proteins identified in B. HCT116 cells were treated with FT709 at 5 µM (CEP131), or 10 µM (all other samples) and analyzed as in A. Graph is representative of three independent experiments. (D) De-enrichment of MKRN2 in USP9X−/0 cells. HCT116 or HCT116 USP9X/0 lysates were analyzed by immunoblot with the indicated antibodies. Quantification is based on four experiments. (E) Quantitative RT-PCR reactions for MKRN2 (normalized to actin) were performed with cDNA derived from the indicated HCT116 cell lines. n = 3 independent experiments. Error bars in all panels represent standard deviation; two-tailed Student’s t test; ***, P < 0.001.
Figure S3.
Figure S3.
Makorins interact with and are stabilised by USP9X. (A) HEK293T cells were transfected with FLAG-MKRN1, FLAG-MKRN1-H307E, MKRN2-FLAG, or FLAG alone (pCMV-Tag2B) and cell lysates were subjected to immunoprecipitation (IP) with FLAG-antibody coupled agarose beads. IPs were probed alongside 2% of the input as indicated. Flag-MKRN1 H307E bears an inactivating mutation. PABP, polyA binding protein; eS10, 40S ribosomal subunit. Results are representative of three independent experiments. Arrow indicates ZNF598; arrowheads indicate FLAG-Makorins (MKRN). (B) HCT116 or HCT116 USP9X/0 cells were treated for the indicated times with 100 µg/ml cycloheximide (Chx). (C) Steady-state levels of MKRN1 in HCT116 compared with HCT116 USP9X/0 cells. Error bars indicate the standard deviation of four independent experiments, where the higher molecular weight isoform of MKRN1 has been quantified. (D) Quantitative RT-PCR reactions for MKRN1 (normalized to actin) were performed with cDNA derived from the indicated cell lines. The mean of three independent biological replicates is shown, and error bars indicate the standard deviation. (E) (KAAA)21 WT cells were treated for the indicated times with 100 µg/ml cycloheximide with or without FT709. (F) FT709 (10 µM) responsive markers in other cell types: A549 lung adenocarcinoma cells and U2OS osteosarcoma cells. TOMM20 here serves an alternative loading control for the upper set of panels. (B, E, and F) Arrows indicate two isoforms of MKRN1. *, a nonspecific band. Two-tailed Student’s t test; ***, P < 0.001. Untrf., untransfected.
Figure 5.
Figure 5.
USP9X ablation or inhibition impairs the ribosomal stalling response. (A) HEK293 Flp-In T-Rex GFP-P2A-(KAAA)21-P2A-RFP WT cells were transfected with a plasmid containing Cas9 and gRNAs targeting USP9X or ZNF598. P, pool of USP9X guides; 1/2/4/7, individual USP9X guides; Z, ZNF598 guide. Lysates were analyzed 168 h after transfection and selection in puromycin by immunoblotting with the indicated antibodies. Panel is representative of two independent experiments. (B) Schematic of the fluorescent ribosomal stalling reporter expressed in this cell line. If stalling is not efficiently resolved, read-through occurs, and the FLAG-SR and RFP are expressed. (C) FACS analysis of the RFP:GFP ratio in (KAAA)21 WT or ZNF598 KO cells following transfection with px459-pSpCas9(BB)-2A-Puro_v2–containing gRNA as indicated. Cells were gated for live singlets, then for GFP-positive cells. Graphs depict data from >7,000 cells. Insets indicate the USP9X protein levels normalized to WT untransfected cells. (D) FACS analysis of the RFP:GFP ratio in WT cells following inhibition of USP9X with 10 µM FT709 for 72 h. Graph depicts data from >8,000 cells and is representative of three independent experiments. (E) (KAAA)21 WT cells were treated with indicated concentrations of FT709 for 48 h and analyzed by immunoblotting with selected antibodies (representative of three independent experiments). (F) quantitation of Makorin mRNA levels for cells treated as in E. Error bars in E and F indicate the standard deviation (n = 3 independent experiments); two-tailed Student’s t test; **, P < 0.01; ***, P < 0.001. Arrows in A and E indicate two isoforms of MKRN1, and the upper one is quantified. TPS, total protein stain.

References

    1. Altun, M., Kramer H.B., Willems L.I., McDermott J.L., Leach C.A., Goldenberg S.J., Kumar K.G., Konietzny R., Fischer R., Kogan E., et al. . 2011. Activity-based chemical proteomics accelerates inhibitor development for deubiquitylating enzymes. Chem. Biol. 18:1401–1412. 10.1016/j.chembiol.2011.08.018 - DOI - PubMed
    1. Arthur, L.L., and Djuranovic S.. 2018. PolyA tracks, polybasic peptides, poly-translational hurdles. Wiley Interdiscip. Rev. RNA. 9:e1486. 10.1002/wrna.1486 - DOI - PMC - PubMed
    1. Arthur, L., Pavlovic-Djuranovic S., Smith-Koutmou K., Green R., Szczesny P., and Djuranovic S.. 2015. Translational control by lysine-encoding A-rich sequences. Sci. Adv. 1:e1500154. 10.1126/sciadv.1500154 - DOI - PMC - PubMed
    1. Behan, F.M., Iorio F., Picco G., Gonçalves E., Beaver C.M., Migliardi G., Santos R., Rao Y., Sassi F., Pinnelli M., et al. . 2019. Prioritization of cancer therapeutic targets using CRISPR-Cas9 screens. Nature. 568:511–516. 10.1038/s41586-019-1103-9 - DOI - PubMed
    1. Borodovsky, A., Ovaa H., Kolli N., Gan-Erdene T., Wilkinson K.D., Ploegh H.L., and Kessler B.M.. 2002. Chemistry-based functional proteomics reveals novel members of the deubiquitinating enzyme family. Chem. Biol. 9:1149–1159. 10.1016/S1074-5521(02)00248-X - DOI - PubMed

Publication types