

Comparison of samplers collecting airborne influenza viruses: 1. Primarily impingers and cyclones
- PMID: 33507951
- PMCID: PMC7842955
- DOI: 10.1371/journal.pone.0244977
Comparison of samplers collecting airborne influenza viruses: 1. Primarily impingers and cyclones
Abstract
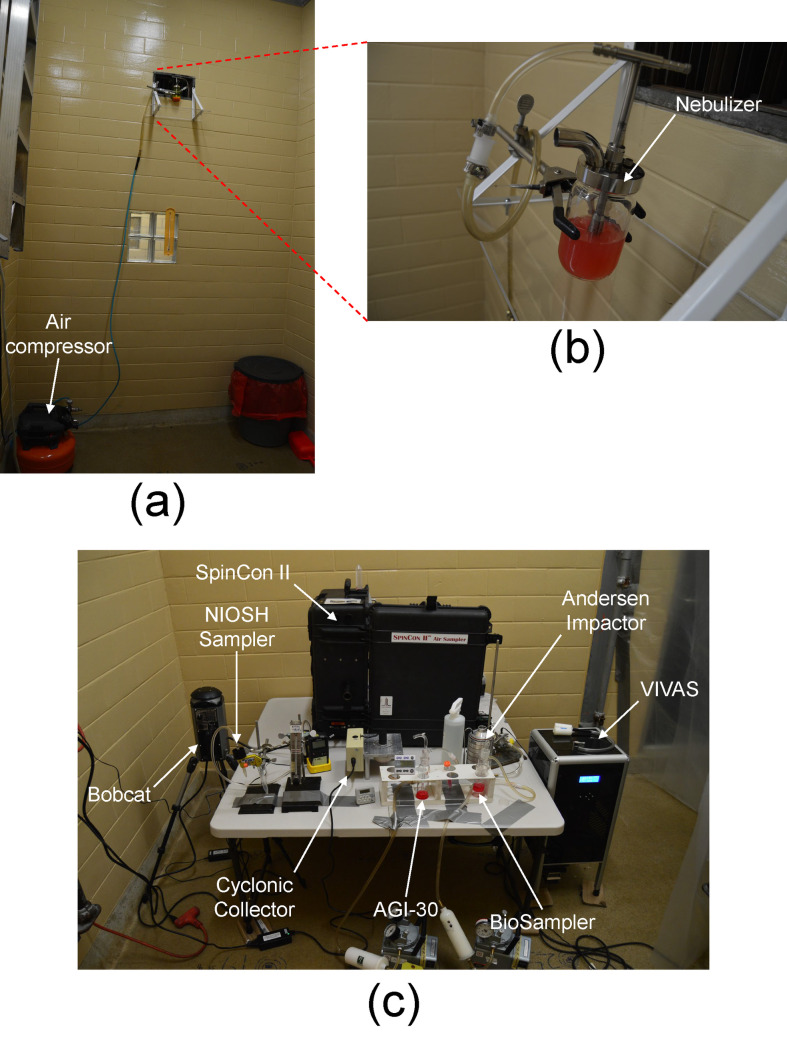
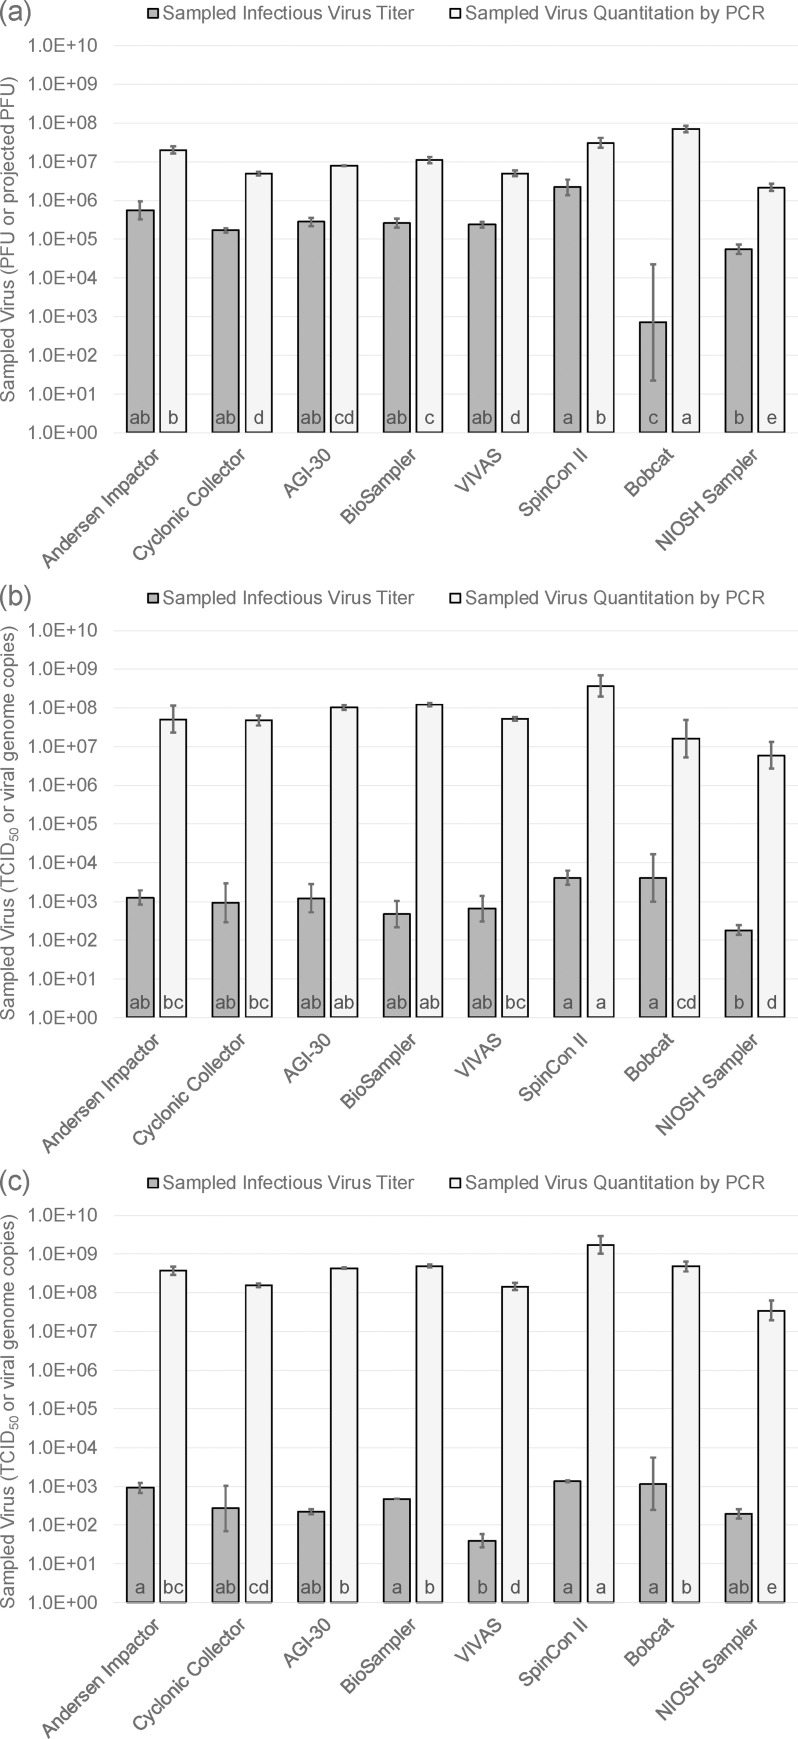
Researchers must be able to measure concentrations, sizes, and infectivity of virus-containing particles in animal agriculture facilities to know how far infectious virus-containing particles may travel through air, where they may deposit in the human or animal respiratory tract, and the most effective ways to limit exposures to them. The objective of this study was to evaluate a variety of impinger and cyclone aerosol or bioaerosol samplers to determine approaches most suitable for detecting and measuring concentrations of virus-containing particles in air. Six impinger/cyclone air samplers, a filter-based sampler, and a cascade impactor were used in separate tests to collect artificially generated aerosols of MS2 bacteriophage and swine and avian influenza viruses. Quantification of infectious MS2 coliphage was carried out using a double agar layer procedure. The influenza viruses were titrated in cell cultures to determine quantities of infectious virus. Viral RNA was extracted and used for quantitative real time RT-PCR, to provide total virus concentrations for all three viruses. The amounts of virus recovered and the measured airborne virus concentrations were calculated and compared among the samplers. Not surprisingly, high flow rate samplers generally collected greater quantities of virus than low flow samplers. However, low flow rate samplers generally measured higher, and likely more accurate, airborne concentrations of Infectious virus and viral RNA than high flow samplers. To assess airborne viruses in the field, a two-sampler approach may work well. A suitable high flow sampler may provide low limits of detection to determine if any virus is present in the air. If virus is detected, a suitable lower flow sampler may measure airborne virus concentrations accurately.
Conflict of interest statement
The authors have declared that no competing interests exist.
Figures
Similar articles
-
Airborne influenza virus detection with four aerosol samplers using molecular and infectivity assays: considerations for a new infectious virus aerosol sampler.Indoor Air. 2009 Oct;19(5):433-41. doi: 10.1111/j.1600-0668.2009.00609.x. Epub 2009 May 26. Indoor Air. 2009. PMID: 19689447 Free PMC article.
-
Evaluation of bioaerosol samplers for the detection and quantification of influenza virus from artificial aerosols and influenza virus-infected ferrets.Influenza Other Respir Viruses. 2019 Nov;13(6):564-573. doi: 10.1111/irv.12678. Epub 2019 Sep 21. Influenza Other Respir Viruses. 2019. PMID: 31541519 Free PMC article.
-
PathoSift Pro: A novel size-based bioaerosol sampler for effectively detecting infectious airborne influenza virus.Virology. 2025 Sep;610:110609. doi: 10.1016/j.virol.2025.110609. Epub 2025 Jun 18. Virology. 2025. PMID: 40561866
-
Methods for sampling of airborne viruses.Microbiol Mol Biol Rev. 2008 Sep;72(3):413-44. doi: 10.1128/MMBR.00002-08. Microbiol Mol Biol Rev. 2008. PMID: 18772283 Free PMC article. Review.
-
New experimental methods for the development and evaluation of aerosol samplers.J Environ Monit. 2002 Oct;4(5):633-41. doi: 10.1039/b202274p. J Environ Monit. 2002. PMID: 12400907 Review.
Cited by
-
From air to insight: the evolution of airborne DNA sequencing technologies.Microbiology (Reading). 2025 May;171(5):001564. doi: 10.1099/mic.0.001564. Microbiology (Reading). 2025. PMID: 40434822 Free PMC article. Review.
-
Hybrid barn: the switch from a naturally to a mechanically ventilated turkey barn to protect from harmful bioaerosols.Front Vet Sci. 2025 Feb 19;12:1443139. doi: 10.3389/fvets.2025.1443139. eCollection 2025. Front Vet Sci. 2025. PMID: 40046422 Free PMC article.
-
The Role of Airborne Particles in the Epidemiology of Clade 2.3.4.4b H5N1 High Pathogenicity Avian Influenza Virus in Commercial Poultry Production Units.Viruses. 2023 Apr 19;15(4):1002. doi: 10.3390/v15041002. Viruses. 2023. PMID: 37112981 Free PMC article.
-
Sampling efficiency and nucleic acid stability during long-term sampling with different bioaerosol samplers.Environ Monit Assess. 2024 May 25;196(6):577. doi: 10.1007/s10661-024-12735-7. Environ Monit Assess. 2024. PMID: 38795190 Free PMC article.
-
Influenza viruses and coronaviruses: Knowns, unknowns, and common research challenges.PLoS Pathog. 2021 Dec 30;17(12):e1010106. doi: 10.1371/journal.ppat.1010106. eCollection 2021 Dec. PLoS Pathog. 2021. PMID: 34969061 Free PMC article. Review.
References
-
- Sattar SA, Ijaz MK, Gerba CP. Spread of viral infections by aerosols. Critical Reviews in Environmental Control. 1987;17(2):89–131. 10.1080/10643388709388331 - DOI
Publication types
MeSH terms
Substances
Grants and funding
LinkOut - more resources
Full Text Sources
Other Literature Sources
