

The high volume of patients admitted during the SARS-CoV-2 pandemic has an independent harmful impact on in-hospital mortality from COVID-19
- PMID: 33507954
- PMCID: PMC7842950
- DOI: 10.1371/journal.pone.0246170
The high volume of patients admitted during the SARS-CoV-2 pandemic has an independent harmful impact on in-hospital mortality from COVID-19
Abstract
Background: During the Coronavirus disease 2019 (COVID-19) pandemic, advanced health systems have come under pressure by the unprecedented high volume of patients needing urgent care. The impact on mortality of this "patients' burden" has not been determined.
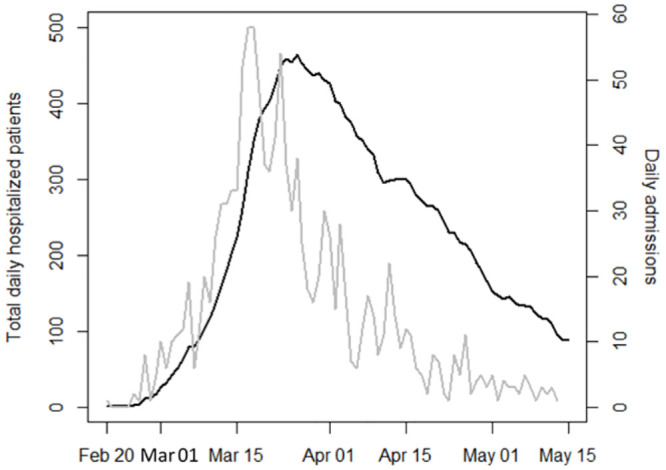
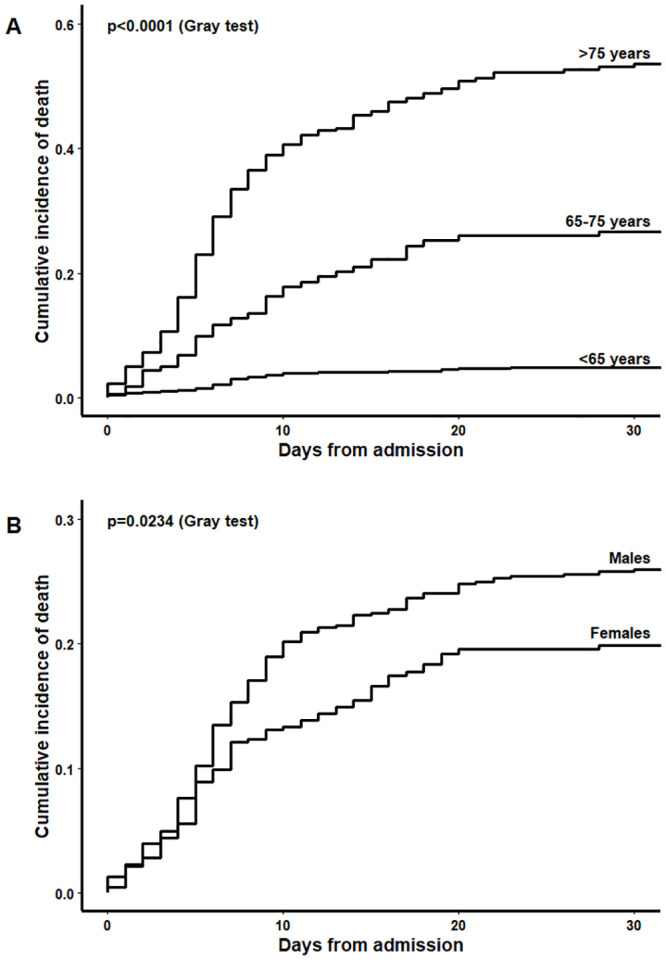
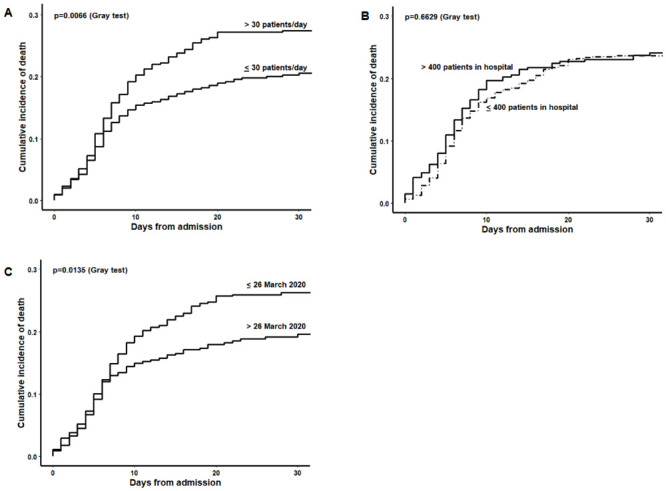
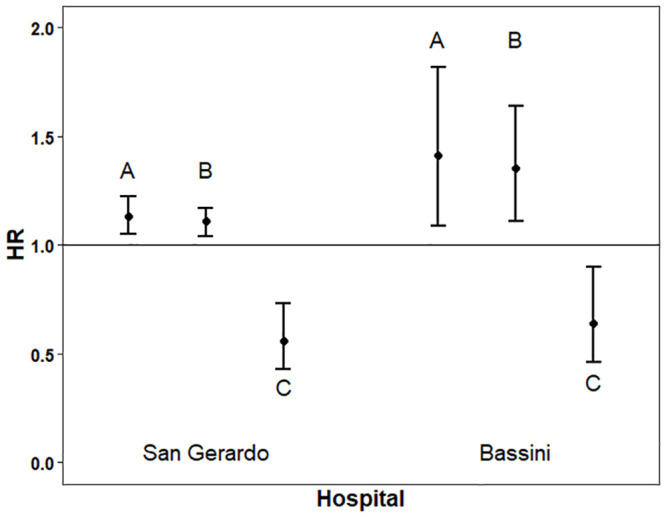
Methods and findings: Through retrieval of administrative data from a large referral hospital of Northern Italy, we determined Aalen-Johansen cumulative incidence curves to describe the in-hospital mortality, stratified by fixed covariates. Age- and sex-adjusted Cox models were used to quantify the effect on mortality of variables deemed to reflect the stress on the hospital system, namely the time-dependent number of daily admissions and of total hospitalized patients, and the calendar period. Of the 1225 subjects hospitalized for COVID-19 between February 20 and May 13, 283 died (30-day mortality rate 24%) after a median follow-up of 14 days (interquartile range 5-19). Hospitalizations increased progressively until a peak of 465 subjects on March 26, then declined. The risk of death, adjusted for age and sex, increased for a higher number of daily admissions (adjusted hazard ratio [AHR] per an incremental daily admission of 10 patients: 1.13, 95% Confidence Intervals [CI] 1.05-1.22, p = 0.0014), and for a higher total number of hospitalized patients (AHR per an increase of 50 patients in the total number of hospitalized subjects: 1.11, 95%CI 1.04-1.17, p = 0.0004), while was lower for the calendar period after the peak (AHR 0.56, 95%CI 0.43-0.72, p<0.0001). A validation was conducted on a dataset from another hospital where 500 subjects were hospitalized for COVID-19 in the same period. Figures were consistent in terms of impact of daily admissions, daily census, and calendar period on in-hospital mortality.
Conclusions: The pressure of a high volume of severely ill patients suffering from COVID-19 has a measurable independent impact on in-hospital mortality.
Conflict of interest statement
The authors have declared that no competing interests exist.
Figures
Similar articles
-
[Impact of the COVID-19 epidemic in Friuli Venezia Giulia Region (Northern Italy): assessment of factors associated with the risk of death by competing risks analysis].Epidemiol Prev. 2020 Sep-Dec;44(5-6 Suppl 2):128-135. doi: 10.19191/EP20.5-6.S2.111. Epidemiol Prev. 2020. PMID: 33412803 Italian.
-
Comparison of hospitalized patients with COVID-19 who did and did not live in residential care facilities in Montréal: a retrospective case series.CMAJ Open. 2021 Jul 13;9(3):E718-E727. doi: 10.9778/cmajo.20200244. Print 2021 Jul-Sep. CMAJ Open. 2021. PMID: 34257090 Free PMC article.
-
Association of SARS-CoV-2 viral load at admission with in-hospital acute kidney injury: A retrospective cohort study.PLoS One. 2021 Feb 24;16(2):e0247366. doi: 10.1371/journal.pone.0247366. eCollection 2021. PLoS One. 2021. PMID: 33626098 Free PMC article.
-
Mortality in hospitalized patients with cancer and coronavirus disease 2019: A systematic review and meta-analysis of cohort studies.Cancer. 2021 May 1;127(9):1459-1468. doi: 10.1002/cncr.33386. Epub 2020 Dec 30. Cancer. 2021. PMID: 33378122
-
Clinical outcomes for patients with cardiovascular diseases before, during, and after the COVID19 pandemic. A pooled analysis of 600.000 patients.Curr Probl Cardiol. 2024 Jun;49(6):102540. doi: 10.1016/j.cpcardiol.2024.102540. Epub 2024 Mar 21. Curr Probl Cardiol. 2024. PMID: 38521287 Review.
Cited by
-
Application of machine learning approach in emergency department to support clinical decision making for SARS-CoV-2 infected patients.J Integr Bioinform. 2023 Mar 7;20(2):20220047. doi: 10.1515/jib-2022-0047. eCollection 2023 Jun 1. J Integr Bioinform. 2023. PMID: 36877860 Free PMC article.
-
On the friendship paradox and inversity: A network property with applications to privacy-sensitive network interventions.Proc Natl Acad Sci U S A. 2024 Jul 23;121(30):e2306412121. doi: 10.1073/pnas.2306412121. Epub 2024 Jul 19. Proc Natl Acad Sci U S A. 2024. PMID: 39028691 Free PMC article.
-
Right Information, Right Care, Right Patient, Right Time: Community Preferences to Inform a Self-Management Support Tool for Upper Respiratory Symptoms.Appl Clin Inform. 2025 Jan;16(1):145-155. doi: 10.1055/a-2441-6016. Epub 2024 Oct 29. Appl Clin Inform. 2025. PMID: 39472036
-
Bloodstream infections in the COVID-19 era: results from an Italian multi-centre study.Int J Infect Dis. 2021 Oct;111:31-36. doi: 10.1016/j.ijid.2021.07.065. Epub 2021 Aug 18. Int J Infect Dis. 2021. PMID: 34416402 Free PMC article.
-
Measures and Impact of Caseload Surge During the COVID-19 Pandemic: A Systematic Review.Crit Care Med. 2024 Jul 1;52(7):1097-1112. doi: 10.1097/CCM.0000000000006263. Epub 2024 Mar 22. Crit Care Med. 2024. PMID: 38517234 Free PMC article.
References
MeSH terms
LinkOut - more resources
Full Text Sources
Other Literature Sources
Medical
Miscellaneous
