FOSTER-An R package for forest structure extrapolation
- PMID: 33507959
- PMCID: PMC7842971
- DOI: 10.1371/journal.pone.0244846
FOSTER-An R package for forest structure extrapolation
Abstract
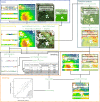
The uptake of technologies such as airborne laser scanning (ALS) and more recently digital aerial photogrammetry (DAP) enable the characterization of 3-dimensional (3D) forest structure. These forest structural attributes are widely applied in the development of modern enhanced forest inventories. As an alternative to extensive ALS or DAP based forest inventories, regional forest attribute maps can be built from relationships between ALS or DAP and wall-to-wall satellite data products. To date, a number of different approaches exist, with varying code implementations using different programming environments and tailored to specific needs. With the motivation for open, simple and modern software, we present FOSTER (Forest Structure Extrapolation in R), a versatile and computationally efficient framework for modeling and imputation of 3D forest attributes. FOSTER derives spectral trends in remote sensing time series, implements a structurally guided sampling approach to sample these often spatially auto correlated datasets, to then allow a modelling approach (currently k-NN imputation) to extrapolate these 3D forest structure measures. The k-NN imputation approach that FOSTER implements has a number of benefits over conventional regression based approaches including lower bias and reduced over fitting. This paper provides an overview of the general framework followed by a demonstration of the performance and outputs of FOSTER. Two ALS-derived variables, the 95th percentile of first returns height (elev_p95) and canopy cover above mean height (cover), were imputed over a research forest in British Columbia, Canada with relative RMSE of 18.5% and 11.4% and relative bias of -0.6% and 1.4% respectively. The processing sequence developed within FOSTER represents an innovative and versatile framework that should be useful to researchers and managers alike looking to make forest management decisions over entire forest estates.
Conflict of interest statement
The authors have declared that no competing interests exist.
Figures


References
-
- Wulder MA, Bater CW, Coops NC, Hilker T, White JC. The role of LiDAR in sustainable forest management. For Chron [Internet]. 2008. [cited 2018 Aug 29];84(6):807–26. Available from: http://pubs.cif-ifc.org/doi/10.5558/tfc84807-6. - DOI
-
- Beaudoin A, Bernier PY, Guindon L, Villemaire P, Guo XJ, Stinson G, et al. Mapping attributes of Canada’s forests at moderate resolution through k NN and MODIS imagery. Can J For Res [Internet]. 2014. [cited 2019 Jan 2];44(5):521–32. Available from: http://www.nrcresearchpress.com/doi/abs/10.1139/cjfr-2013-0401. - DOI
-
- Lim K, Treitz P, Wulder MA, St-Ongé B, Flood M. LiDAR remote sensing of forest structure. Prog Phys Geogr. 2003;27(1):88–106.
-
- Goodbody TRH, Coops NC, White JC. Digital Aerial Photogrammetry for Updating Area-Based Forest Inventories: A Review of Opportunities, Challenges, and Future Directions. Current Forestry Reports. Springer International Publishing; 2019.
-
- Penner M, Pitt DG, Woods M. Parametric vs. nonparametric LiDAR models for operational forest inventory in boreal Ontario. Can J Remote Sens. 2013;39(5):426–43.
Publication types
MeSH terms
LinkOut - more resources
Full Text Sources
Other Literature Sources
Research Materials
Miscellaneous

