. 2021 Jan 28;17(1):e1009065.
doi: 10.1371/journal.ppat.1009065. eCollection 2021 Jan.

Bartonella type IV secretion effector BepC induces stress fiber formation through activation of GEF-H1

Affiliations

Bartonella type IV secretion effector BepC induces stress fiber formation through activation of GEF-H1

Chunyan Wang et al. PLoS Pathog. .

Abstract

Bartonella T4SS effector BepC was reported to mediate internalization of big Bartonella aggregates into host cells by modulating F-actin polymerization. After that, BepC was indicated to induce host cell fragmentation, an interesting cell phenotype that is characterized by failure of rear-end retraction during cell migration, and subsequent dragging and fragmentation of cells. Here, we found that expression of BepC resulted in significant stress fiber formation and contractile cell morphology, which depended on combination of the N-terminus FIC (filamentation induced by c-AMP) domain and C-terminus BID (Bartonella intracellular delivery) domain of BepC. The FIC domain played a key role in BepC-induced stress fiber formation and cell fragmentation because deletion of FIC signature motif or mutation of two conserved amino acid residues abolished BepC-induced cell fragmentation. Immunoprecipitation confirmed the interaction of BepC with GEF-H1 (a microtubule-associated RhoA guanosine exchange factor), and siRNA-mediated depletion of GEF-H1 prevented BepC-induced stress fiber formation. Interaction with BepC caused the dissociation of GEF-H1 from microtubules and activation of RhoA to induce formation of stress fibers. The ROCK (Rho-associated protein kinase) inhibitor Y27632 completely blocked BepC effects on stress fiber formation and cell contractility. Moreover, stress fiber formation by BepC increased the stability of focal adhesions, which consequently impeded rear-edge detachment. Overall, our study revealed that BepC-induced stress fiber formation was achieved through the GEF-H1/RhoA/ROCK pathway.


Conflict of interest statement

The authors have declared that no competing interests exist.

Figures
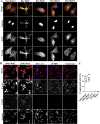
Fig 1
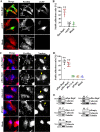
Fig 1. Bqu-BepC causes stress fiber formation and cell fragmentation.
(A) Ectopic expression of all Bqu T4SS effectors tagged with eGFP, BepA2, BepC, BepE, BepF1 and BepF2, was investigated in transfected Hela cells. Stress fibers were stained with TRITC-phalloidin, and cell nuclei were stained with DAPI. Numbers represented connected pseudo-cells within a fragmented cell. (B) Morphological changes in HUVECs infected with Flag-BepC complemented strains with Bep locus deletion were identified. Stress fibers were stained with TRITC-phalloidin, FLAG-BepC was visualized by AlexaFluor 488 label secondary antibody and cell nuclei and bacteria were visualized by DAPI. The white arrow indicated the fragmented cells. The yellow arrow showed Bartonella bacilli. (C) Cells showing fragmentation were counted (infected cells in ten randomly selected visual fields were calculated). One-way ANOVA with multiple comparisons test was used. “**” p < 0.001. All experiments were performed more than three times independently, and representative data are shown. Values shown are means ± SD. Bar = 10 μm.
Fig 2
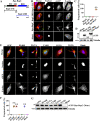
Fig 2. Bqu-BepC induces maturation of focal adhesion.
(A) After expression of eGFP-BepC and control eGFP empty vector in Hela cells by transfection, focal adhesion was visualized by Paxillin staining. Stable focal adhesion was defined as a length of over 5 μm (scale bar indicated). Focal adhesions were visualized in red, green channel indicated the expressing of BepC protein. (B) The percentage of stable adhesions in total focal adhesions was calculated in transfected cells (transfected cells in ten randomly selected fields were calculated). One-way ANOVA with multiple comparisons test was used. “**” p < 0.001. (C) Maturation of focal adhesion in cells infected with Bep locus deletion and FLAG-BepC complemented Bhe strains was investigated by Paxillin immunostaining. Focal adhesions were shown in red and blue showed cell nucleus and bacteria. Yellow arrows indicated Bartonella bacilli. (D) The ratio of stable adhesions in total adhesions was calculated (infected cells in ten randomly selected view fields were calculated). One-way ANOVA with multiple comparisons test was used. “**” p < 0.001. (E) Fractions of cytosol and membrane of cells were prepared 36 h post infection. Immunoblot was performed to investigate the T4SS delivery of FLAG-tagged BepC. Calnexin and α-tubulin were used to specify cell membrane and cytoplasmic fraction. “M” indicated membrane and “C” indicated cytosol. Representative data of 3 independent experiments are shown. Values shown are means ± SD. Bar = 10 μm.
Fig 3
Fig 3. Both the FIC (filamentation induced by c-AMP) and BID (Bartonella intracellular delivery) domain are required for BepC-induced stress fiber formation.
(A) Graphical depiction of the main domains of Bqu-BepC. (B) FIC and BID. Truncations, and full-length BepC tagged with eGFP were expressed in Hela cells by transfection. Stress fibers and cell nucleus were visualized by TRITC-phalloidin and DAPI. (C) Cells showing fragmentation after expression of full-length BepC, BID and FIC truncations were calculated (transfected cells in ten randomly selected fields were calculated). One-way ANOVA with multiple comparisons test was used. “**” p < 0.001. (D) Expression of eGFP-tagged protein was further detected by immunoblot. (E) FIC motif mutants, including signature motif deletion and site mutations, were transfected in Hela cells. ΔFIC represented the mutant with the deletion of signature motif (HPFxxGNG). Stress fibers were visualized by TRITC-phalloidin, the eGFP channel showed the expression of BepC and the corresponding mutants, and the cell nucleus were shown in blue. (F) Cell fragmentation caused by BepC mutants was calculated (transfected cells in ten randomly selected fields were calculated). One-way ANOVA with multiple comparisons test was used. “**” p < 0.001. (G) Expression of BepC and corresponding mutants was further confirmed by immunoblots. All assays were performed more than three times independently, and representative data are shown. Values shown are means ± SD. Bar = 10 μm.
Fig 4
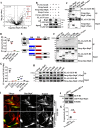
Fig 4. Bqu-BepC targets GEF-H1 to induce stress fiber formation.
(A) Strep tagged BepC was purified by streptactin beads from transfected HEK293T cells, and then potential binding candidates for BepC were identified by LC-MS/MS. The highly specific candidates of BepC in the host cell (Salmonella effector SseK2 served as control) are illustrated in Volcano plots. (B) Strep-BepC and FLAG-GEF-H1 were co-transfected in HEK293T cells, and then co-immunoprecipitated by indicated affinity beads (Strep beads indicated the immunoprecipitation of Strep tagged proteins, Flag beads indicated the immunoprecipitation of flag tagged proteins). After that, immunoprecipitated samples were detected by immunoblot. (C) Co-transfection of Strep tagged FIC, BID truncations and full-length BepC with FLAG tagged GEF-H1 was performed in HEK293T cells, co-immunoprecipitation was performed by using streptactin beads. After that, immunoprecipitated samples were detected by immunoblotting. The empty vector served as a negative control. (D) Binding of full-length BepC, BID and FIC with GEF-H1 was analyzed by calculation of band intensity to indicate the proportion of GEF-H1 within co-immunoprecipitated BepC and its truncated versions in comparison to empty vector. One-way ANOVA with multiple comparisons test was used. “**” p < 0.001. (E) Graphic demonstration of GEF-H1 protein structure. (F) Domain truncations of GEF-H1 fused with FLAG tag and Strep-BepC were co-transfected in HEK293T and were subjected to co-immunoprecipitation using streptactin beads, and their interaction was also explored by immunoblots. (G) The binding efficiency of full-length GEF-H1 and its domain truncations was analyzed by calculation of band intensity to indicate the proportion of GEF-H1 and its truncations within co-immunoprecipitated BepC in comparison with empty vector. One-way ANOVA with multiple comparisons test was used. “**” p < 0.001. (H) Binding of FIC mutants of BepC with co-transfected GEF-H1 was also investigated by Co-IP with streptactin beads as mentioned above. (I) Endogenous GEF-H1 was depleted by siRNA in stable expression cells. Subsequently, expression of eGFP-BepC in treated cells were induced by doxycycline. Stress fiber was visualized by TRITC-phalloidin. (J) Depletion of endogenous GEF-H1 by siRNA was confirmed by immunoblot. (K) The percentage of fragmented cells (eGFP-BepC positive cells in 10 randomly selected visual fields were calculated) was analyzed in the GEF-H1 depletion and control group. Student’s t test was used. “**” p < 0.001. All assays were performed more than three times independently and representative data are shown. Values shown are means ± SD. Bar = 10 μm.
Fig 5
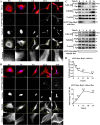
Fig 5. Bqu-BepC induces the dissociation of GEF-H1 from microtubules.
(A) Expression of BepC with eGFP tag was induced by adding doxycycline in stable cell line. At indicated time points after doxycycline treatment, endogenous GEF-H1 was probed with GEF-H1 antibody (in red). eGFP-BepC was shown in green channel and cell nucleus were visualized by DAPI staining. (B) Accordingly, microtubules were visualized by anti-tubulin antibody at the corresponding time points. Yellow boxes denoted the area used for the insert. (C) At corresponding time point after doxycycline induction, cytoskeleton-enriched fraction was collected. Localization of GEF-H1 in cytoskeleton fraction was investigated by immunoblots. Cells without doxycycline induction were used for negative control. Ppt indicated cellular precipitation fraction. (D) Protein intensity of GEF-H1 in precipitation fraction (normalized with α-tubulin) at different time points was quantified as the fold change of initial GEF-H1 level in cytoskeleton fraction. One-way ANOVA with multiple comparisons test was used. “**” p < 0.001. All assays were performed more than three times independently, and representative data are shown. Values shown are means ± SD. Bar = 10 μm.
Fig 6
Fig 6. Bqu-BepC localized within plasma membrane.
(A) Full-length BepC, truncated version of FIC and BID with eGFP tag were ectopically expressed in Hela cells by transfection, and the localization was investigated by immunofluorescence using a Z-scan. Plasma membrane was stained with a membrane probe (DiIC18(3), red). (B) Plot profile of Z-scan images generated by ImageJ was used to determine the co-localization of BepC and plasma membrane. (C) HEK293T cells were transfected with Strep tagged full-length BepC, and two truncations of FIC and BID domain. Cellular fractionation was prepared. Cellular localization of Strep tagged BepC and its truncated versions was further investigated by immunoblots. Tubulin and calnexin were used to specify cytosol and cell membrane localization, respectively. W: whole cell lysate, C: cytosol, M: plasma membrane. (D) Localization of BepC with specific organelle, including endoplasmic reticulum, golgi apparatus and mitochondria, was further investigated by immunofluorescence assay. Red colour indicated organelle, and green indicated transfected BepC. All assays were performed more than three times independently, and representative data are shown. Bar = 10 μm.
Fig 7
Fig 7. Bqu-BepC hijacks the GEF-H1/RhoA/ROCK pathway to induce stress fiber formation.
(A) After depletion of RhoA, Rac1 and Cdc42, BepC expression was induced by adding doxycycline, and then, stress fibers were probed with phalloidin. Scramble siRNA was used as negative control. (B) Percentage of cells showing fragmentation in siRNA treated cells was calculated (cells in ten randomly selected visual fields were calculated). One-way ANOVA with multiple comparisons test was used. “**” p < 0.001. (C) Endogenous RhoA, Rac1 and Cdc42 were depleted individually in stable expression cells by siRNA, and expression of these proteins was detected by immunoblots. (D) Expression of eGFP-tagged BepC induced by doxycycline in the corresponding cells (siRNA treatment as above mentioned) was further investigated by immunoblot. (E) GTPase activity of RhoA was investigated by GST-RBD binding assay in cells with or without doxycycline induction. BepC expression and total RhoA was detected in whole cell lysate (input), equal loading of GST-RBD was confirmed by Coomassie blue staining of GST immunoprecipitation samples. GTP-bound RhoA was detected in Co-IP sample. (F) Protein intensity was calculated to indicate the relative proportion of GTP bound RhoA with total RhoA in cells with or without doxycycline induction. Student t test was used. “**” p < 0.001. (G) ROCK inhibitor Y-27632 was added before BepC induced, and then, stress fibers were visualized with phalloidin staining (red) after BepC (green) was induced after 24 h. NC indicated no drug treatment. (H) Percentage of cells showing fragmentation in ROCK inhibitor Y-27632 treated cells was calculated (cells in ten randomly selected visual fields were calculated). Student t test was used. “**” p < 0.001. (I) Expression of eGFP-tagged BepC induced by doxycycline in stable cells was further investigated by immunoblot. (J) ROCK inhibitor Y-27632 treated cells were probed with GEF-H1 antibody (red), BepC in green. (K) Expression of BepC was detected by immunoblot. Data from one representative experiment data (n = 3) were shown. Values shown are means ± SD. Bar = 10 μm.
Fig 8
Fig 8. Working model of BepC-induced stress fiber formation.
Bartonella translocates BepC in host cell by VirB/VirD translocation system. BepC targets GEF-H1 and results its dissociation from microtubule so that GEF-H1 restores its GEF function on RhoA. And then, BID domain of BepC directs BepC/GEF-H1 complex to plasma membrane where GEF-H1 can activate RhoA/ROCK pathway and promotes the formation of stress fibers. Excessive stress fiber formation, however, results the maturation of focal adhesion at the rear edge, and eventually causes host cell fragmentation.

Similar articles

Cited by

References

    1. Minnick MF, Battisti JM. Pestilence, persistence and pathogenicity: infection strategies of Bartonella. Future Microbiol. 2009;4(6):743–58. 10.2217/fmb.09.41 - DOI - PMC - PubMed
    1. Chomel BB, Boulouis HJ, Breitschwerdt EB, Kasten RW, Vayssier-Taussat M, Birtles RJ, et al. Ecological fitness and strategies of adaptation of Bartonella species to their hosts and vectors. Vet Res. 2009;40(2):29 10.1051/vetres/2009011 - DOI - PMC - PubMed
    1. Tsai YL, Chang CC, Chuang ST, Chomel BB. Bartonella species and their ectoparasites: selective host adaptation or strain selection between the vector and the mammalian host? Comp Immunol Microbiol Infect Dis. 2011;34(4):299–314. 10.1016/j.cimid.2011.04.005 - DOI - PubMed
    1. Harms A, Dehio C. Intruders below the radar: molecular pathogenesis of Bartonella spp. Clin Microbiol Rev. 2012;25(1):42–78. 10.1128/CMR.05009-11 - DOI - PMC - PubMed
    1. Zhu C, Bai Y, Liu Q, Li D, Hong J, Yang Z, et al. Depolymerization of cytokeratin intermediate filaments facilitates intracellular infection of HeLa cells by Bartonella henselae. J Infect Dis. 2013;207(9):1397–405. 10.1093/infdis/jit040 - DOI - PubMed

Publication types

MeSH terms

Substances

LinkOut - more resources