. 2021 Feb 18;184(4):1000-1016.e27.
doi: 10.1016/j.cell.2020.12.040. Epub 2021 Jan 27.

Functional characterization of the dural sinuses as a neuroimmune interface

Affiliations

Functional characterization of the dural sinuses as a neuroimmune interface

Justin Rustenhoven et al. Cell. .

Abstract

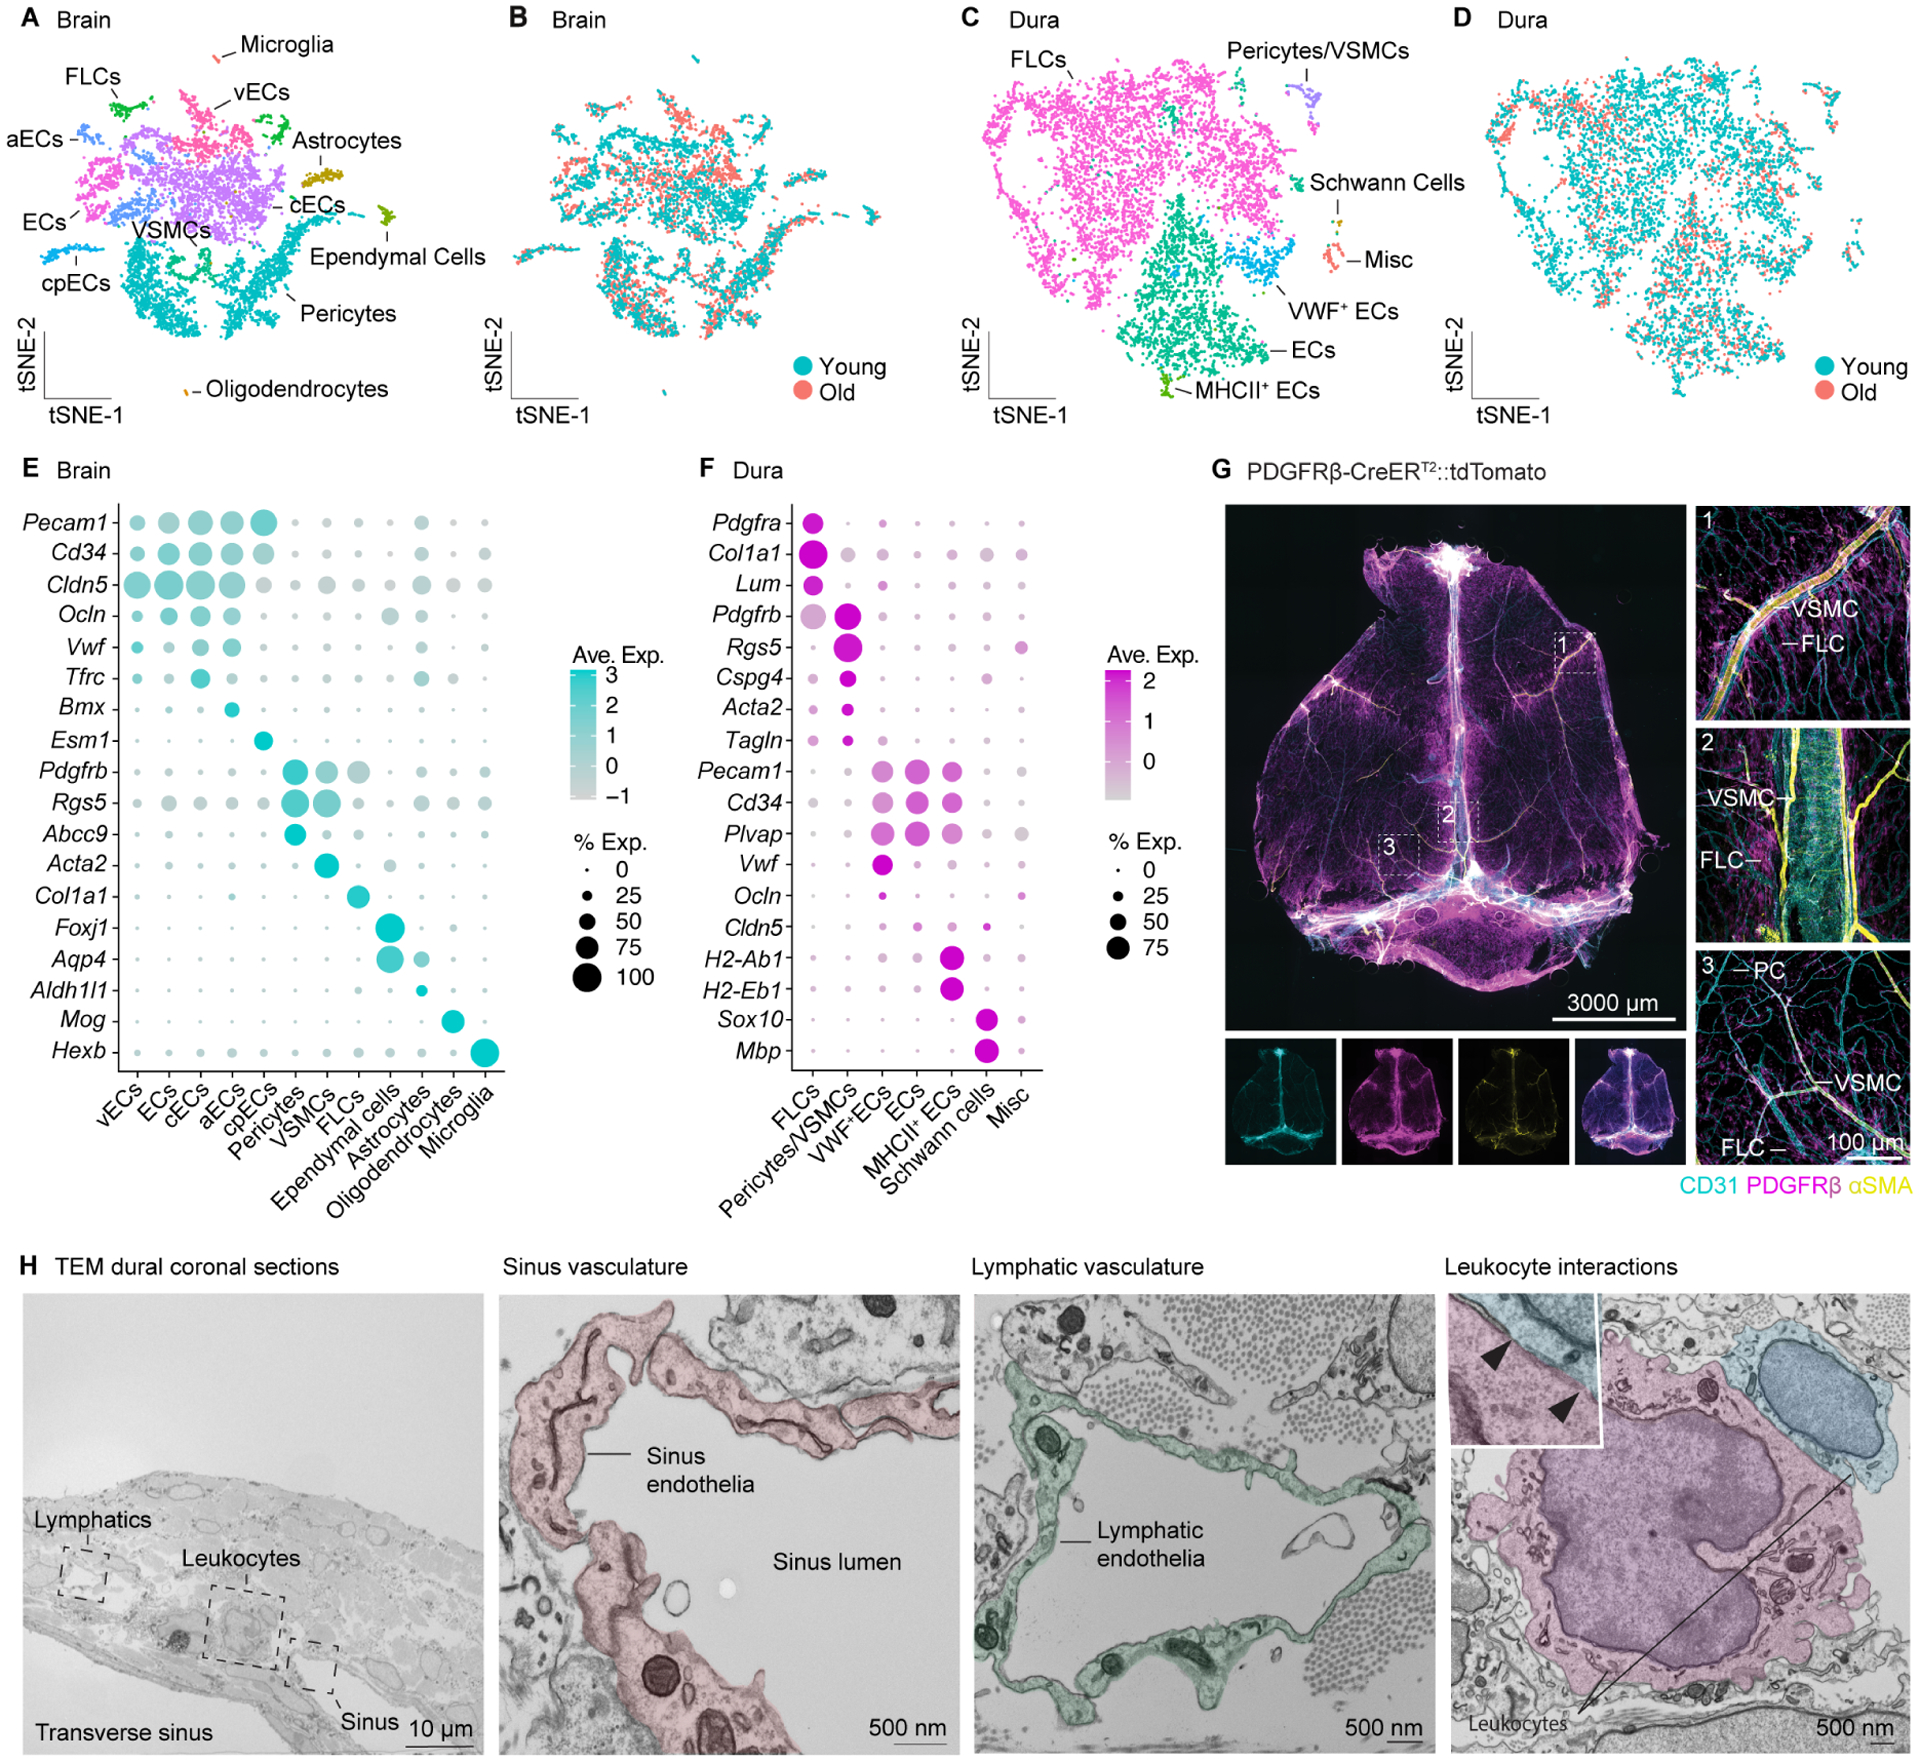
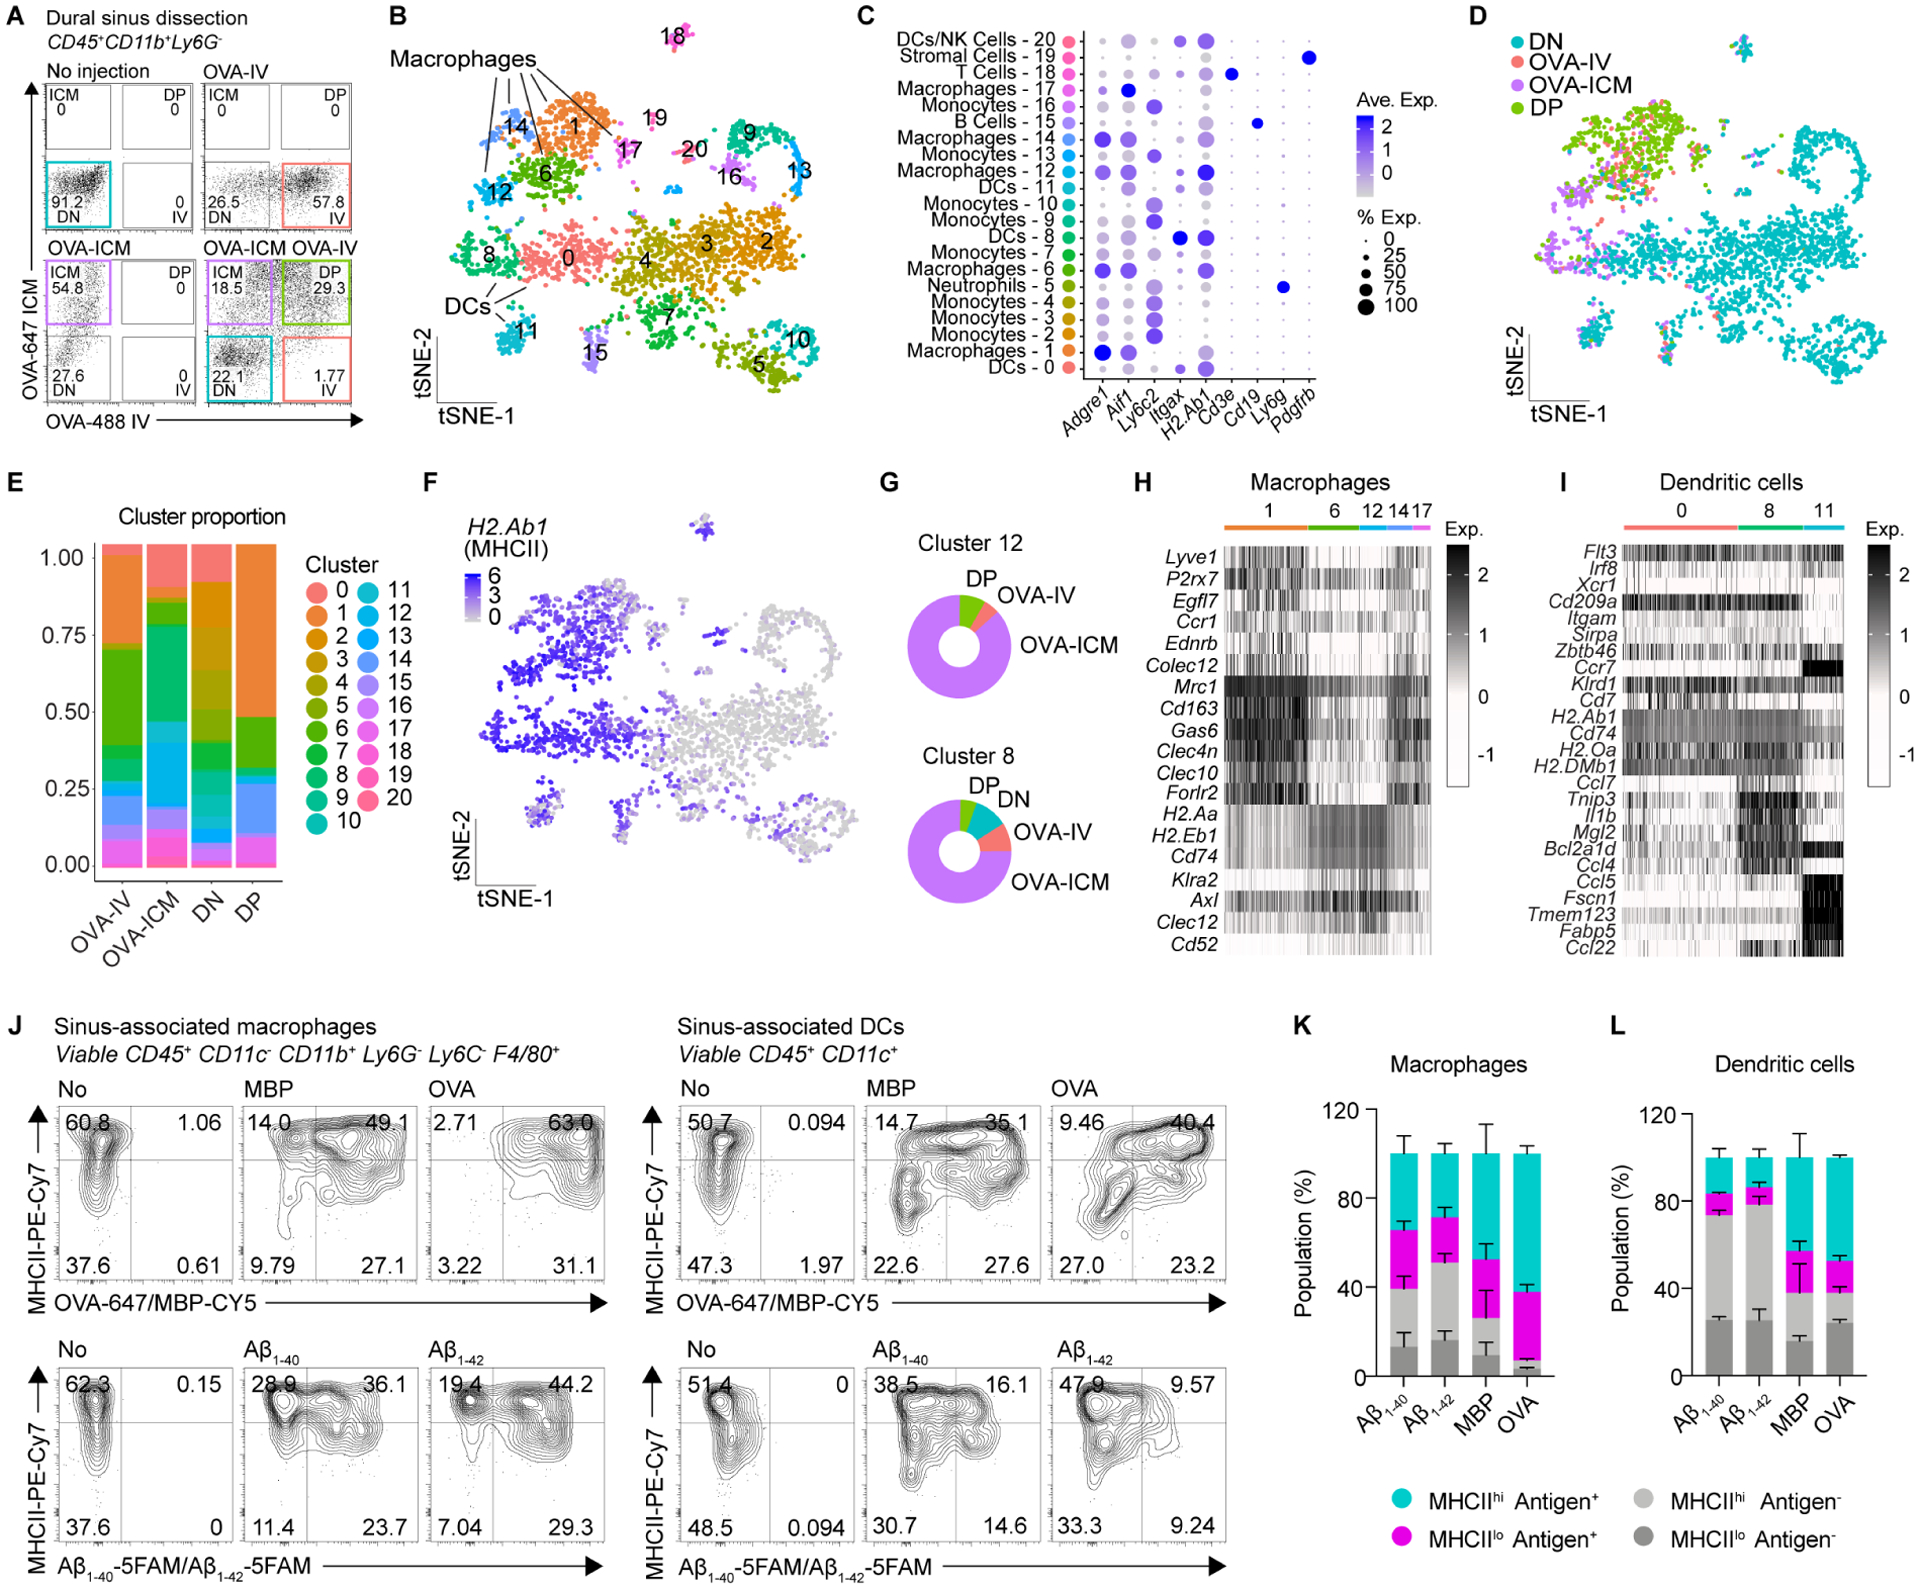
Despite the established dogma of central nervous system (CNS) immune privilege, neuroimmune interactions play an active role in diverse neurological disorders. However, the precise mechanisms underlying CNS immune surveillance remain elusive; particularly, the anatomical sites where peripheral adaptive immunity can sample CNS-derived antigens and the cellular and molecular mediators orchestrating this surveillance. Here, we demonstrate that CNS-derived antigens in the cerebrospinal fluid (CSF) accumulate around the dural sinuses, are captured by local antigen-presenting cells, and are presented to patrolling T cells. This surveillance is enabled by endothelial and mural cells forming the sinus stromal niche. T cell recognition of CSF-derived antigens at this site promoted tissue resident phenotypes and effector functions within the dural meninges. These findings highlight the critical role of dural sinuses as a neuroimmune interface, where brain antigens are surveyed under steady-state conditions, and shed light on age-related dysfunction and neuroinflammatory attack in animal models of multiple sclerosis.

Keywords: CNS autoimmunity; CSF flow; antigen presentation; dura mater; meningeal immunity; meningeal lymphatics; meninges; neuroimmunology; sinus; stromal cells.


Conflict of interest statement

Declaration of interests J.K. is a shareholder and a member of the scientific advisory group for PureTech.

Figures

Figure 1
Figure 1. Dural sinuses are regional hubs for homeostatic meningeal immunity.
(A–C) Immunohistochemistry of CD3+ T cells, MHCII+/–IBA1+ macrophages, and CD31+ endothelium, at the superior sagittal sinus, transverse sinus, and non-sinus regions of the dura mater. S.S. sinus=superior sagittal sinus. Insert schematics demonstrate examples of anatomical sites where images were captured. (D–F) Quantification of CD3+ T cell numbers, IBA1 coverage, and percentage of macrophages that are MHCII+ at non-sinus and sinus regions. NS=not significant, *** p<0.001 (Student’s t-test), n=5 mice. (G) Quantification of CD3+ T cells contacting MHCII+ APCs at dural sinuses. n=4 mice, n=419 T cell-MHCII interactions counted total. (H) Immunohistochemistry demonstrating CD3+ T cells and MHCII+ cells near LYVE1+ lymphatic endothelium at the superior sagittal sinus. (I) Immunohistochemistry demonstrating IBA1+, HLA-DR, DP, DQ+ myeloid cells at the human superior sagittal sinus, representative of n=4 human samples. (J) t-SNE visualization demonstrating CyTOF phenotyping of CD45+ immune cells within young (2–3 months) and old (20–24 months) dura mater. t-SNE displays pooled samples from n=8 mice/group. (K) Volcano plot showing average log2 fold change and adjusted log2 p value for cluster changes between young and old dural immune populations. Data points represent the average of n=8 samples per group. Dotted line represents an adjusted p value of 0.05 (GLMM with BH correction). (L, M) Quantification of CD8 and CD4 T cell numbers in young and aged dura from CyTOF analysis. *** p<0.001 (GLMM with BH correction), n=8 mice/group. (N–P) Immunohistochemistry and quantification of CD3+ T cells at non-sinus and sinus regions of the dural meninges in young and aged mice. ** p<0.01, *** p<0.001 (Student’s t-test), n=5 mice/group. (Q) Flow cytometry quantification of vascular (CD45hi) and parenchymal (CD45lo) viable, single, TCRβ+ T cells following i.v. injection of anti-CD45 three minutes prior to sacrifice. ** p<0.01, (Two-way ANOVA with Sidak’s post-hoc test), n=5 mice/group. Data are represented as mean ± SEM. See also Figure S1 and Figure S2.
Figure 2
Figure 2. Cellular, molecular, and spatial characterization of the dural stroma.
(A–D) t-SNE visualization of color-coded scRNA-seq brain and dural meningeal stromal populations based on cell types and age, n=15 total pooled mice per sample, from two independent experiments. Young mice are 2–3 months and old mice are 20–24 months old. (E, F) Dot plots demonstrating scaled gene expression and percentage of cells expressing these genes for cluster phenotyping markers for brain and dural stromal populations. (G) Whole-mount immunohistochemistry of dural PDGFRβ+ mural populations and association with distinct CD31+ vascular structures in PDGFRβ-CreERT2::tdTomato reporter mice, representative of n=4 mice. (H) Transmission electron microscopy (TEM) demonstrating ultrastructural composition of the mouse dural transverse sinus including sinus endothelial cells, lymphatic endothelial cells, and leukocyte interactions, representative of n=4 mice. Inserts represent enlarged regions of particular structures of interest, all from the same section. See also Figure S3.
Figure 3
Figure 3. Sinus vasculature allows homeostatic T cell surveillance.
(A) Dot plot demonstrating scaled gene expression and percentage of cells expressing these genes for cell markers, junctional proteins, and adhesion molecules in dural stromal populations from scRNA-seq analysis. (B, C) Immunohistochemistry demonstrating specific expression of VWF on dural sinus endothelium. S.S. sinus = superior sagittal sinus. (D) Immunohistochemistry demonstrating conserved VWF and VCAM1 expression at the human superior sagittal sinus, representative of n=4 human samples. (E, F) Representative trace and velocity maps demonstrating two hours of live adherence in the dural meninges of UBC-GFP CD4 T cells 10 days following transfer to RAG2 KO hosts, visualized by stereomicroscopy of craniotomized mice. (G) Quantification of vascular adherent events in the dural meninges at the sinuses, cerebral veins projecting into the sinuses, or all other regions. * p<0.05, *** p<0.001 (One-way ANOVA with Tukey’s post-hoc test), n=8 mice. (H) Representative traces demonstrating 30 minutes of live adherence in the dural meninges of UBC-GFP CD4 T cells 10 days following transfer to RAG2 KO mice, visualized by stereomicroscopy of craniotomized mice, either pre-blockade or following i.v. anti-VLA4, -LFA1, and -PSGL1 blocking antibodies. (I) Quantification of vascular adherent events in the dural meninges following either i.v. isotype control, or anti-VLA4, -LFA1, and -PSGL1 blocking antibodies normalized to the adherent events of the same mouse pre-blockade. ** p<0.01 (Student’s t-test), n=3 mice/group. (J) Two-photon microscopy snapshots demonstrating extravasation of CD4 T cells from the superior sagittal sinus six days following transfer of UBC-GFP CD4 T cells to RAG2 KO hosts. See also Video S1 for full video. (K, L) Flow cytometry analysis and quantification for the frequency of GFP+ CD45+ cells in blood and GFP+ CD4 T cells, CD8 T cells, and macrophages in the dural meninges of WT hosts 1.5 months after parabiotic pairing with UBC-GFP mice. n=9–10 mouse pairs. (M) Top 10 GO Biological Process terms describing differentially expressed genes between young and old dural stromal cells from stromal scRNA-seq analysis. (N–P) Immunohistochemistry and quantification of ICAM1 and VCAM1 expression in young (2–3 months old) and old (20–24 months old) dural meninges at sinus and non-sinus regions. NS=not significant, * p<0.05, *** p<0.001 (Two-way ANOVA with Sidak’s post-hoc test), n=3 mice/group. See also Figure S4.
Figure 4
Figure 4. Dural sinus-associated stroma allows homeostatic T cell recruitment and retention.
(A) t-SNE visualization of color-coded scRNA-seq of whole dural meningeal populations based on cell types, n=10 total pooled mice per sample, from two independent experiments. (B) t-SNE visualization of color-coded scRNA-seq analysis of whole dural meningeal populations based on predicted adhesiveness to mural or endothelial populations using RNAMagnet. Colored cells represent the strongest predicated physical adhesion of that cell to an endothelial (cyan) or mural (magenta) cell. Grey cells represented maximal predicted adhesiveness to non-stromal populations. Opacity represents strength of adhesion. (C) t-SNE visualization of expression for selected ligand (cyan) and receptor (magenta) pairings for stromal-immune physical interactions and signaling crosstalk. (D–F) Immunohistochemistry and quantification of collagen I and laminin coverage in non-sinus and sinus regions of young (2–3 months old) and old (20–24 months old) dural meninges. NS=not significant, * p<0.05, ** p<0.01, *** p<0.001 (Two-way ANOVA with Sidak’s post-hoc test), n=3 mice/group (G) Dot plot demonstrating scaled gene expression and percentage of cells expressing these genes for chemokines in meningeal stromal populations from scRNA-seq stromal analysis. (H) Immunohistochemistry of CXCL12 expression at sinus and non-sinus regions in WT mice, representative of n=4 mice. (I, J) Immunohistochemistry and quantification of CXCL12 expression at sinus and non-sinus regions in CXC12-DsRed mice. *** p<0.001 (Student’s t-test), n=4 mice. (K) Ratio of non-targeting control (NTC) or CXCR4 KO CRISPR-Cas9 modified CD4 T cells 12 days after transfer into RAG2 KO mice at a 1:1 ratio in the lung, spleen, and dural meninges. Numbers are normalized to the ratio of NTC and CXCR4 KO cells in the blood of the same mouse. * p<0.05, ** p<0.01 (One-way ANOVA with Tukey’s post-hoc test), n=6. (L–N) Flow cytometry analysis and quantification of viable, single, CD45+ Thy1.2+ TCRβ+ CD4+ T cells in the dura and blood of PDGFRβ-CreERT2::CXCL12+/+ or PDGFRβ-CreERT2::CXCL12fl/+ mice 60 days after final tamoxifen injection (five injections). NS=not significant, ** p<0.01 (Student’s t-test), n=3–5 per group. See also Figures S5 and S6.
Figure 5
Figure 5. Cerebrospinal fluid antigens efflux to perisinusal dura.
(A) Schematic of brain and meningeal anatomy from a coronal and dorsal perspective demonstrating CSF and blood flow. (B, C) Stereomicroscopy time-lapse images and quantification of tracer accumulation at the dural sinuses following i.c.m. administration of OVA-647, representative of n=6 mice. (D, E) Immunohistochemistry and quantification of i.c.m. administered OVA-647, Aβ1–40-5-FAM, Aβ1–42-5-FAM, and MBP-Cy5 at non-sinus and sinus regions of the dural meninges two hours post injection. ** p<0.01, *** p<0.001 (Student’s t-test), n=4–5 mice/tracer. (F, G) Immunohistochemistry of OVA-647 accumulation within IBA1+ and IBA1 cells at the superior sagittal sinus two hours post injection, representative of n=4 mice. (H, I) Immunohistochemistry and quantification of intraparenchymal striatal administered OVA-647 at non-sinus and sinus regions of the dural meninges one hour post injection. * p<0.05 (Student’s t-test), n=5 mice. (J, K) Immunohistochemistry and quantification of endogenous amyloid-beta (Aβ) accumulation at non-sinus and sinus regions of the dural meninges of six months old male 5xFAD mice. *** p<0.001 (Student’s t-test), n=4 mice. (L) Heatmap demonstrating expression of brain-enriched proteins classified by the human tissue specific proteome from the Human Protein Atlas in dural meninges of mice and humans using liquid chromatography-mass spectrometry (LC-MS), n=4 mouse dural samples, with each sample consisting of three pooled dura, n=4 human samples from dural sinus, or matched perisinus regions from four independent patients. (M–O) Immunohistochemistry and quantification of dural LYVE1+ lymphatic coverage one week after Visudyne injection alone or Visudyne with photoconversion and i.c.m. administered OVA-647 coverage two hours post injection at sinus and non-sinus regions. ** p<0.01 (Student’s t-test), n=5 mice/group. NS=not significant (Two-way ANOVA with Sidak’s post-hoc test), n=5 mice/group. PC=photoconversion. (P) Quantification of i.c.m. administered OVA-647 coverage two hours post injection at sinus and non-sinus regions one week after sham surgery or ligation of afferent lymphatic vasculature to the deep cervical lymph node (dCLN). NS=not significant (Two-way ANOVA with Sidak’s post-hoc test), n=4–5 mice/group. See also Figure S7.
Figure 6
Figure 6. Dural sinus-associated APCs capture CSF antigens.
(A) Flow cytometry plots and experimental design for scRNA-seq analysis of OVA-accumulating dural myeloid cells specifically from dissected superior sagittal and transverse sinuses one hour following i.v. and i.c.m. delivery. OVA-IV=positive for i.v. administered OVA-488 only, OVA-ICM=positive for i.c.m. administered OVA-647 only, DN=double negative accumulating neither tracer, and DP=double positive for both tracers. (B) t-SNE visualization demonstrating scRNA-seq phenotyping of dural sinus-associated CD45+, CD11b+, Ly6G myeloid cells positive or negative for i.v. administered OVA-488 and i.c.m. administered OVA-647, color coded by cell type. Macrophage and DC clusters are highlighted. n=20 pooled mice. (C) Dot plot demonstrating scaled gene expression of phenotyping markers for dural sinus-associated myeloid populations accumulating OVA-488 i.v. and/or OVA-647 i.c.m., n=20 pooled mice. (D) t-SNE visualization for dural sinus-associated CD45+, CD11b+, Ly6G myeloid cells positive or negative for i.v. administered OVA-488 and i.c.m. administered OVA-647, color coded by OVA uptake characteristics. (E) Cluster distributions detailing proportions of cell types accumulating OVA-488 i.v. and/or OVA-647 i.c.m. (F) t-SNE visualization demonstrating high expression of H2.Ab1 (MHCII) in OVA-accumulating dural sinus-associated CD45+, CD11b+, Ly6G myeloid cells. (G) Donut plots demonstrating proportion of cells by OVA uptake characteristics within macrophage cluster 12 and cDC2 cluster 8. (H, I) Heatmaps demonstrating phenotyping of dural sinus-associated macrophages and DCs accumulating OVA-488 i.v. and/or OVA-647 i.c.m., n=20 pooled mice. (J–L) Flow cytometry and quantification demonstrating uptake of i.c.m. delivered OVA-647, Aβ1–40-5-FAM, Aβ1–42-5-FAM, and MBP-Cy5 by dural sinus associated macrophages and DCs two hours post injection. Data are represented as mean ± SEM from n=5 mice/group.
Figure 7
Figure 7. Dural sinus-associated APCs present CSF antigens to patrolling T cells.
(A) Immunohistochemistry of Nur77-GFP expression in CD3+ T cells at the superior sagittal sinus of Nur77-GFP mice, representative of n=3 mice. (B, C) Flow cytometry and quantification of Nur77-GFP expression in CD4 and CD8 T cells in the dura of Nur77-GFP mice, n=4 mice. (D) Representative two-photon microscopy snapshot and tracers of T cell trajectories over a two hour imaging period at the superior sagittal sinus of RAG2 KO mice 14 days post transfer of UBC-GFP CD4 T cells. Tracers are color coded by the length of the tracing period (0–120 minutes). S.S. sinus=superior sagittal sinus. (E–G) Quantification of individual T cell total displacement per hour (μm/hr), average velocity (μm/min), and T cell arrest coefficient (fraction of time velocity<0.2 μm/min) during 60–120 minutes of two-photon microscopy. Color coded based on T cells from individual mice, n=3 mice, n=207 individual T cells tracked total. (H–L) Flow cytometry and quantification of dural Thy1.2 CD4 T cells or Thy1.2+ TCRVβ5.1/2+ OT-II CD4 T cell numbers and phenotype in the dural meninges of Thy1.1 mice three or 14 days following PBS or OVA323–339 i.c.m. administration and i.v. transfer of DC-activated OT-II cells. Activated=CD44+CD69, tissue resident memory (TRM)=CD44+CD69+.* p<0.05 (Student’s t-test), n=5 mice/group. (M, N) Immunohistochemistry and quantification of CD3 coverage at non-sinus, superior sagittal sinus, and transverse sinus regions of naïve mice or three-14 days post experimental autoimmune encephalomyelitis (EAE) induction. No stars=not significant, * p<0.05, ** p<0.01, *** p<0.001 vs naïve mice (One-way ANOVA with Dunnett’s post-hoc test) n=4–5 mice/group. T. sinus=transverse sinus, S.S. sinus=superior sagittal sinus. (O–Q) Flow cytometry and quantification of Thy1.2 CD4 T cells or Thy1.2+ TCRVβ11+ 2D2 CD4 T cell numbers and phenotype in the dural meninges of naïve or day 14 EAE induced Thy1.1 mice after i.v. transfer of naïve 2D2 T cells at day 7. Activated=CD44+CD69, tissue resident memory (TRM)=CD44+CD69+.** p<0.01 (Student’s t-test), n=5 mice/group. See also Figure S8.

Comment in

Similar articles

Cited by

References

    1. Ahn JH, Cho H, Kim J-H, Kim SH, Ham J-S, Park I, Suh SH, Hong SP, Song J-H, Hong Y-K, et al. (2019). Meningeal lymphatic vessels at the skull base drain cerebrospinal fluid. Nature 572, 62–66. - PubMed
    1. Alves de Lima K, Rustenhoven J, Da Mesquita S, Wall M, Salvador AF, Smirnov I, Martelossi Cebinelli G, Mamuladze T, Baker W, Papadopoulos Z, et al. (2020a). Meningeal γδ T cells regulate anxiety-like behavior via IL-17a signaling in neurons. Nat. Immunol 21, 1421–1429. - PMC - PubMed
    1. Alves de Lima K, Rustenhoven J, and Kipnis J (2020b). Meningeal immunity and its function in maintenance of the central nervous system in health and disease. Annu. Rev. Immunol 38, 597–620. - PubMed
    1. Ashouri JF, and Weiss A (2017). Endogenous nur77 is a specific indicator of antigen receptor signaling in human T and B cells. J. Immunol 198, 657–668. - PMC - PubMed
    1. Aspelund A, Antila S, Proulx ST, Karlsen TV, Karaman S, Detmar M, Wiig H, and Alitalo K (2015). A dural lymphatic vascular system that drains brain interstitial fluid and macromolecules. J. Exp. Med 212, 991–999. - PMC - PubMed

Publication types

MeSH terms