. 2021 Jul 13:109:110255.
doi: 10.1016/j.pnpbp.2021.110255. Epub 2021 Jan 27.

Patterns of cilia gene dysregulations in major psychiatric disorders

Affiliations

Patterns of cilia gene dysregulations in major psychiatric disorders

Wedad Alhassen et al. Prog Neuropsychopharmacol Biol Psychiatry. .

Abstract

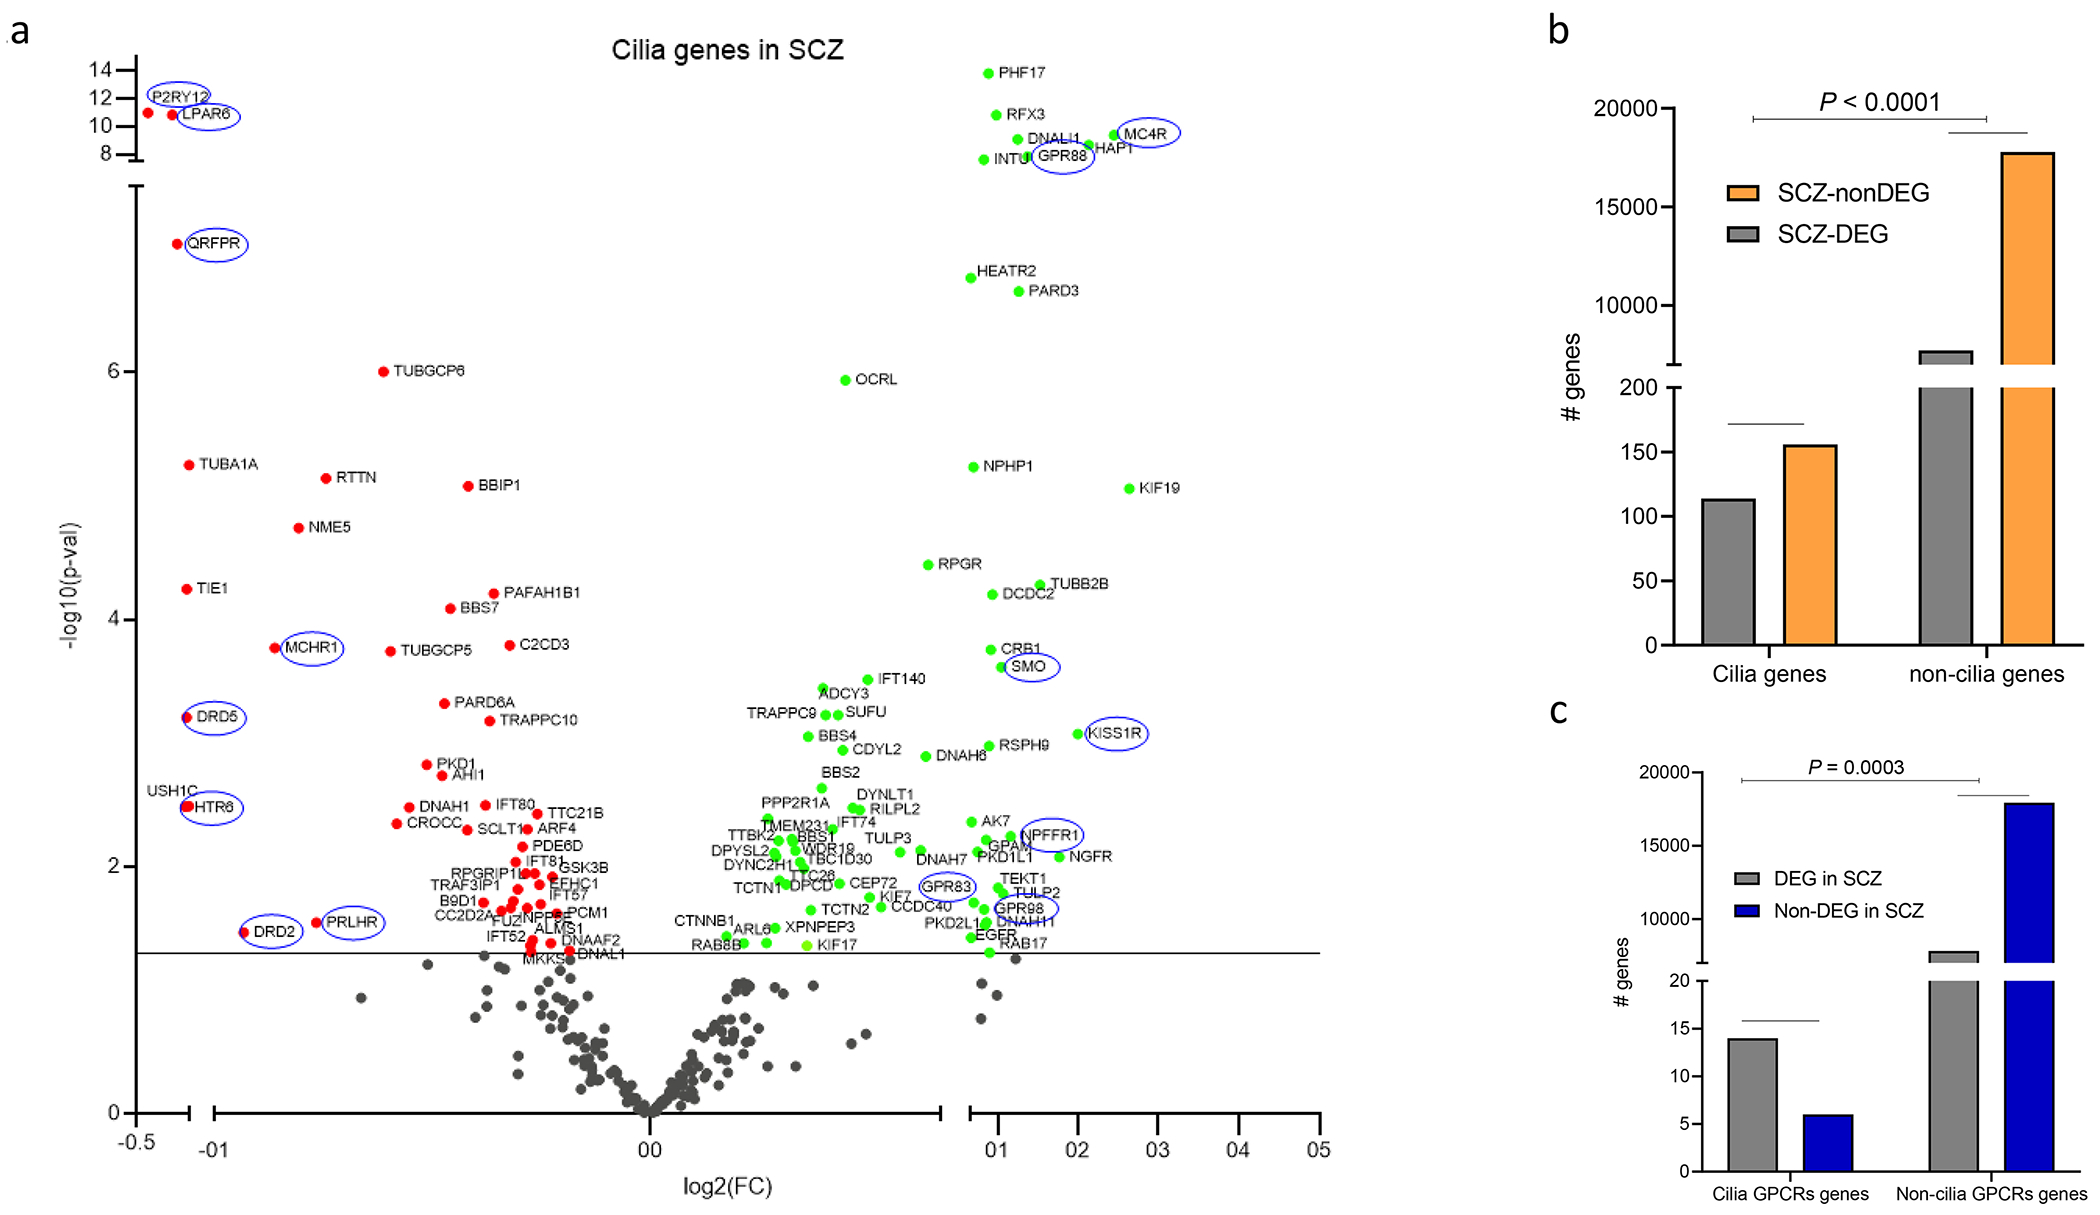
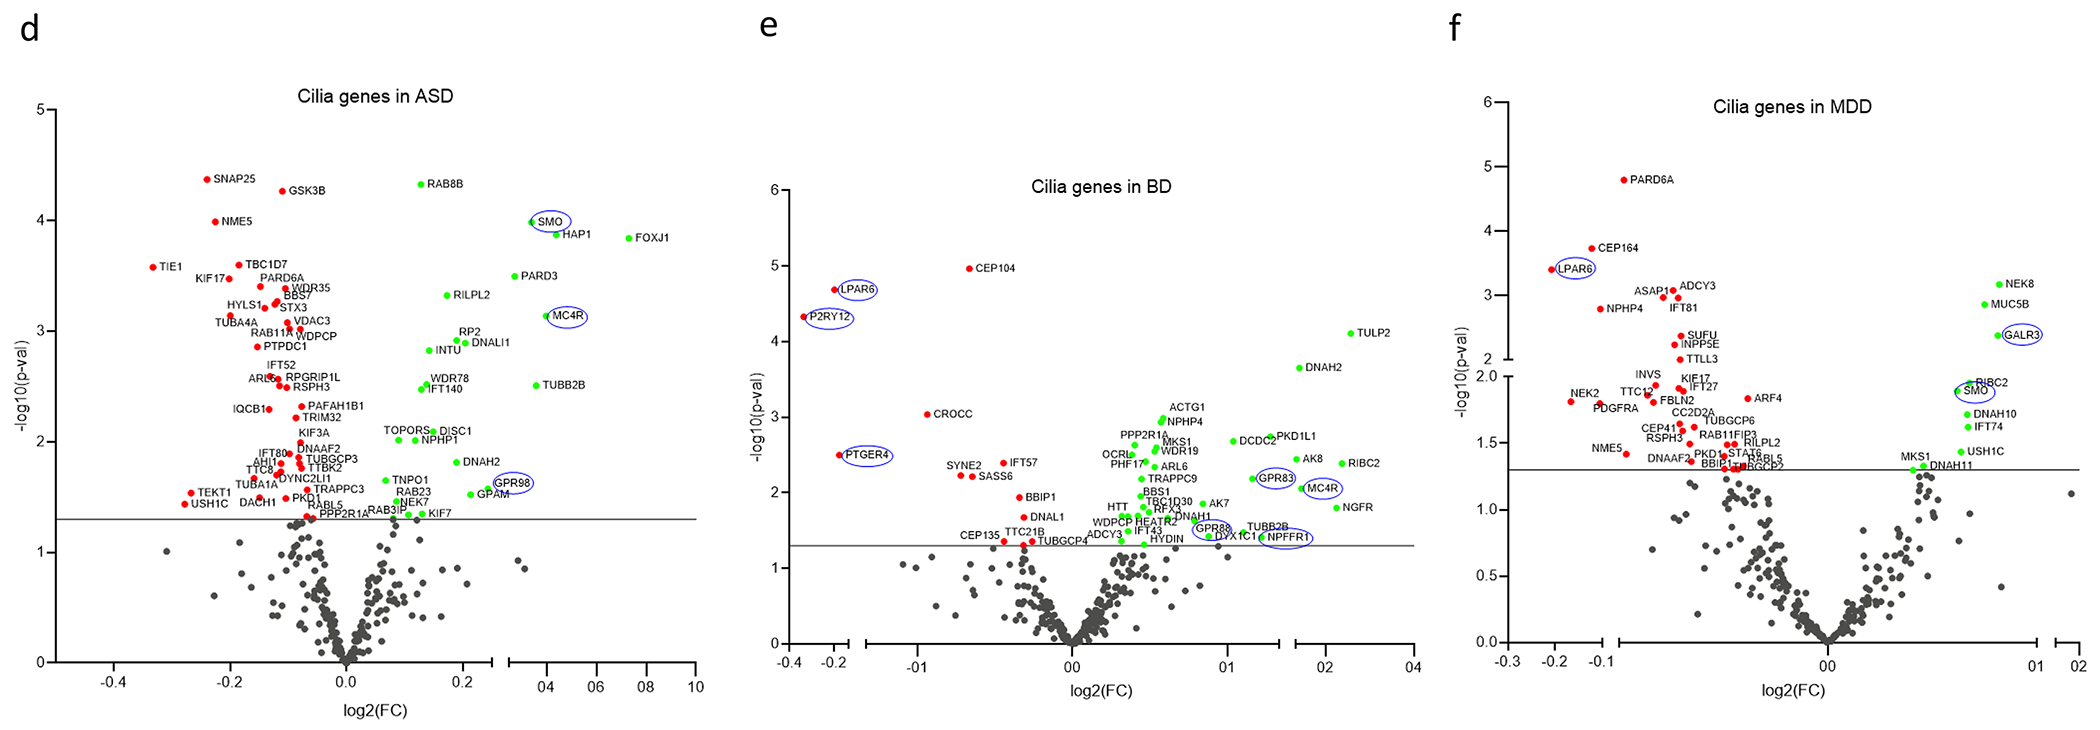
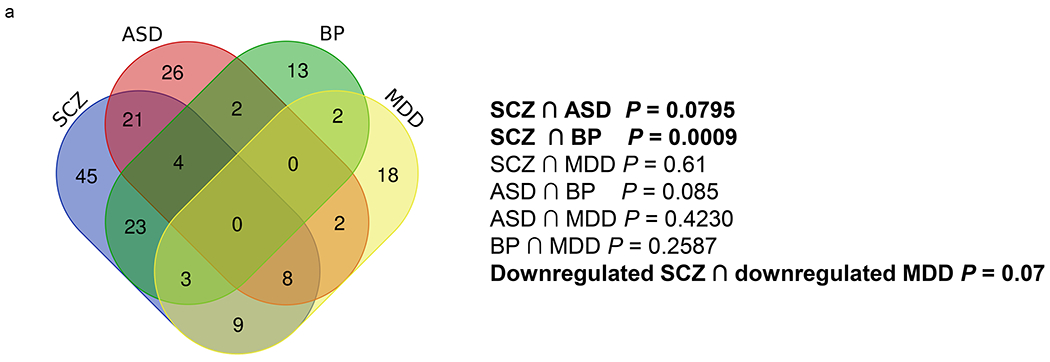
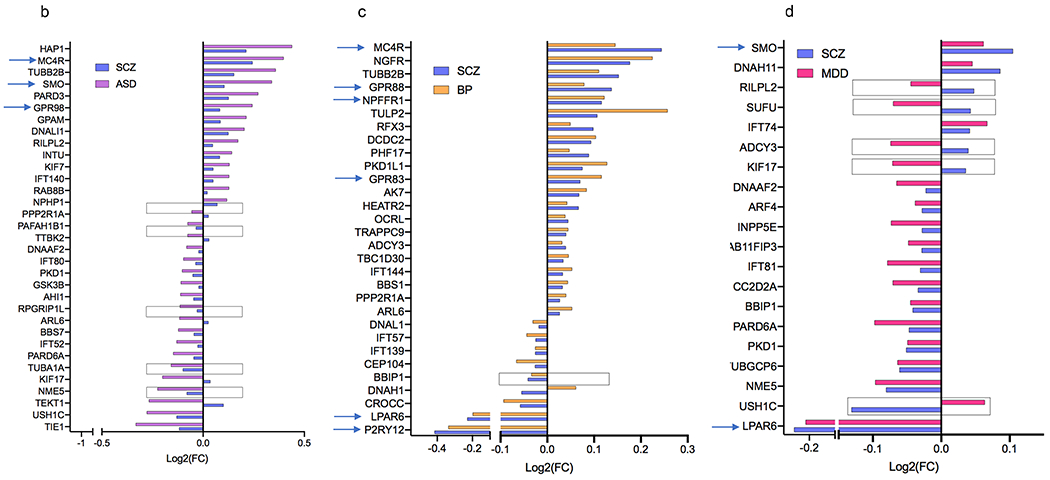
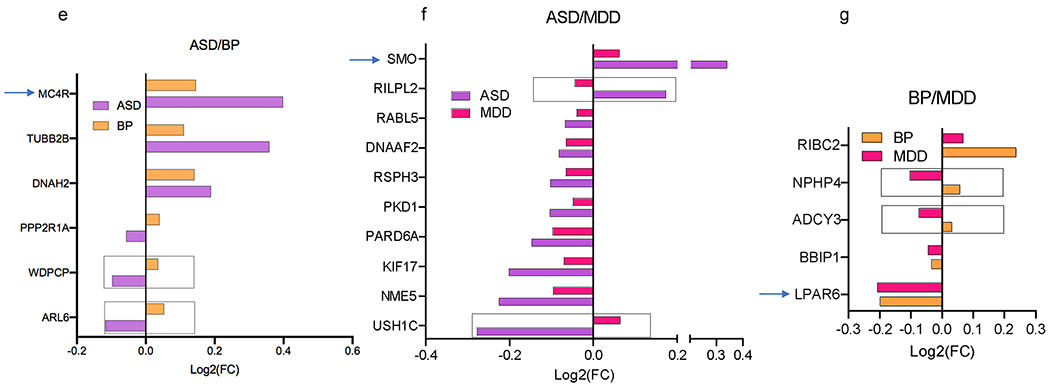
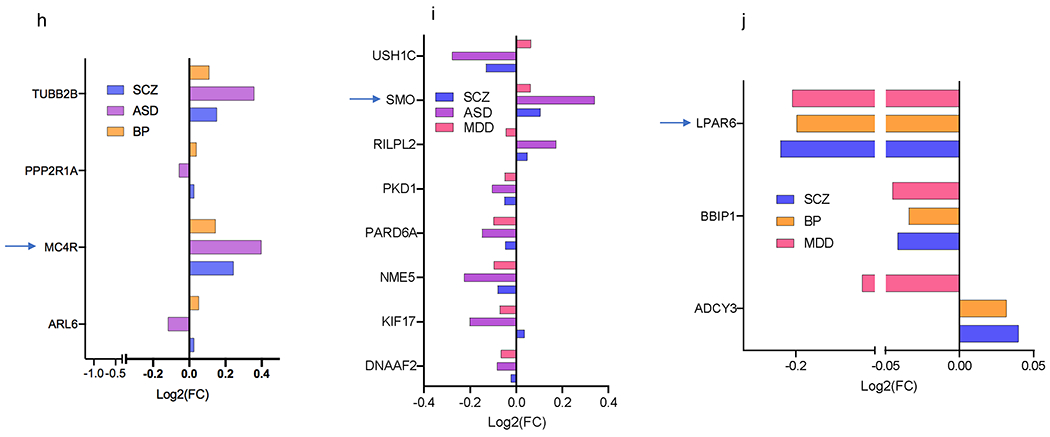
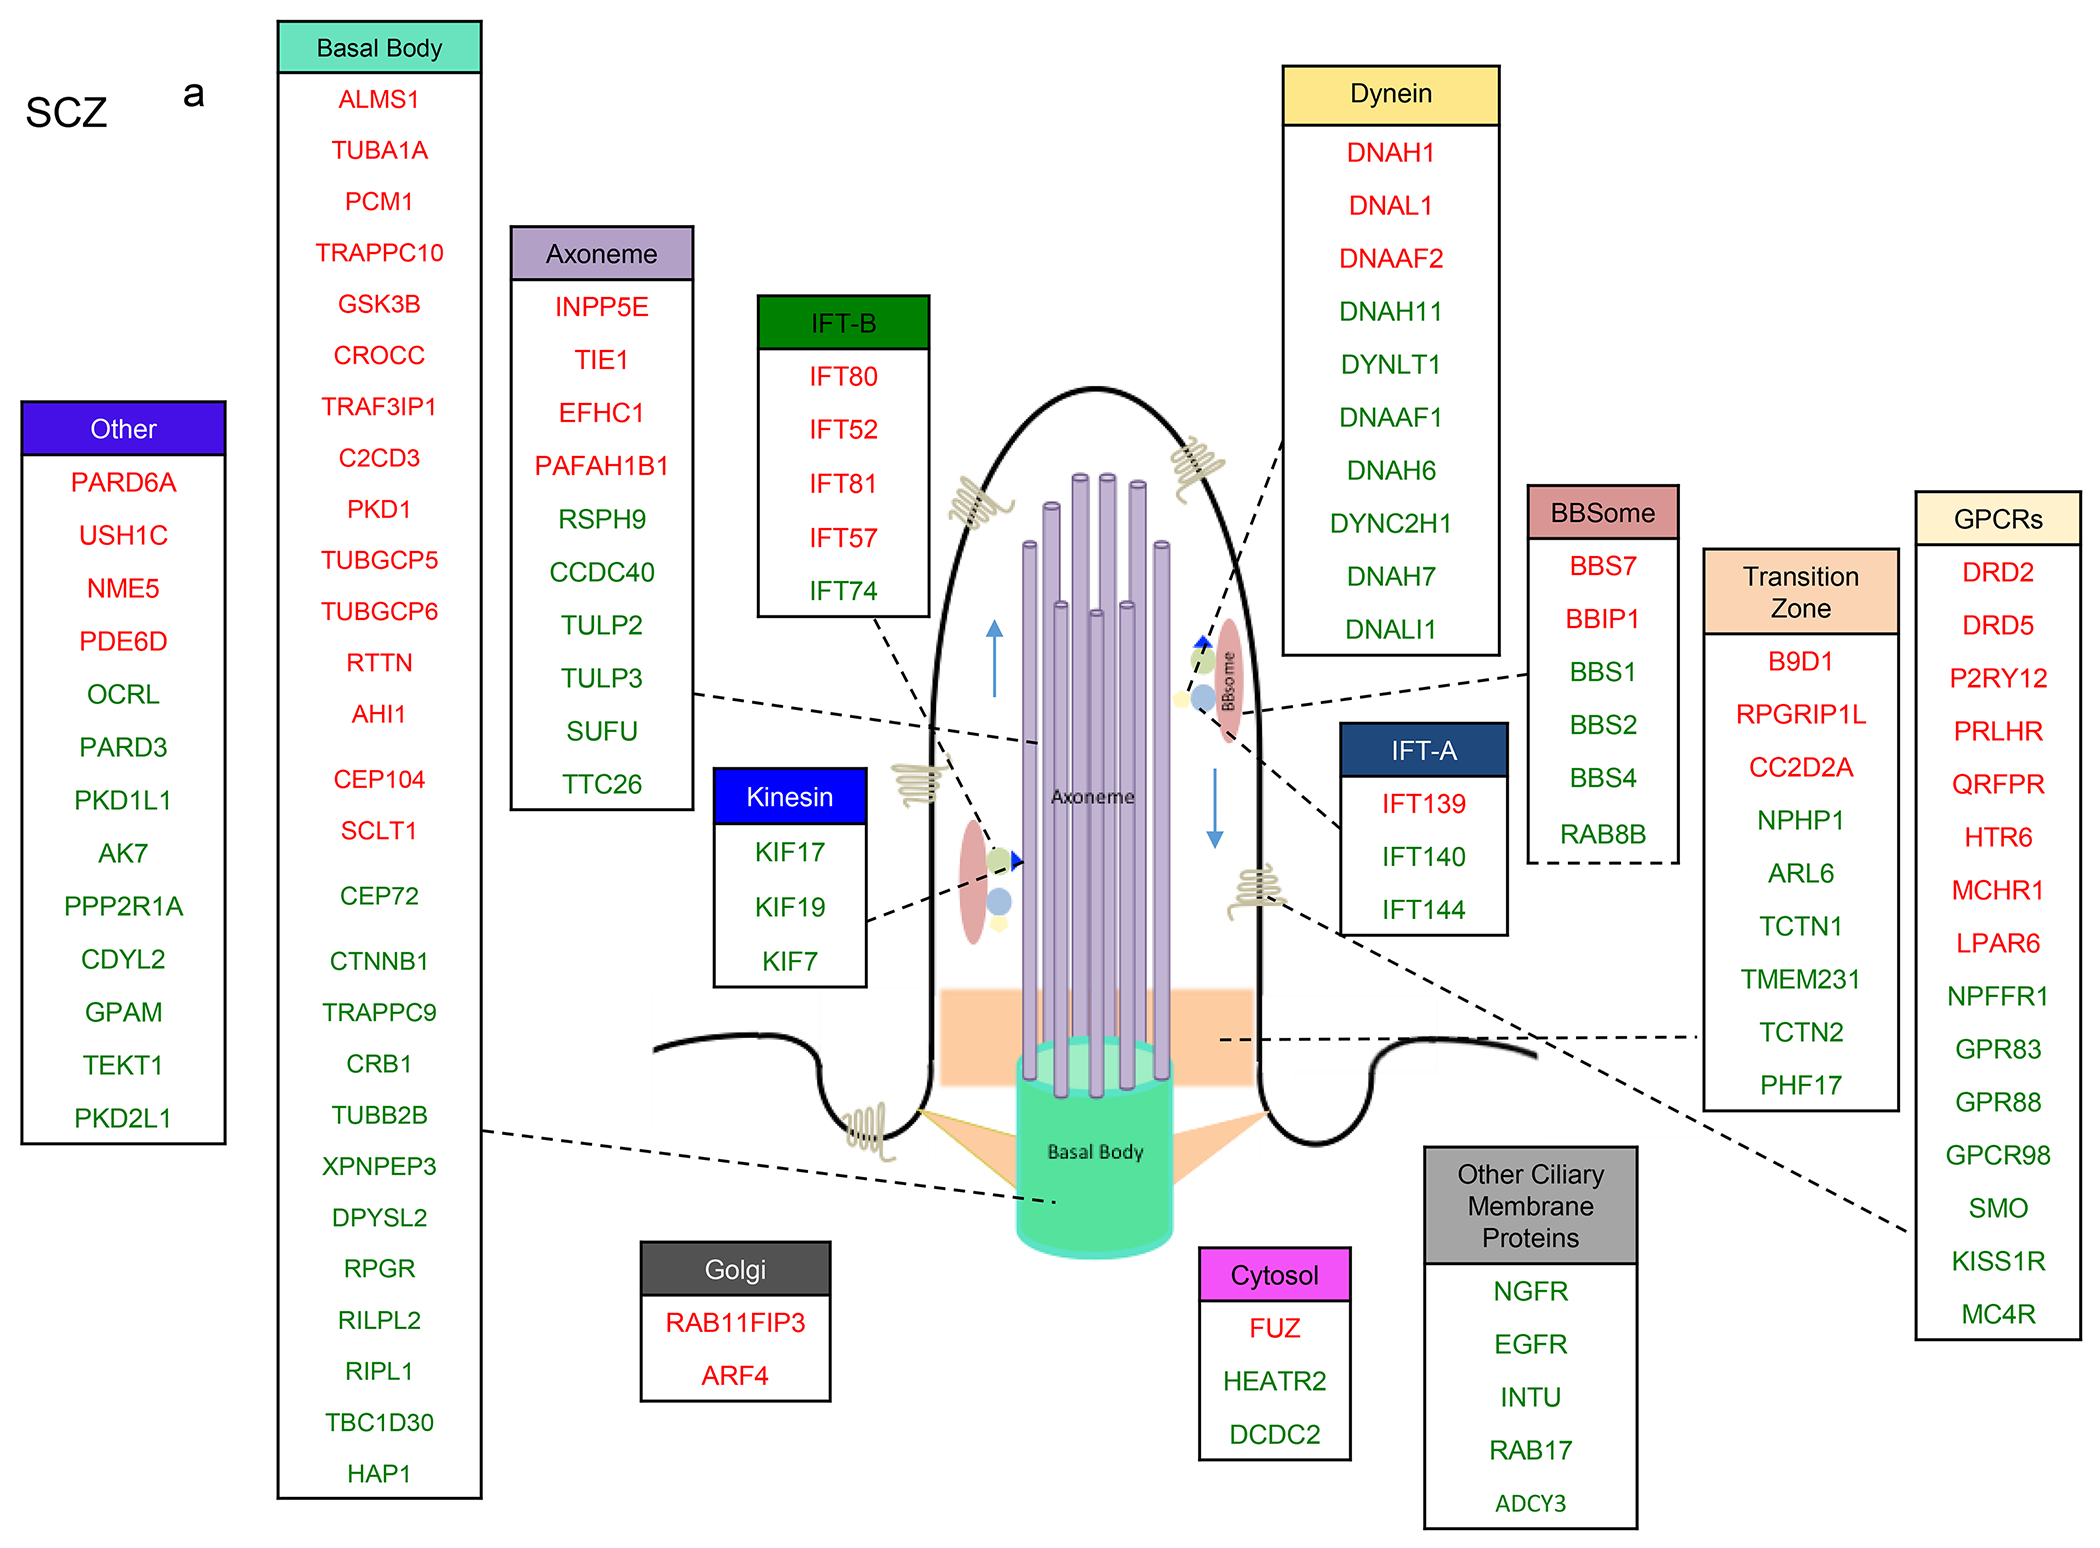
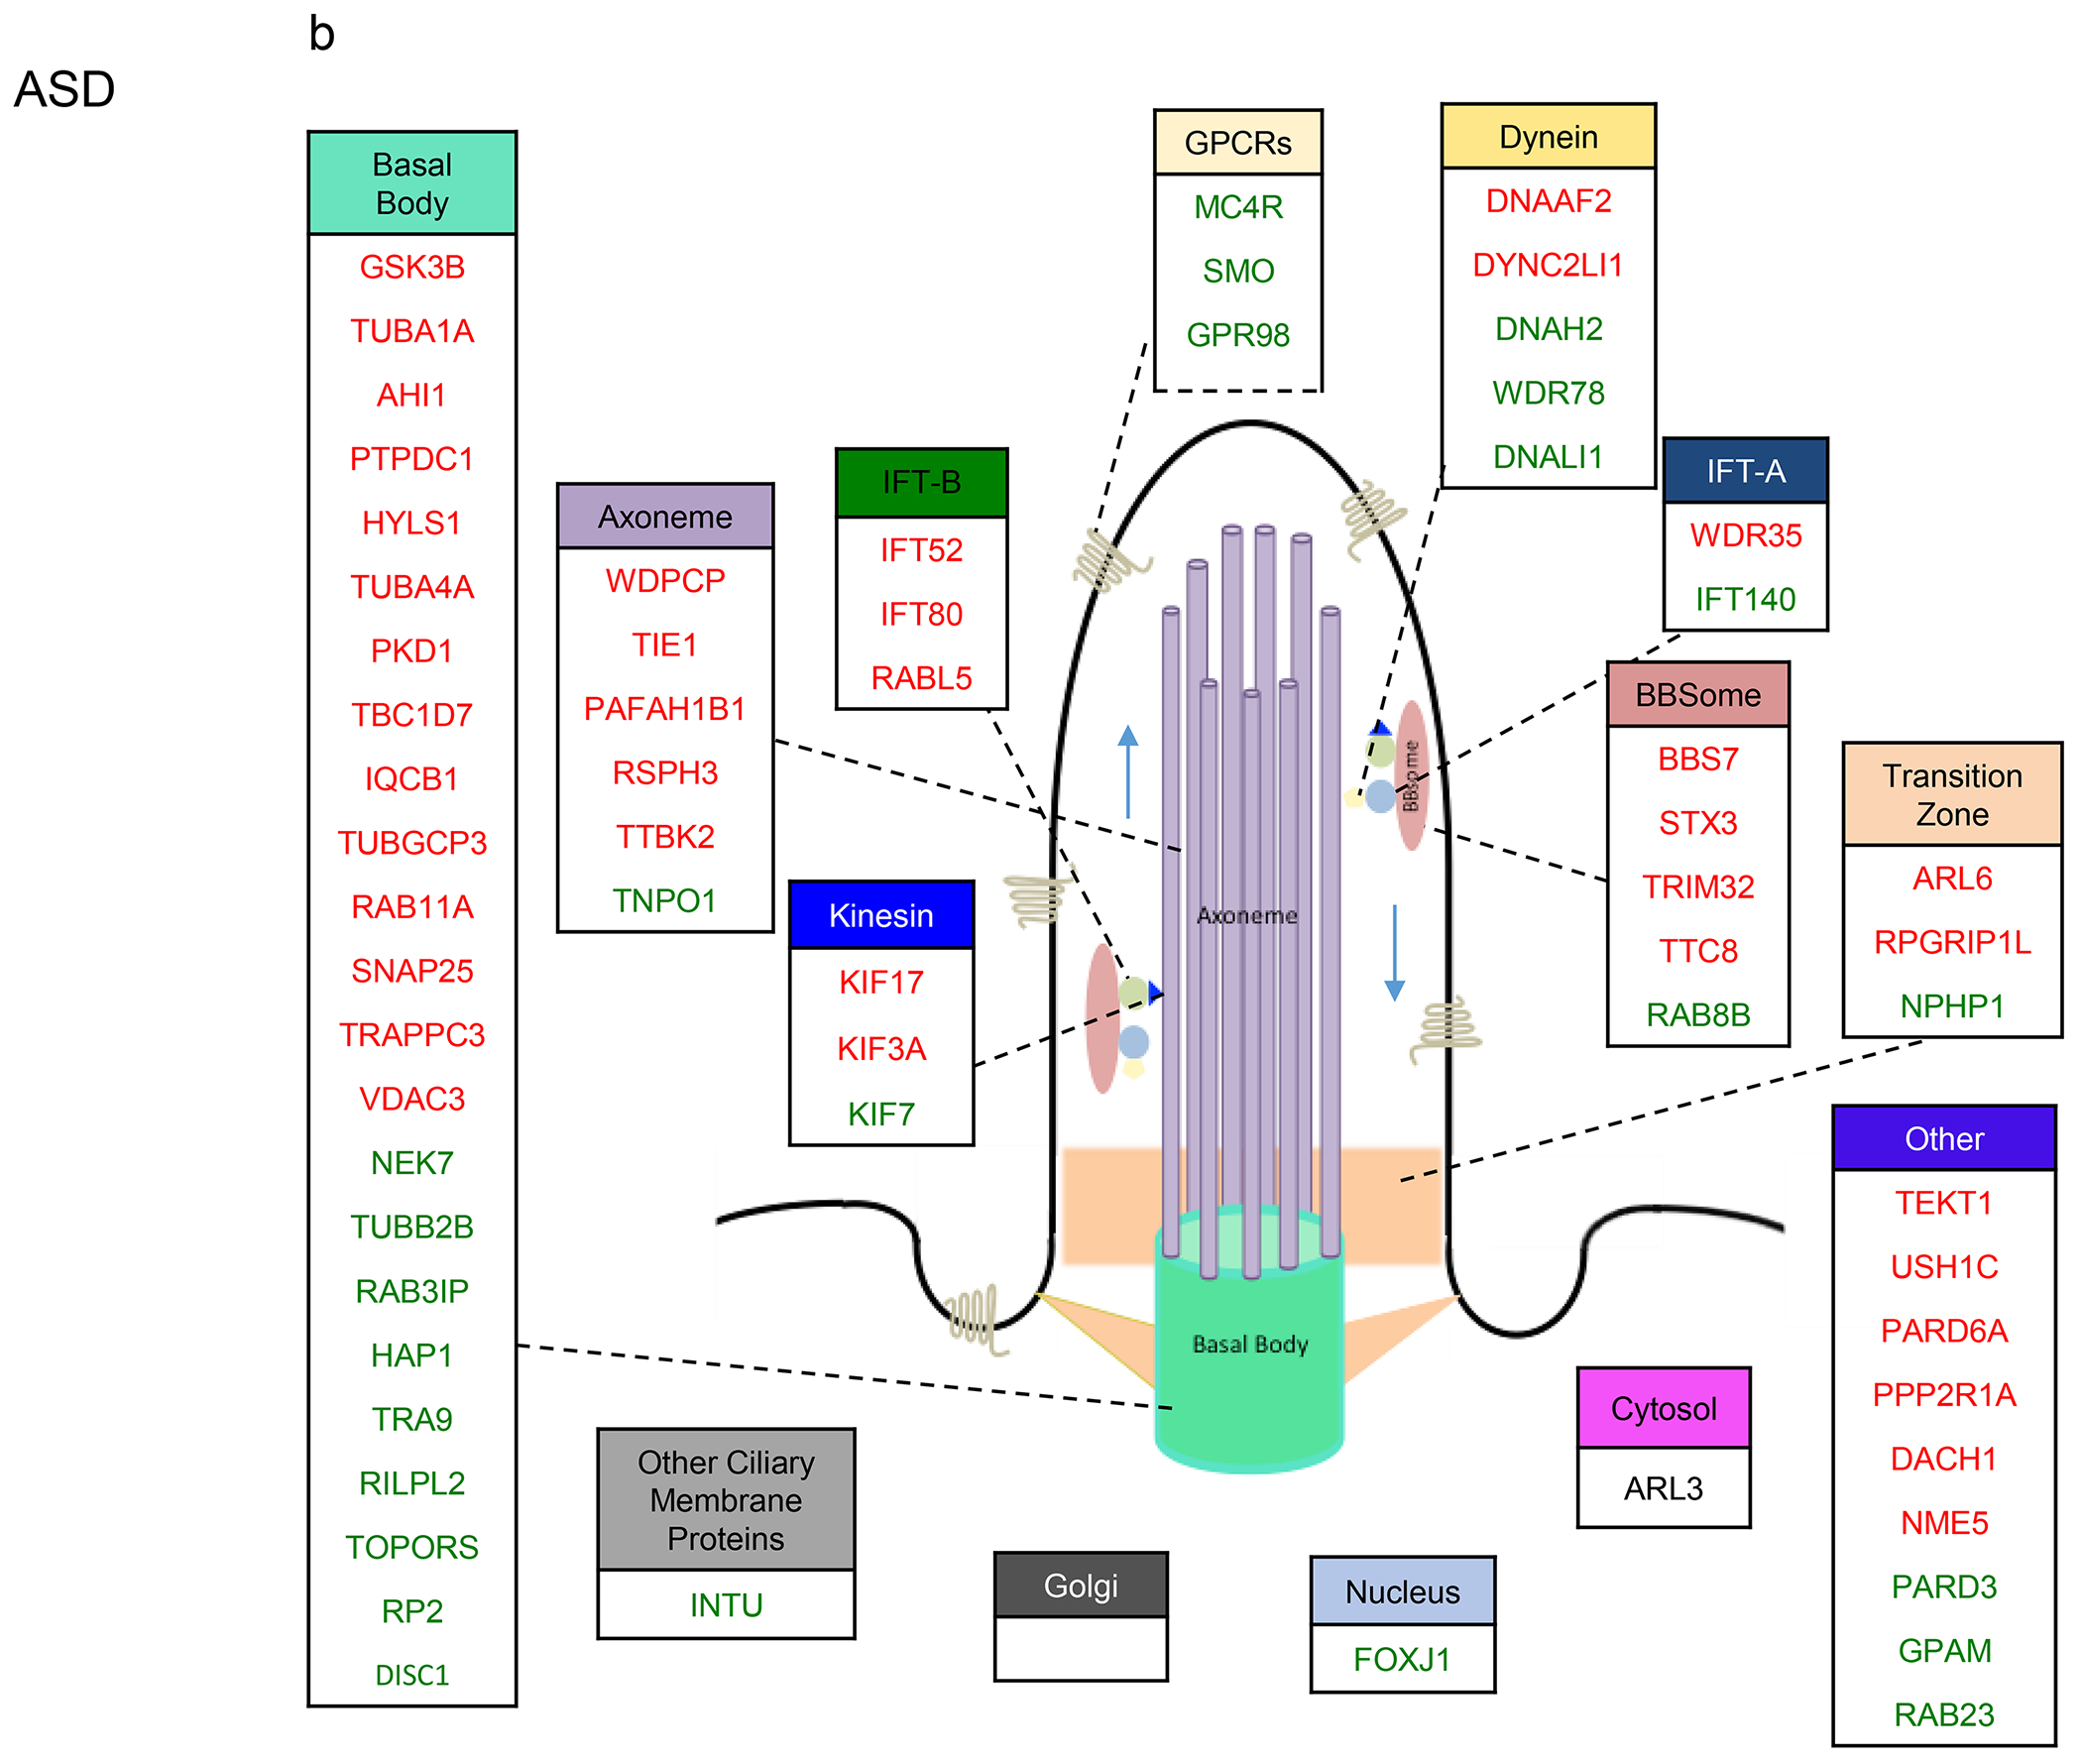
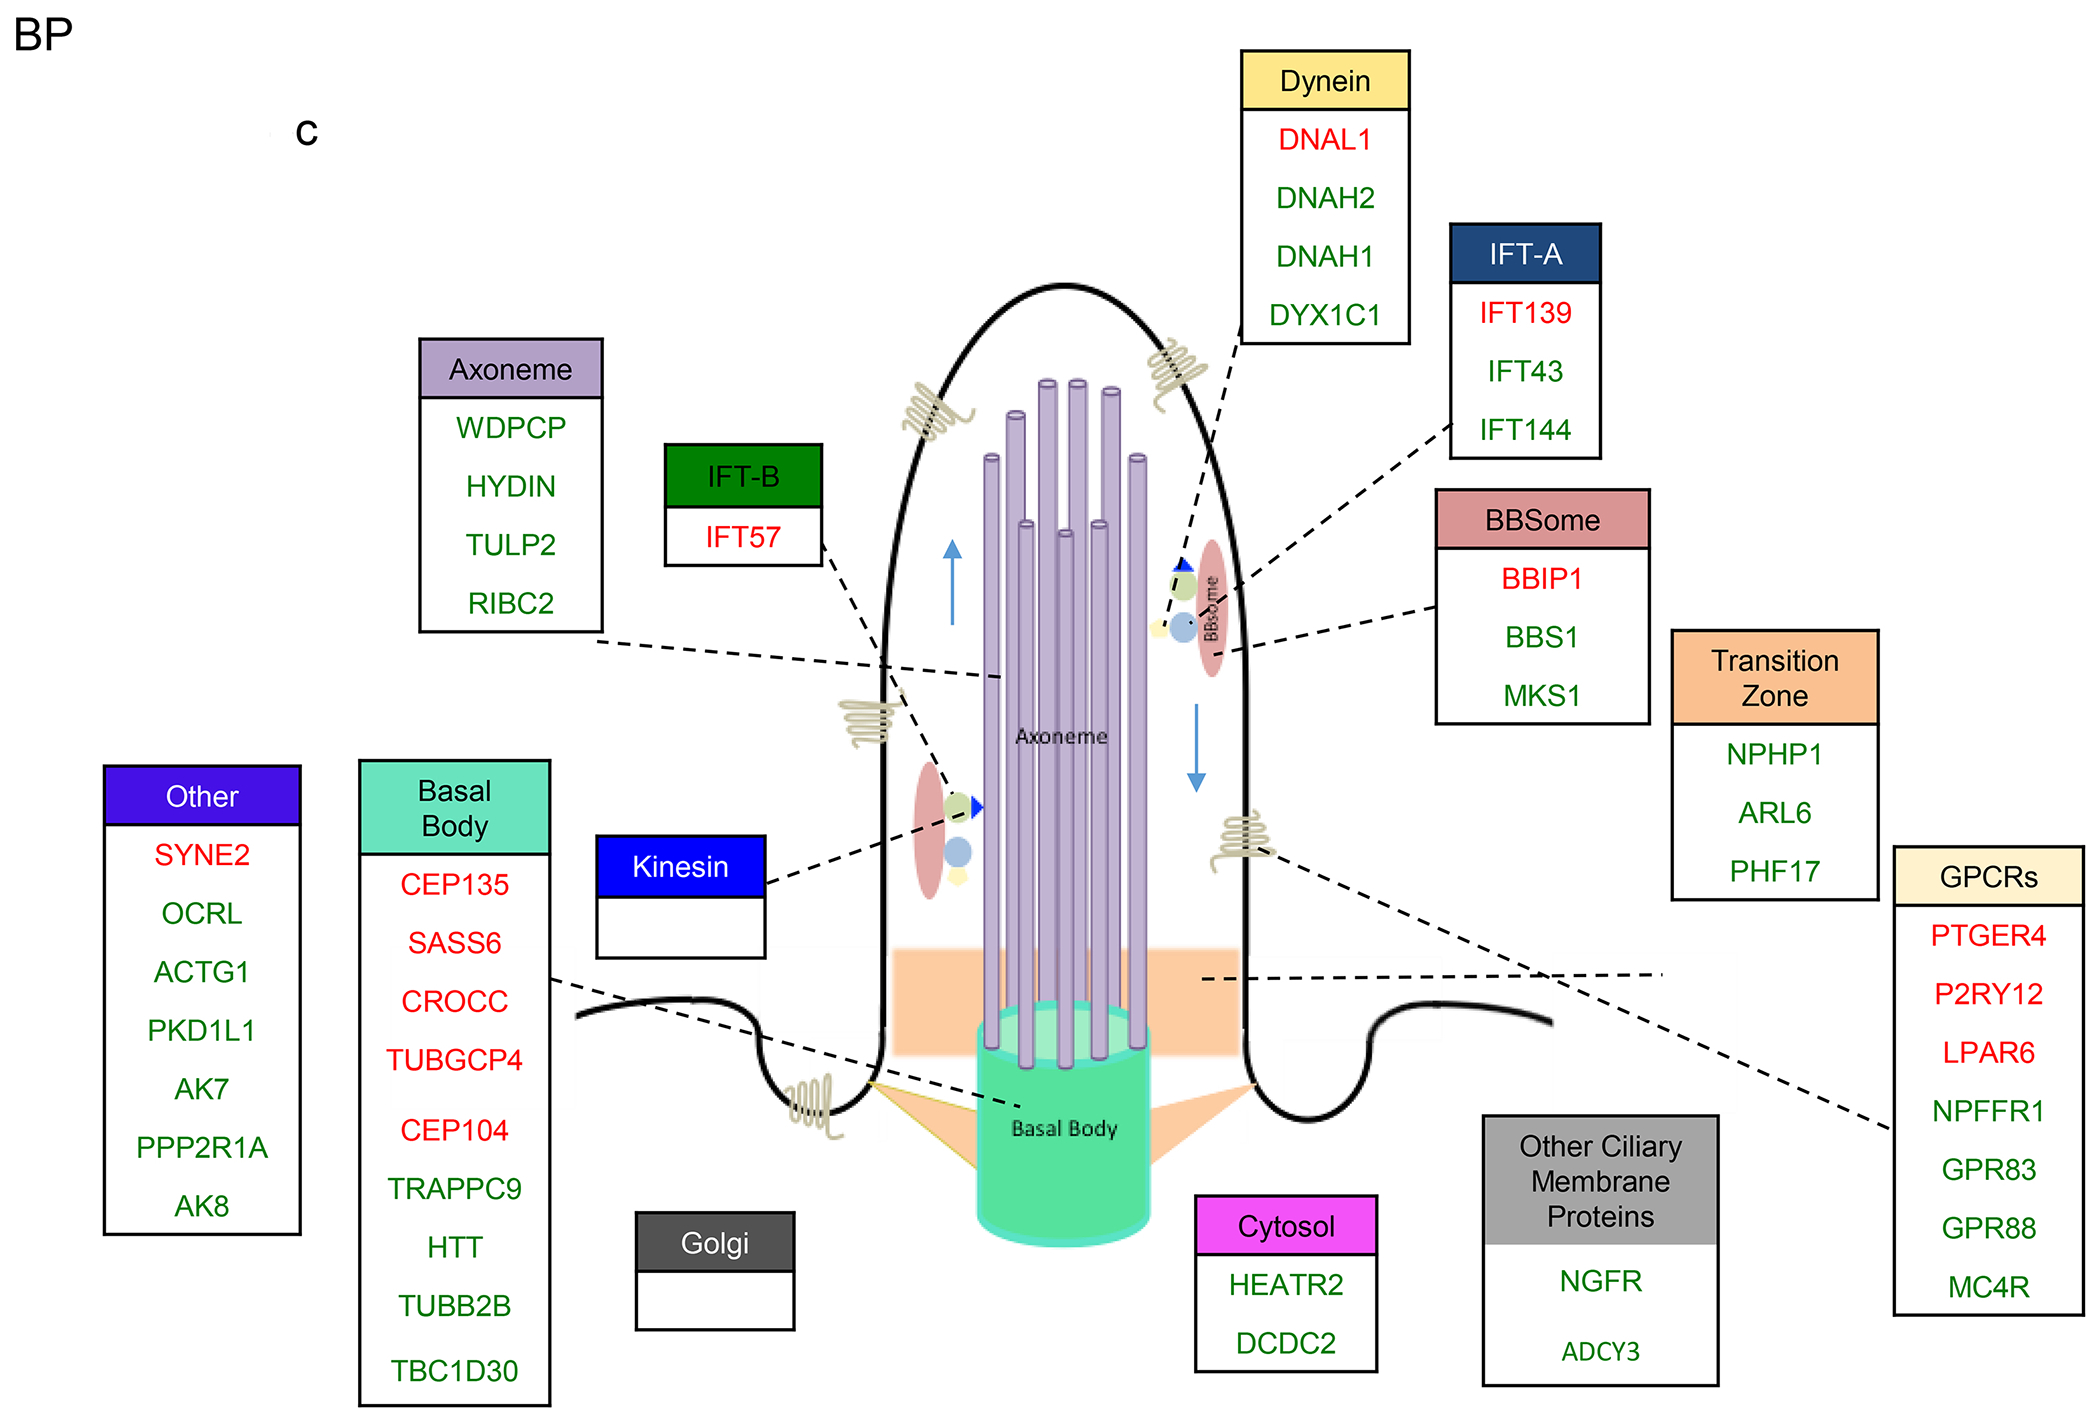
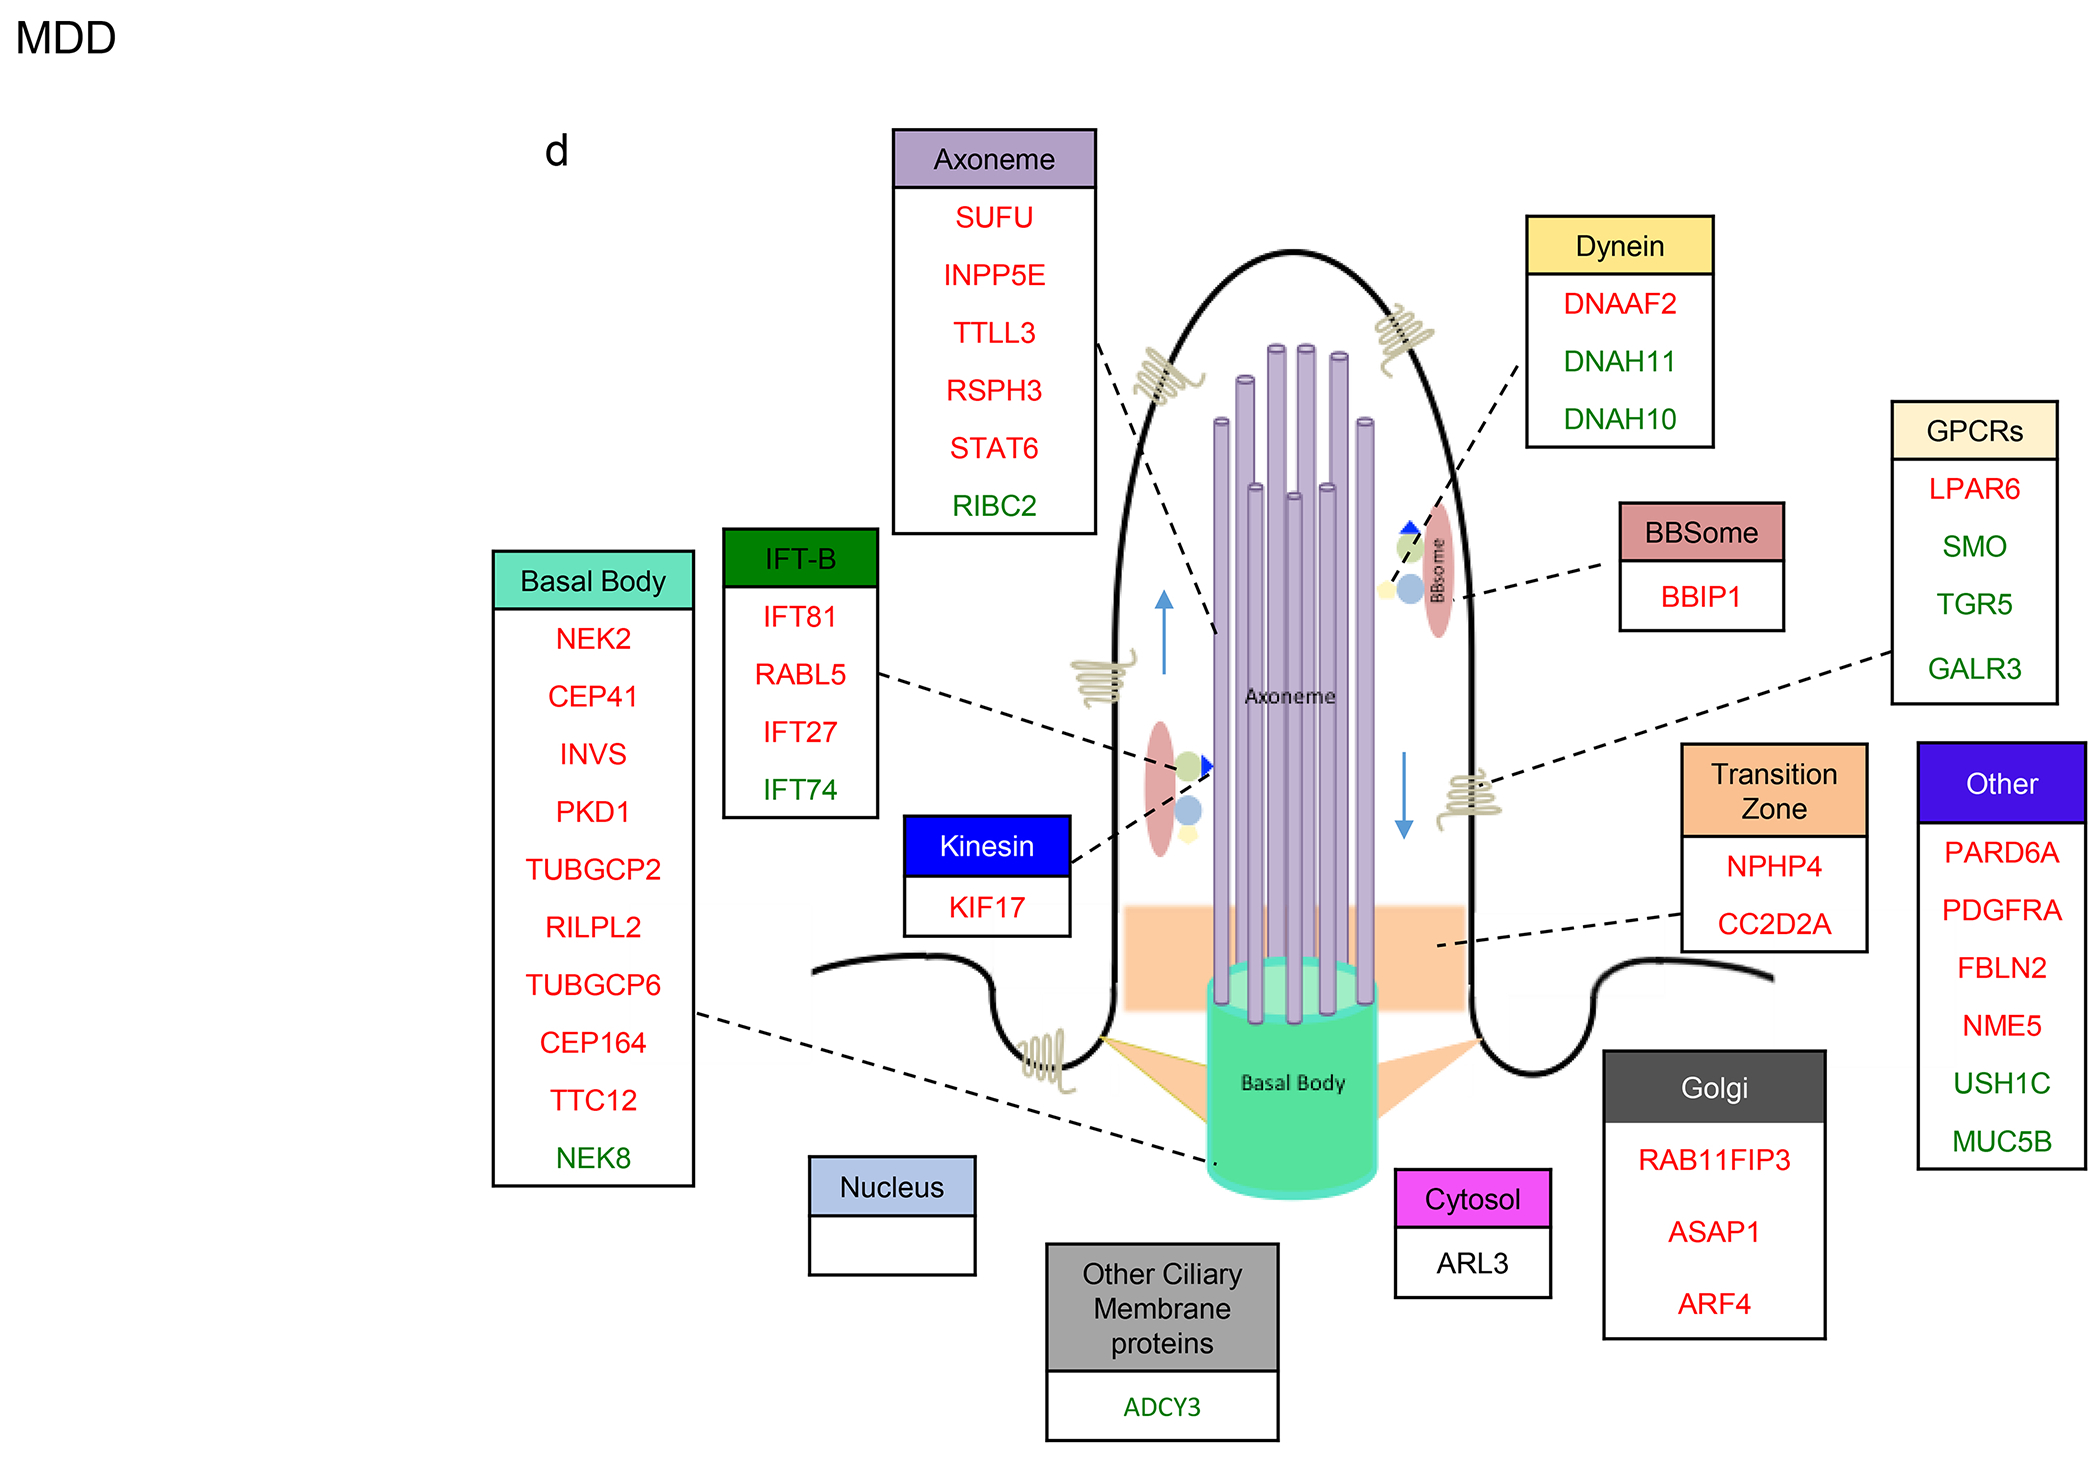
Primary cilia function as cells' antennas to detect and transduce external stimuli and play crucial roles in cell signaling and communication. The vast majority of cilia genes that are causally linked with ciliopathies are also associated with neurological deficits, such as cognitive impairments. Yet, the roles of cilia dysfunctions in the pathogenesis of psychiatric disorders have not been studied. Our aim is to identify patterns of cilia gene dysregulation in the four major psychiatric disorders: schizophrenia (SCZ), autism spectrum disorder (ASD), bipolar disorder (BP), and major depressive disorder (MDD). For this purpose, we acquired differentially expressed genes (DEGs) from the largest and most recent publicly available databases. We found that 42%, 24%, 17%, and 15% of brain-expressed cilia genes were significantly differentially expressed in SCZ, ASD, BP, and MDD, respectively. Several genes exhibited cross-disorder overlap, suggesting that typical cilia signaling pathways' dysfunctions determine susceptibility to more than one psychiatric disorder or may partially underlie their pathophysiology. Our study revealed that genes encoding proteins of almost all sub-cilia structural and functional compartments were dysregulated in the four psychiatric disorders. Strikingly, the genes of 75% of cilia GPCRs and 50% of the transition zone proteins were differentially expressed in SCZ. The present study is the first to draw associations between cilia and major psychiatric disorders, and is the first step toward understanding the role that cilia components play in their pathophysiological processes, which may lead to novel therapeutic targets for these disorders.

Keywords: Autism; Bipolar disorder; Cilia; Compartments; DEGs; Depression; Schizophrenia.


Conflict of interest statement

Competing interests

The authors declare no competing interests.

Figures

Figure 1.
Figure 1.. Identification of cilia gene expression across specific brain tissues in GTEx.
Heatmap of gene expressions of cilia genes in the GTEx brain tissues using median TPMs from the GTEx dataset. Columns denote brain regions and rows represent cilia genes. Genes are shown and categorized in median Transcripts Per Million (TPM).
Figure 2.
Figure 2.. Cilia differentially expressed genes in SCZ, ASD, BP, and MDD
a. Volcano plot showing DEGs (P <0.05). Scattered points represent cilia genes: the x axis is the fold change while the y axis is the -log p value. Green and red dots refer to upregulated and downregulated genes. Genes circled in blue represent GPCRs that localize to the cilium. b. Histogram showing the cilia genes and non-cilia genes that are differentially expressed in SCZ; Exact Fisher test OR = 1.681, P < 0.0001. c. Histogram showing cilia GPCR genes and non-cilia GPCR genes that are differentially expressed in SCZ; Exact Fisher test: OR: 6.873, P = 0.0001. d-f. Volcano plots of cilia DEGs in (d) ASD, (e) BP, and (f) MDD.
Figure 3.
Figure 3.. Cilia DEGs overlap across the four psychiatric disorders
a. Venn diagram conveying overlap between significant DEGs (P<0.05) within 4 psychiatric disorders, SCZ, ASD, BP, and MDD. b-d. Cilia DEGs genes overlapping between SCZ with (b) ASD, (c) BP, (d) and MDD. Genes that are differentially expressed in opposing directions are denoted with a box. GPCRs are identified by arrows. e-g. Overlap of DEG between two disorders: (e) ASD and BP, (f) ASD and MDD, (g) BP and MDD. h-j. Overlap of DEG among three disorders: (h) SCZ, ASD, and BP, (i) SCZ, ASD, and MDD, (j) SCZ, BP, MDD. The x axis shows Log2FC and along the y axis are the cilia genes. Genes that are differentially expressed in opposing directions are denoted with a box. GPCRs are identified by arrows.
Figure 4.
Figure 4.. Sub-cilia localization of the genes that exhibited variants association and/or differential gene expression in the four disorders.
a-d. Sub-cilia localization of genes that exhibited differential gene expression and/or genetic variants in (a) SCZ, (b) ASD, (c) BP, (d) MDD. Upregulated and downregulated DEGs are in green and red respectively.

References

    1. Fuchs JL, Schwark HD: Neuronal primary cilia: a review. Cell biology international 2004, 28(2):111–118. - PubMed
    1. Baudoin JP, Viou L, Launay PS, Luccardini C, Espeso Gil S, Kiyasova V, Irinopoulou T, Alvarez C, Rio JP, Boudier T et al. : Tangentially migrating neurons assemble a primary cilium that promotes their reorientation to the cortical plate. Neuron 2012, 76(6):1108–1122. - PubMed
    1. Gerdes JM, Davis EE, Katsanis N: The vertebrate primary cilium in development, homeostasis, and disease. Cell 2009, 137(1):32–45. - PMC - PubMed
    1. Louvi A, Grove EA: Cilia in the CNS: the quiet organelle claims center stage. Neuron 2011, 69(6):1046–1060. - PMC - PubMed
    1. Trulioff A, Ermakov A, Malashichev Y: Primary Cilia as a Possible Link between Left-Right Asymmetry and Neurodevelopmental Diseases. Genes 2017, 8(2). - PMC - PubMed

Publication types