. 2021 Apr 7;29(4):1487-1500.
doi: 10.1016/j.ymthe.2021.01.028. Epub 2021 Jan 26.

Therapeutic targeting of argininosuccinate synthase 1 (ASS1)-deficient pulmonary fibrosis

Affiliations

Therapeutic targeting of argininosuccinate synthase 1 (ASS1)-deficient pulmonary fibrosis

Ji-Min Li et al. Mol Ther. .

Abstract

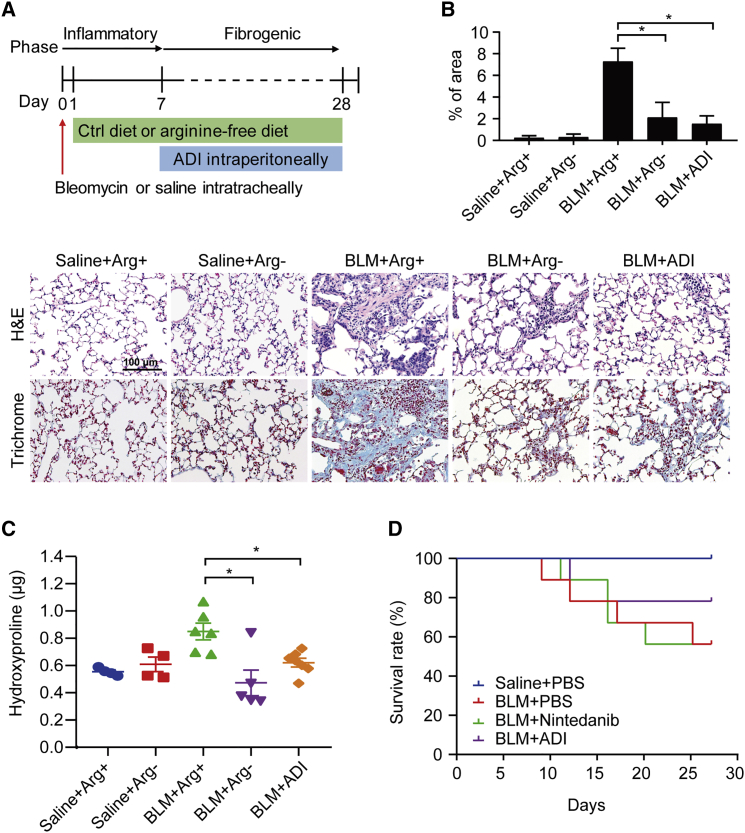
Argininosuccinate synthase 1 (ASS1) serves as a critical enzyme in arginine biosynthesis; however, its role in interstitial lung diseases, particularly idiopathic pulmonary fibrosis (IPF), remains largely unknown. This study aims at characterization and targeting of ASS1 deficiency in pulmonary fibrosis. We find that ASS1 was significantly decreased and inversely correlated with fibrotic status. Transcriptional downregulation of ASS1 was noted in fibroblastic foci of primary lung fibroblasts isolated from IPF patients. Genetic manipulations of ASS1 studies confirm that ASS1 expression inhibited fibroblast cell proliferation, migration, and invasion. We further show that the hepatocyte growth factor receptor (Met) receptor was activated and acted upstream of the Src-STAT3 axis signaling in ASS1-knockdown fibroblasts. Interestingly, both arginine-free conditions and arginine deiminase treatment were demonstrated to kill fibrotic fibroblasts, attenuated bleomycin-induced pulmonary fibrosis in mice, as well as synergistically increased nintedanib efficacy. Our data suggest ASS1 deficiency as a druggable target and also provide a unique therapeutic strategy against pulmonary fibrosis.

Keywords: ASS1; MET signaling; arginine; fibroblasts; pulmonary fibrosis.


Conflict of interest statement

The authors declare no competing interests.

Figures

None
Graphical abstract
Figure 1
Figure 1
Aberrant downregulation of ASS1 in IPF lung tissues and fibroblasts (A) Representative images of immunohistochemical staining using anti-ASS1 antibody in normal lung tissue (top left panel, n = 30) and IPF specimens from patients (bottom left panel, n = 14). IPF-2 (middle panel) and IPF-10 (right panel) are representative patients. Higher magnification images of boxed areas are shown below. (B) Percentage of patients with high and low levels of ASS1 expression corresponding to normal and IPF. Numbers in bars represent the percentage of patients for each condition. ∗p < 0.05. (C) Representative images of immunofluorescent staining of ASS1 (red color) and α-SMA (green color) in normal lung tissues and IPF specimens from patients. DAPI (blue color) is indicated as the nucleus. (D) Expression of ASS1 mRNA in primary normal fibroblasts and primary IPF fibroblast cells, as measured by qRT-PCR (n = 4; ∗p < 0.05 versus normal). (E) Immunoblotting analysis of ASS1 expression in 4 human primary normal fibroblasts (normal-1, -2, -3, and -4) and 7 fibroblast cells isolated from IPF and PF patients (IPF-1, -2, -3, -4, and -5 and PF-1 and -2). ASS1 expression was quantified using ImageJ software (n = 5; ∗p < 0.05 versus normal-1). (F) The levels of ASS1 were examined using immunohistochemical staining in lung tissue specimens from saline- and bleomycin (BLM)-exposed mice. Arrows, fibroblast cells. Numbers, the percentage of ASS1-positive fibroblast cells was quantified by ImageJ software. Data are expressed as mean ± SE. ∗p < 0.05. (G) Representative images from immunofluorescent staining with anti-ASS1 antibody (red color) and anti-α-SMA antibody (green color) in lung tissues of mice exposed to either saline or BLM. DAPI (blue color) is represented as the nucleus.
Figure 2
Figure 2
Functional roles of ASS1 in fibrotic lung fibroblasts (A) The invasion ability of human primary normal fibroblasts and primary IPF fibroblasts, as determined using Matrigel invasion assay. The numbers of invaded cells were counted, and the quantified values of relative invasion ability were normalized to normal-4. ∗p < 0.05 versus normal (mean ± SE). (B) The lung fibrosis model by an intrapulmonary implantation of primary normal lung fibroblast cells or primary IPF lung fibroblasts. Collagen assessment by Masson’s trichrome staining of lungs in tissue specimens from normal or IPF fibroblast-inoculated lungs. Numbers, the fibrosis scores from semiquantitative analysis in Masson’s trichrome-stained sections of mouse lung. Fibrosis score is displayed as the percentage of the positive-staining area per high-powered field. 6−12 high-powered fields per lung were analyzed and quantified with ImageJ software. ∗p < 0.05 versus normal-1. (C) Control siRNAs (siControl)- or ASS1-specific siRNAs (siASS1)-transfected normal fibroblast cells (normal-2 and -3) were subjected to BrdU cell proliferation assays. The cell proliferation rate was determined at 24 h and 48 h. Data are represented as mean ± SE. ∗p < 0.05. (D and E) Transwell migration and invasion assays of normal fibroblast cells (normal-1 and -3) transfected with control siRNAs or ASS1-specific siRNAs. The cell migration and invasion ability of ASS1-knockdown cells were normalized to that of cells transfected with control siRNAs. ∗p < 0.05 versus siControl (mean ± SE). (F) BrdU cell proliferation assays of IPF lung fibroblasts (IPF-5 and LL97A) transfected with pCMV6 or pCMV6-ASS1. The cell proliferation rate was examined at 24 h and 48 h. Data are represented as mean ± SE. ∗p < 0.05. (G and H) pCMV6- or pCMV6-ASS1-transfected IPF lung fibroblasts (IPF-5 and LL97A) were subjected to Transwell migration and invasion assays. The cell migration and invasion ability were quantified and normalized to that of mock transfectants. Data are expressed as mean ± SE. ∗p < 0.05.
Figure 3
Figure 3
Activation of Met receptor and its downstream signaling in response to ASS1 loss (A) DAVID pathway enrichment analysis of the reverse-phase protein array (RPPA) profiles revealed significantly enriched signaling pathways in ASS1-knockdown normal fibroblast cells. The horizontal axis describes the log(1/p value) of the significant pathways. The vertical axis represents the protein clusters involved in the DAVID pathways. (B) Heatmap analysis from RPPA data showing the relative level of total and phosphorylated proteins in normal fibroblast cells with ASS1 knockdown as compared to cells transfected with control siRNAs. Red shades indicate higher intensity, and blue shades represent lower intensity. Data are significant changes as determined by a p value threshold of less than 0.05. (C) Left: lysates from primary normal (normal-1) and IPF fibroblasts (IPF-4), as well as siControl-transfected and siASS1-transfected normal fibroblast cells (normal-3) were subjected to human phospho-receptor tyrosine kinase (RTK) array assays. Right: the top four phospho-RTKs in IPF lung fibroblasts and ASS1-knockdown cells are listed. (IPF-4 versus normal-1 and ASS1 siRNA versus control siRNA). (D) Immunoblotting analysis of phospho-Met (Y1349) levels and its downstream molecules Src and STAT3 in two ASS1-knockout normal fibroblast cells (normal-2 and -3). (E) Representative images of immunohistochemical staining using anti-phospho-Met (Y1349) antibody in normal lung tissue and IPF specimens from patients (n = 3,) as well as lung tissues from saline- and BLM-exposed mice (n = 3). Numbers, the percentage of phospho-Met (Y1349)-positive fibroblast cells was quantified by ImageJ software. Data are expressed as mean ± SE. ∗p < 0.05.
Figure 4
Figure 4
Susceptibility of fibrotic lung fibroblasts to arginine deprivation (A) Normal (normal-2, -4, and -5) and IPF (IPF-4, -5, and -7) fibroblast cells were incubated in arginine-containing and arginine-free medium for 5 days. After 3 days of incubation, cell proliferation was measured by MTS assay at 0 h (day 3), 24 h (day 4), and 48 h (day 5) and shown as a value relative to 0 h (day 3). Data are represented as mean ± SE from three independent experiments. (∗p < 0.05 versus arginine-containing medium). (B) Normal (normal-2) and IPF (IPF-4 and -5) fibroblast cells were treated with 0, 0.25, 0.5, 1, and 2 μg/mL of arginine deiminase (ADI) for 48 h (IPF-4) or 72 h (IPF-5). Cell viability was determined by MTT assay. Data are derived from three independent experiments and expressed as mean ± SE. ∗p < 0.05. (C) Effect of ADI on cell viability of lung fibroblasts isolated from saline (mFb-saline)- or BLM (mFb-BLM)-treated mice analyzed using MTT assays (n = 3; ∗p < 0.05).
Figure 5
Figure 5
The therapeutic potential of arginine deprivation in halting lung fibrosis (A) Top: experimental timeline in BLM-induced pulmonary fibrosis with or without arginine diet and ADI treatment (n = 8 mice/group). After C57BL/6J mice intratracheally received saline or BLM (0.005 U/g), the mouse diet was replaced with isonitrogenous control diet or arginine-free diet on the next day. At day 7, the BLM-exposed mice were intraperitoneally given ADI at a dosage of 225 μg/mL every day. At day 28, mice were euthanized, followed by lung harvest. Bottom: representative photomicrographs of hematoxylin and eosin (H&E)- and Masson’s trichrome-stained lung sections with various treatments. (B) Semiquantitative histopathological scoring of positive staining on Masson’s trichrome-stained sections of mouse lung. Fibrosis score is determined as the percentage of the positive staining area per high-powered field. Quantification of 6−12 high-powered fields per lung was performed with ImageJ software. *p < 0.05. (C) Hydroxyproline levels in the right lung of mice were determined by the hydroxyproline ELISA assay. Data are expressed as mean ± SE (∗p < 0.05 versus BLM + arginine-containing diet). (D) Saline- and BLM-exposed mice were grouped into PBS, nintedanib, or ADI treatment, and their overall survival rates of mice were analyzed by a Kaplan-Meier survival plot (n = 8 mice/group).
Figure 6
Figure 6
The effect of arginine deprivation in increasing nintedanib efficacy (A) IPF (IPF-4, -6, and -8) fibroblast cells were treated with 10 μM of nintedanib in arginine-containing and arginine-free medium for 72 h. Cell viability was assessed by MTT assays. Data are expressed from three independent experiments (∗p < 0.05 versus arginine-containing medium + nintedanib). (B) The combination index (CI) method was utilized to analyze the therapeutic effects of drug interactions between nintedanib and ADI using the CalcuSyn software. CI defines synergism (CI < 1), additive effect (CI = 1), and antagonism (CI > 1). Additive effect of the combination treatment is indicated by a black line at CI = 1. (C) IPF fibroblasts were treated with 4 μM of nintedanib alone, 4 μg/mL of ADI, or combinations of nintedanib at 4 μM and ADI at 4 μg/mL for 72 h. The cell viability was measured by MTT assays. Data are derived from three independent experiments and expressed as mean ± SE (∗p < 0.05 compared with nintedanib). (D) Experimental timeline for BLM-induced pulmonary fibrosis in mice treated with PBS, nintedanib, ADI, or nintedanib plus ADI (n = 4 mice/group). C57BL/6J mice intratracheally received BLM (0.005 U/g). At day 7, the BLM-exposed mice were intraperitoneally given PBS (BLM + PBS), ADI only (BLM + ADI), nintedanib only (BLM + nintedanib), and nintedanib plus ADI (BLM + nintedanib + ADI). At day 28, mice were euthanized followed by collection of lungs for further analysis. (E) Representative photomicrographs of H&E-stained and Masson’s trichrome-stained lung sections with various treatments. (F) Levels of hydroxyproline in the right lungs of mice were measured by a hydroxyproline ELISA assay. Data are expressed as mean ± SE.

Comment in

Similar articles

Cited by

References

    1. Ley B., Collard H.R., King T.E., Jr. Clinical course and prediction of survival in idiopathic pulmonary fibrosis. Am. J. Respir. Crit. Care Med. 2011;183:431–440. - PubMed
    1. Martinez F.J., Collard H.R., Pardo A., Raghu G., Richeldi L., Selman M., Swigris J.J., Taniguchi H., Wells A.U. Idiopathic pulmonary fibrosis. Nat. Rev. Dis. Primers. 2017;3:17074. - PubMed
    1. Nalysnyk L., Cid-Ruzafa J., Rotella P., Esser D. Incidence and prevalence of idiopathic pulmonary fibrosis: review of the literature. Eur. Respir. Rev. 2012;21:355–361. - PMC - PubMed
    1. Myllärniemi M., Kaarteenaho R. Pharmacological treatment of idiopathic pulmonary fibrosis - preclinical and clinical studies of pirfenidone, nintedanib, and N-acetylcysteine. Eur. Clin. Respir. J. 2015;2 doi: 10.3402/ecrj.v2.26385. - DOI - PMC - PubMed
    1. Wollin L., Wex E., Pautsch A., Schnapp G., Hostettler K.E., Stowasser S., Kolb M. Mode of action of nintedanib in the treatment of idiopathic pulmonary fibrosis. Eur. Respir. J. 2015;45:1434–1445. - PMC - PubMed

Publication types

MeSH terms