. 2021 Apr;592(7853):272-276.
doi: 10.1038/s41586-021-03273-0. Epub 2021 Jan 28.

Cell competition constitutes a barrier for interspecies chimerism

Affiliations

Cell competition constitutes a barrier for interspecies chimerism

Canbin Zheng et al. Nature. 2021 Apr.

Abstract

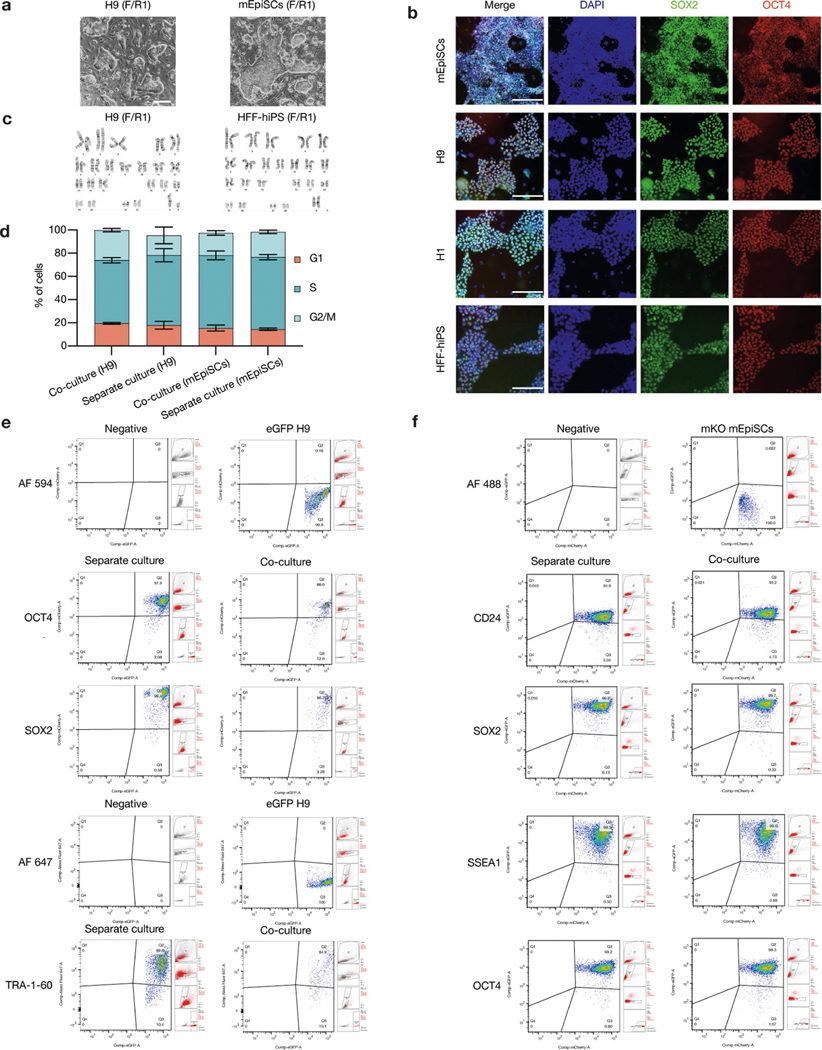
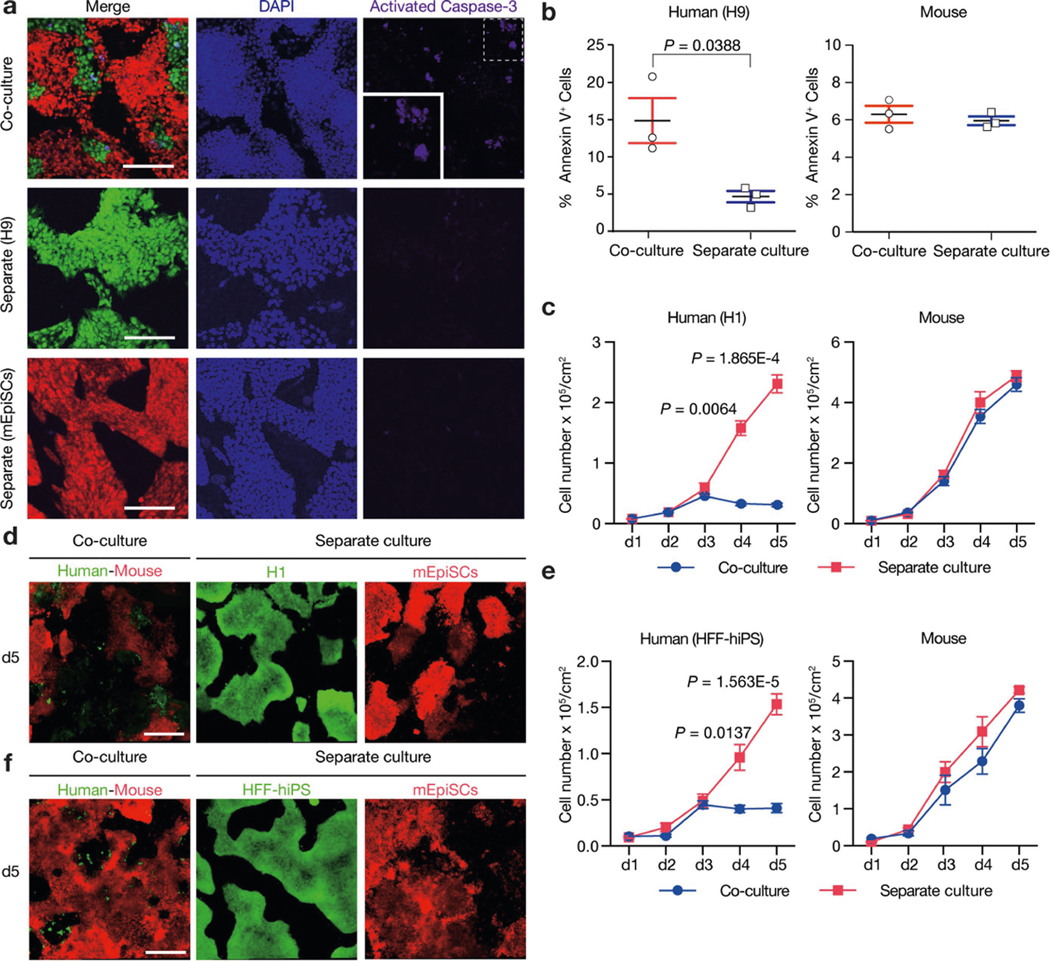
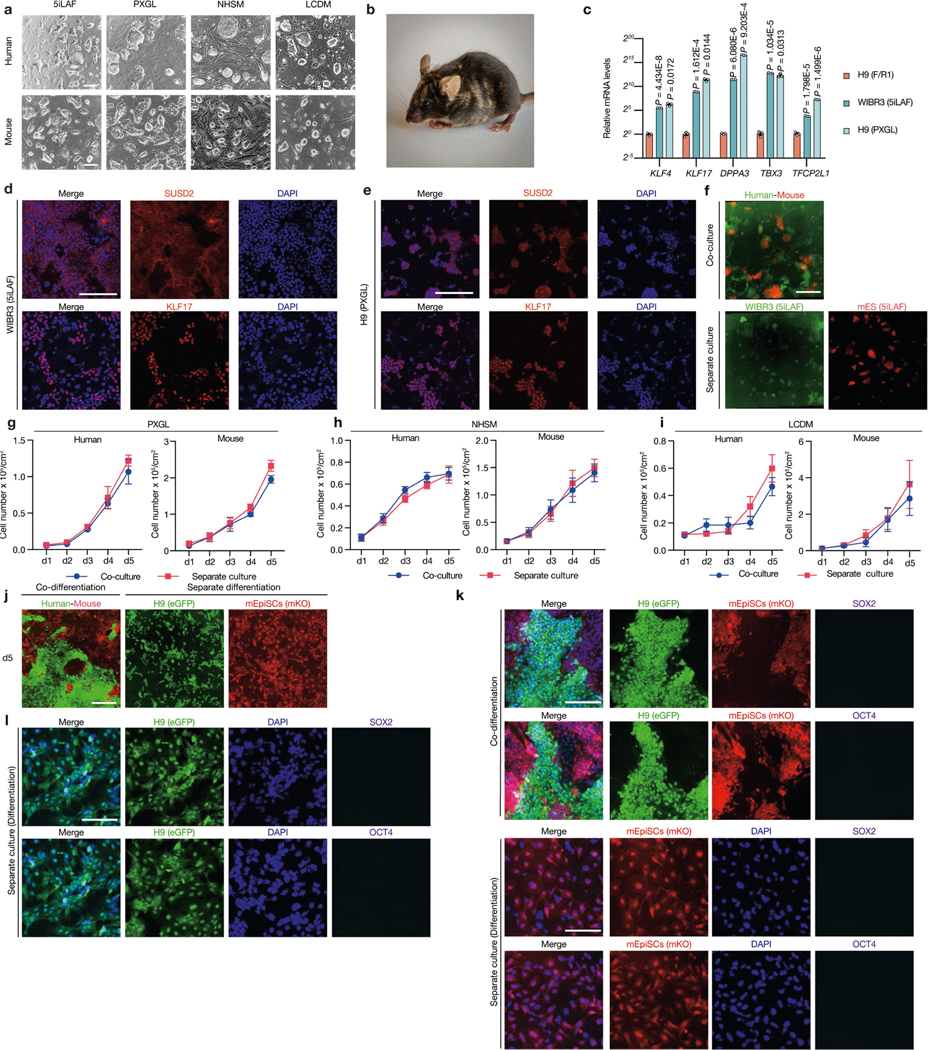
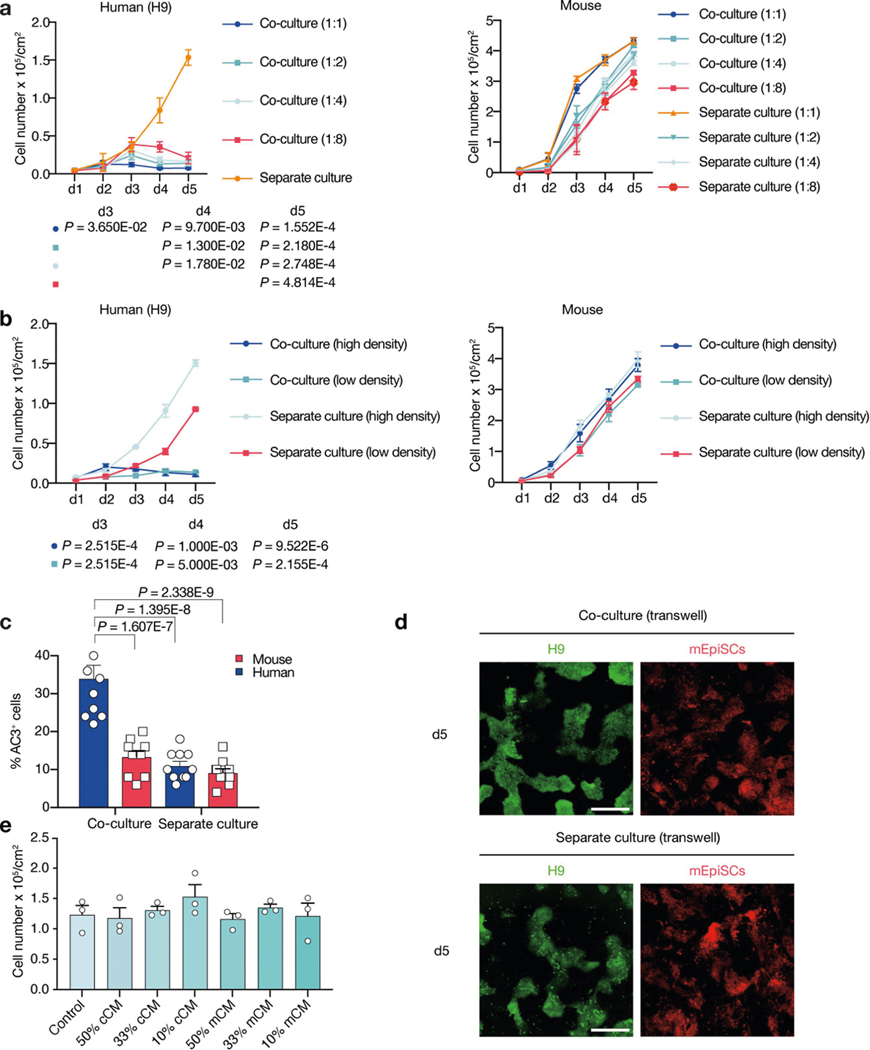
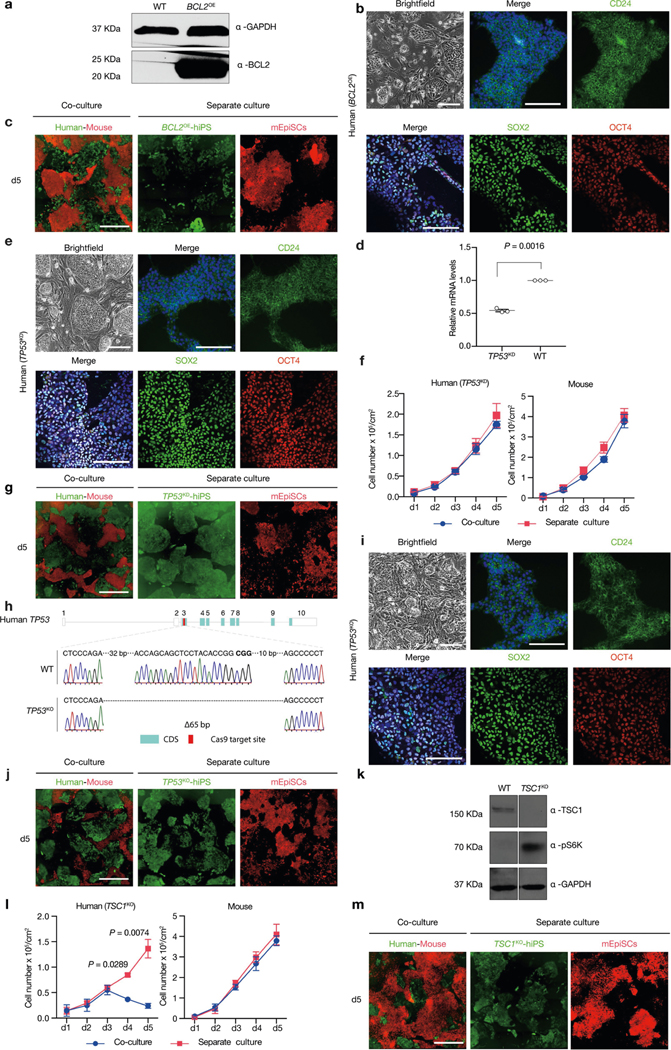
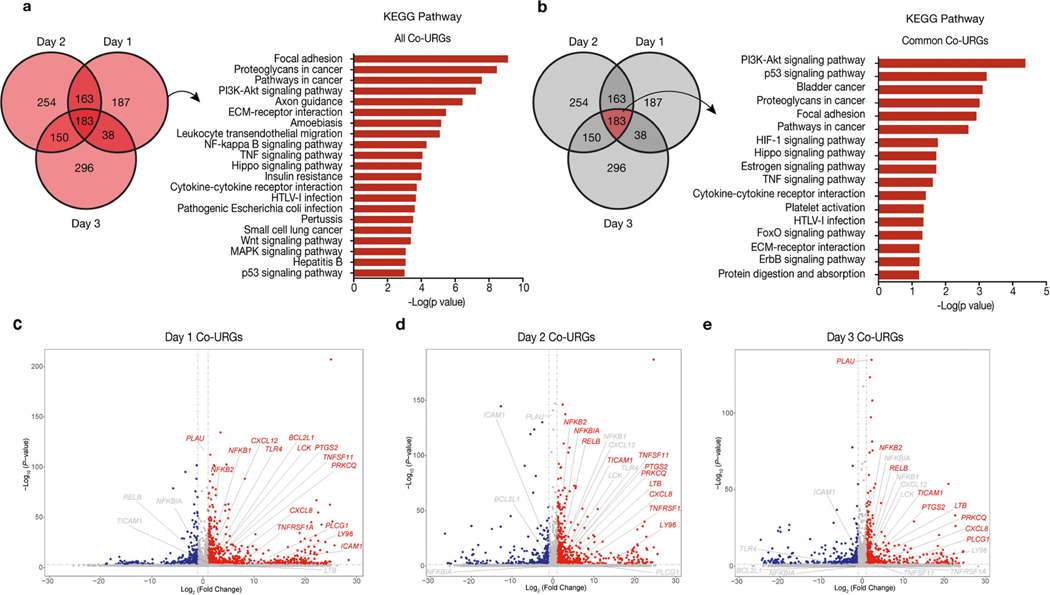
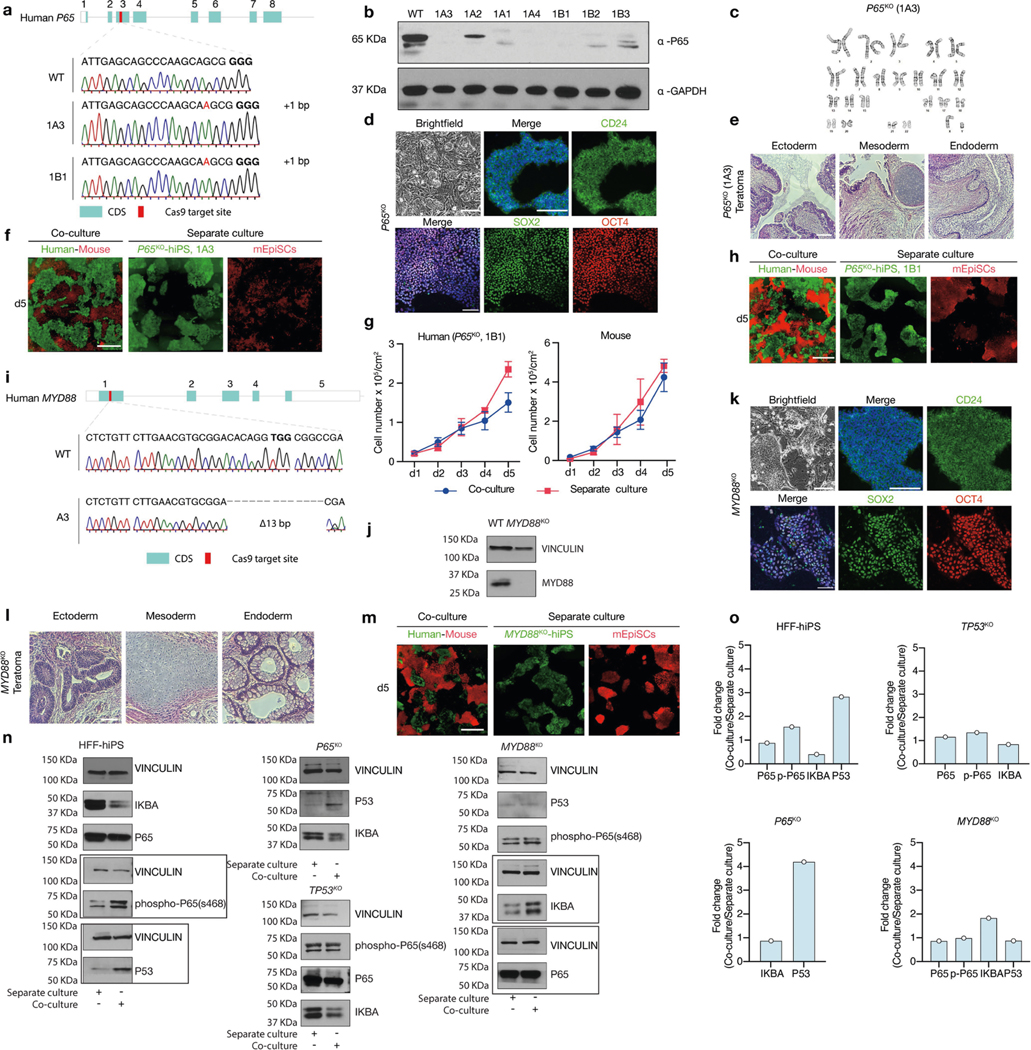
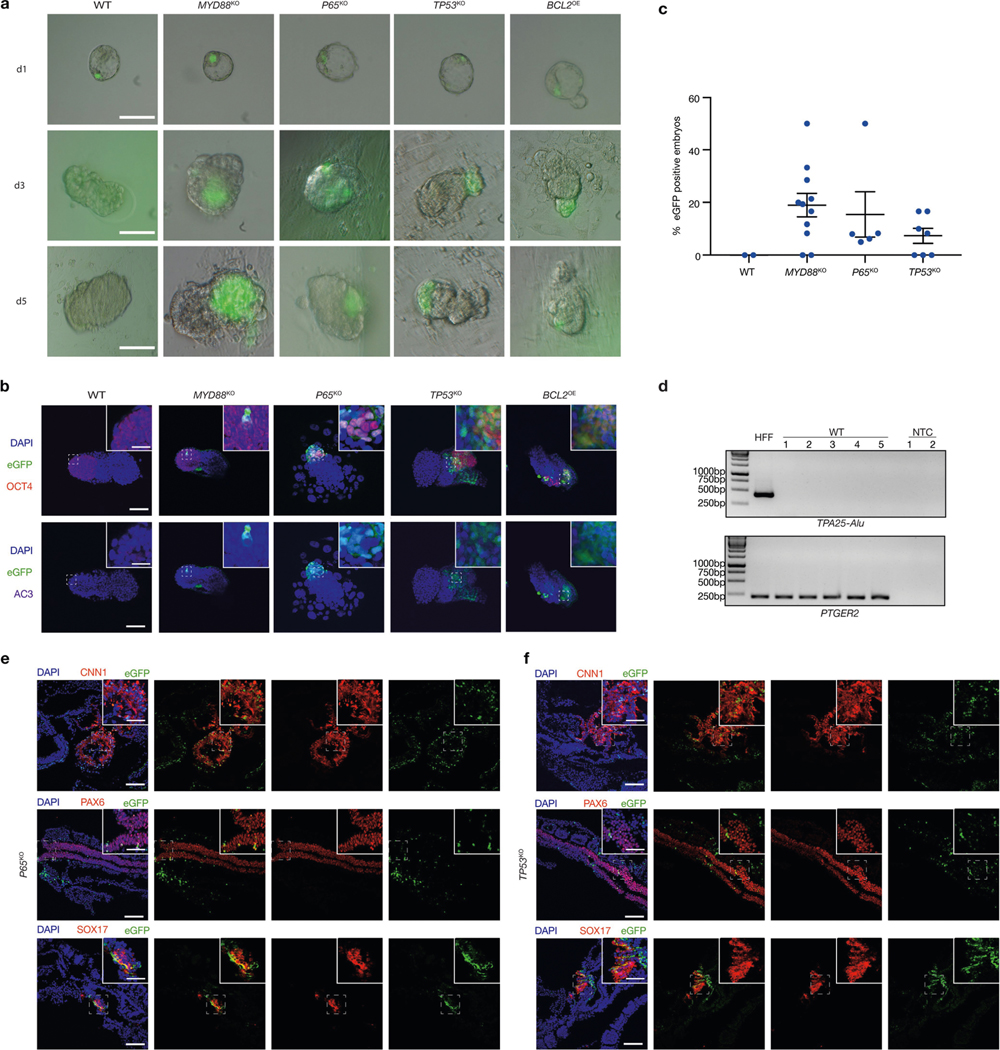
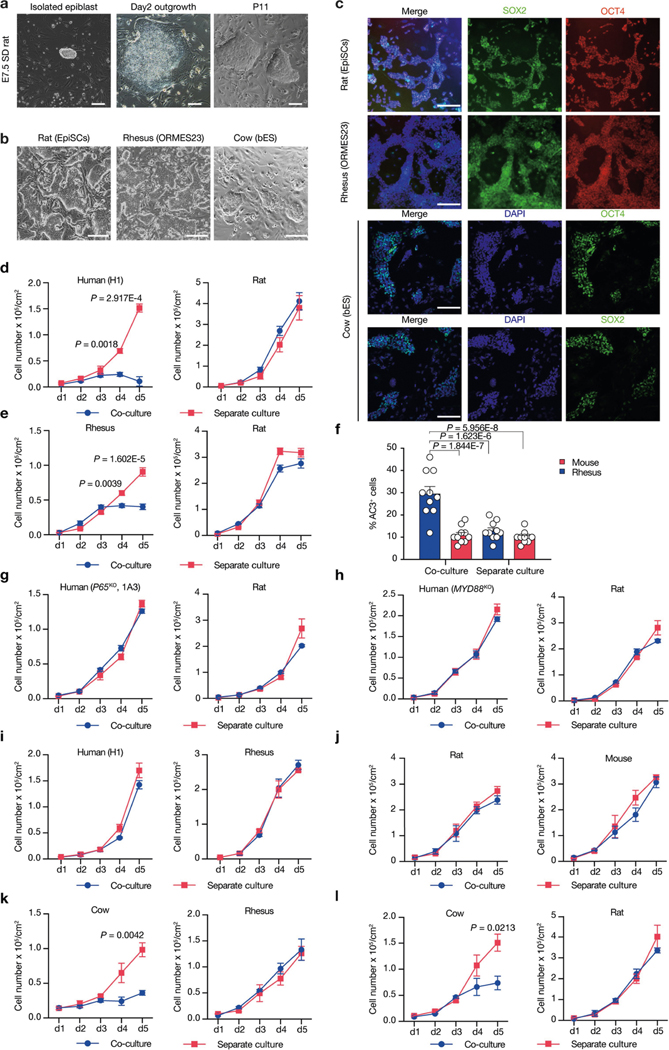
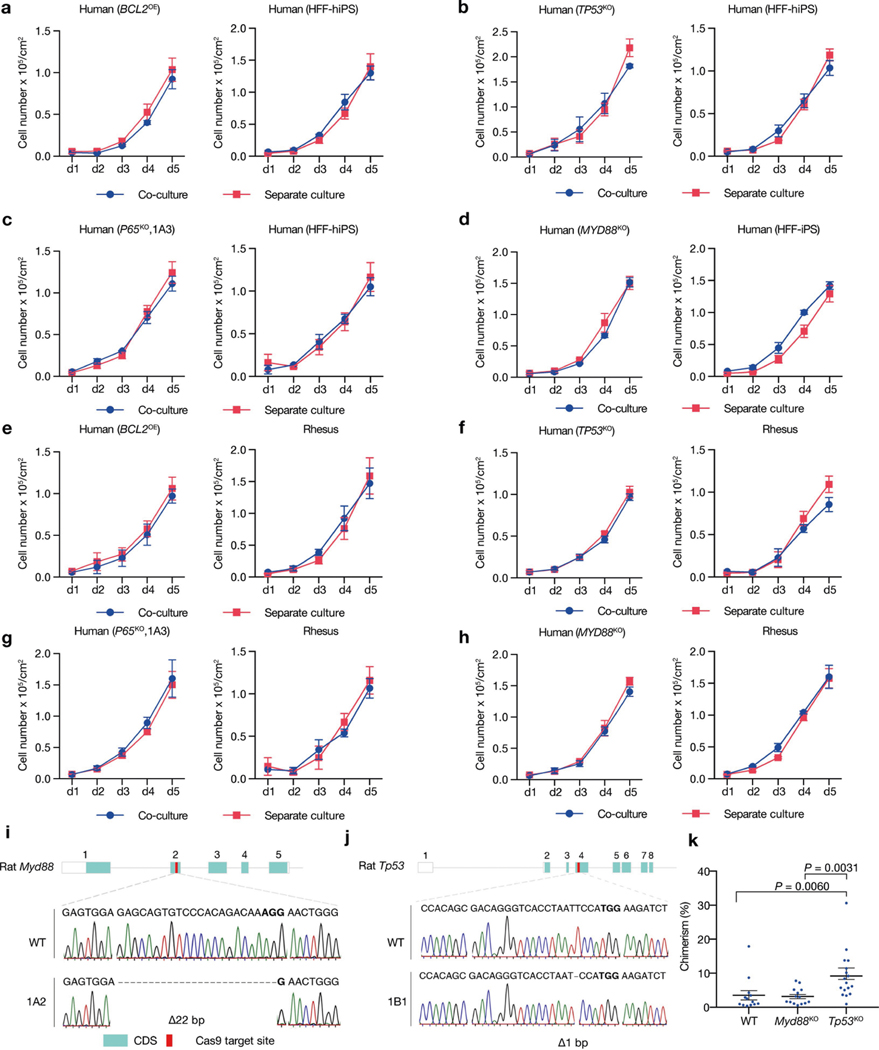
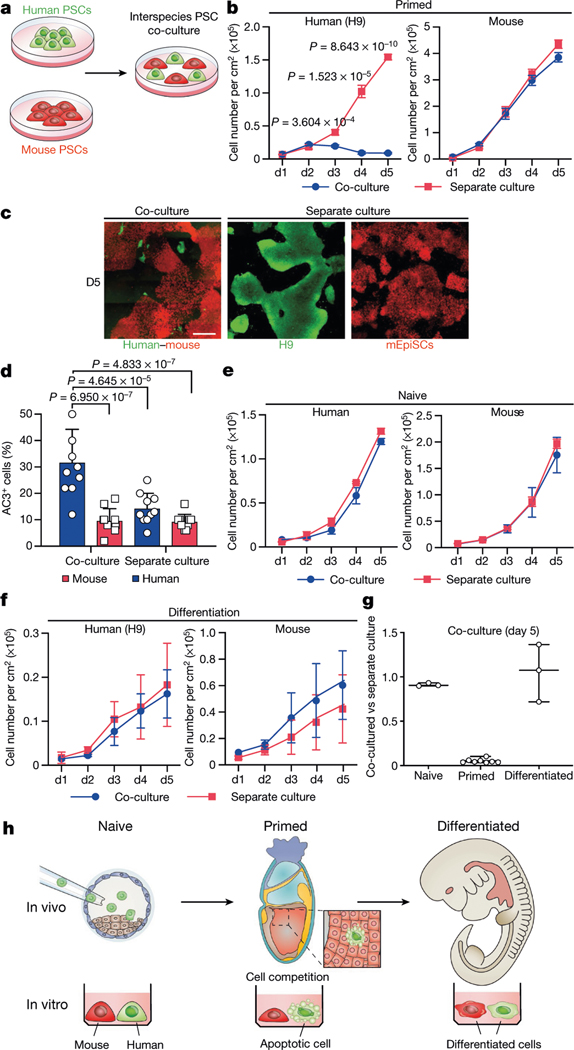
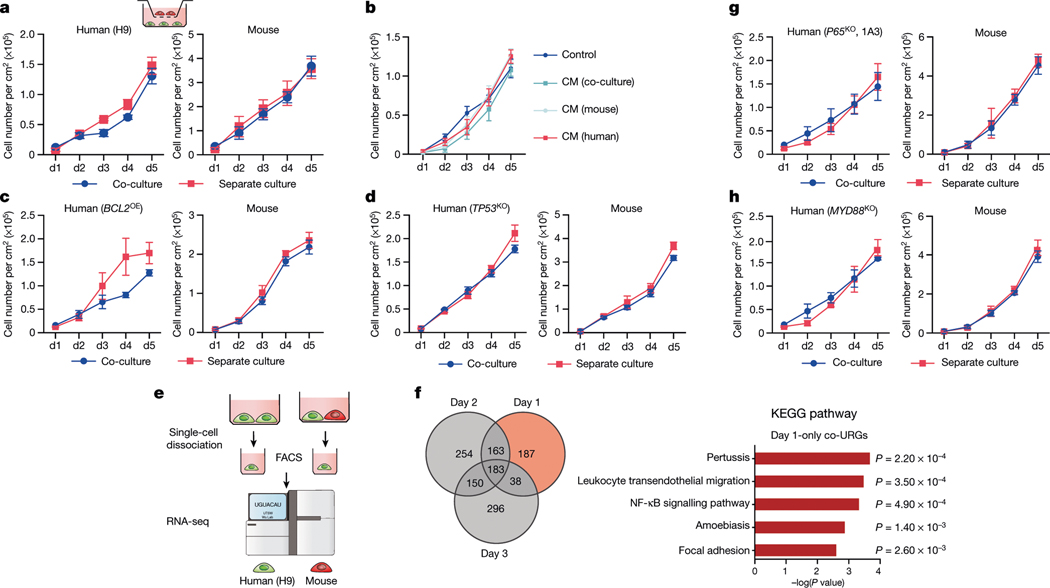
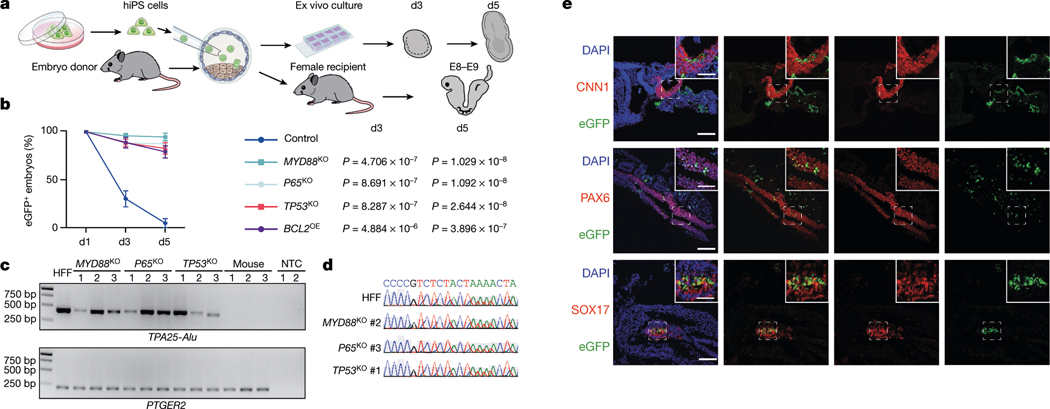
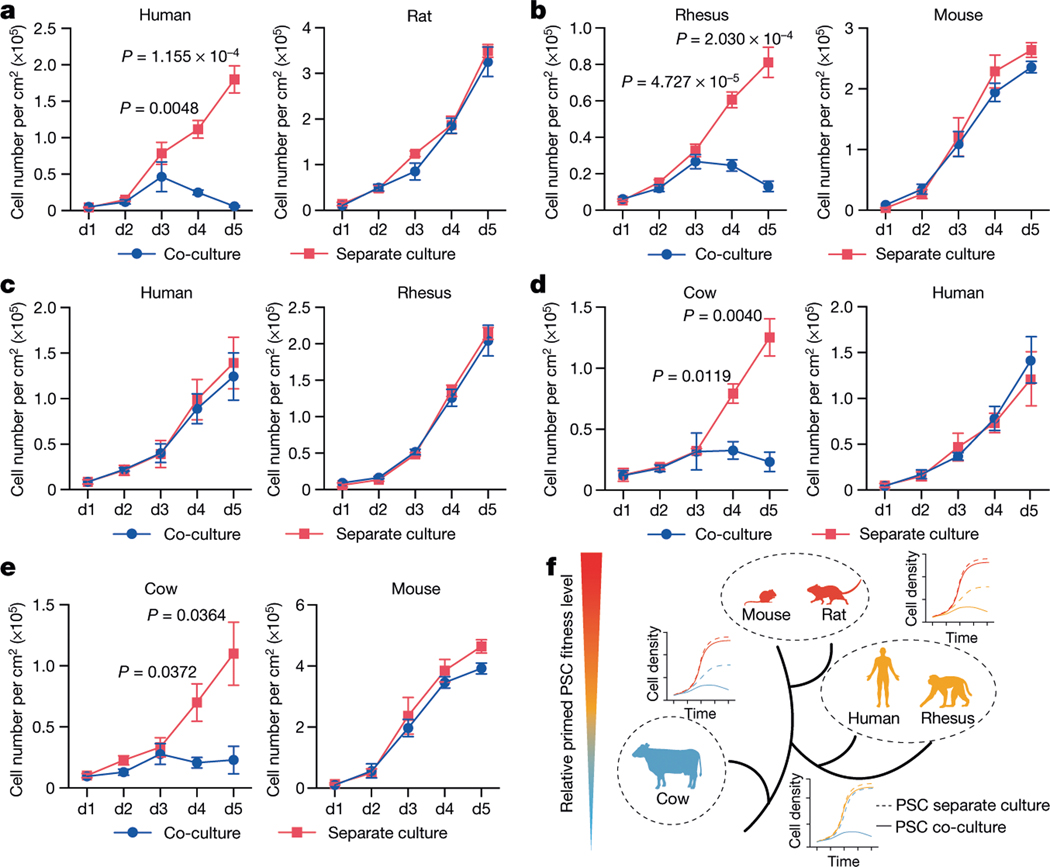
Cell competition involves a conserved fitness-sensing process during which fitter cells eliminate neighbouring less-fit but viable cells1. Cell competition has been proposed as a surveillance mechanism to ensure normal development and tissue homeostasis, and has also been suggested to act as a barrier to interspecies chimerism2. However, cell competition has not been studied in an interspecies context during early development owing to the lack of an in vitro model. Here we developed an interspecies pluripotent stem cell (PSC) co-culture strategy and uncovered a previously unknown mode of cell competition between species. Interspecies competition between PSCs occurred in primed but not naive pluripotent cells, and between evolutionarily distant species. By comparative transcriptome analysis, we found that genes related to the NF-κB signalling pathway, among others, were upregulated in less-fit 'loser' human cells. Genetic inactivation of a core component (P65, also known as RELA) and an upstream regulator (MYD88) of the NF-κB complex in human cells could overcome the competition between human and mouse PSCs, thereby improving the survival and chimerism of human cells in early mouse embryos. These insights into cell competition pave the way for the study of evolutionarily conserved mechanisms that underlie competitive cell interactions during early mammalian development. Suppression of interspecies PSC competition may facilitate the generation of human tissues in animals.


Conflict of interest statement

Competing interests C.Z., Y.H. and J.W. are inventors on a patent application (applied through the Board of Regents of The University of Texas System, application number 62/963,801; status of application pending) entitled ‘Modulating TLR, NF-KB and p53 Signalling Pathways to Enhance Interspecies Chimerism Between Evolutionary Distant Species’ arising from this work. The other authors declare no competing interests.

Figures

Extended Data Fig. 1 |
Extended Data Fig. 1 |. Human–mouse PSC co-culture.
a, Representative brightfield images of H9-hES cells (passage 51) and mEpiSCs (passage 30), in the F/R1 culture condition. Scale bar, 200 μm. b, Representative immunofluorescence images of mEpiSCs (passage 32), H9-hES cells (passage 49), H1-hES cells (passage 51) and HFF-hiPS cells (passage 21), in the F/R1 culture condition, expressing pluripotency transcription factors SOX2 (green) and OCT4 (red). Blue, DAPI. Scale bars, 200 μm. c, Long-term F/R1-cultured H9-hES cells (passage 49) and HFF-hiPS cells (passage 23) exhibited normal karyotypes. d, Flow cytometry analysis of cell cycle phase distribution of H9-hES cells and mEpiSCs after 3 days in separate and co-cultures. n = 3, biological replicates. Data are mean ± s.e.m. e, H9-hES cells maintained the expression of pluripotency markers OCT4, SOX2 and TRA-1–60 after 3 days of separate and co-cultures. f, mEpiSCs maintained the expression of pluripotency markers CD24, SOX2, SSEA1 and OCT4 after 3 days of separate and co-cultures. Images in a and b are representative of three independent experiments.
Extended Data Fig. 2 |
Extended Data Fig. 2 |. Human–mouse primed PSC competition.
a, Representative immunofluorescence images showing AC3 staining of day-3 co-cultured and separately cultured H9-hES cells (green) and mEpiSCs (red). Blue, DAPI; purple, AC3. Inset, a higher-magnification image of boxed area with dotted line. Scale bars, 200 μm. b, Dot plots showing the percentages of annexin V+ cells in day-3 co-cultured and separately cultured H9-hES cells (left) and mEpiSCs (right). n = 3, biological replicates. c, Growth curves of co-cultured (blue) and separately cultured (red) H1-hES cells (left) and mEpiSCs (right). Plating ratio of 4:1 (human:mouse), n = 3, biological replicates. d, Representative fluorescence images of day-5 co-cultured and separately cultured H1-hES cells (green) and mEpiSCs (red). Scale bar, 400 μm. e, Growth curves of co-cultured (blue) and separately cultured (red) HFF-hiPS cells and mEpiSCs. Plating ratio of 4:1 (human:mouse), n = 5, biological replicates. f, Representative fluorescence images of day-5 co-cultured and separately cultured HFF-hiPS cells (green) and mEpiSCs (red). Scale bar, 400 μm. Experiments in a, d and f were repeated independently three times with similar results. P values determined by unpaired two-tailed t-test (b, c, e). All data are mean ± s.e.m.
Extended Data Fig. 3 |
Extended Data Fig. 3 |. Lack of cell competition in human-mouse naive PSC and differentiation co-cultures.
a, Representative brightfield images showing typical colony morphologies of human and mouse PSCs cultured in naive or naive-like (5iLAF, PXGL, NHSM and LCDM) culture conditions. Scale bars, 200 μm. b, A coat-colour chimera generated by J1 mouse ES cells, cultured in 5iLAF medium. c, RT–qPCR analysis of relative expression levels of selected naive pluripotency markers in WIBR3 (5iLAF) and H9 (PXGL) hES cells compared to F/R1-cultured H9-hES cells. n = 3, biological replicates. P values determined by unpaired two-tailed t-test. d, e, Representative immunofluorescence images of SUSD2 and KLF17 in hES cells cultured in 5iLAF (WIRB3) and PXGL (H9) medium. Scale bars, 200 μm. f, Representative fluorescence images of day-5 co-cultured and separately cultured WIBR3 hES cells (green) and J1 mouse ES cells (red) cultured in 5iLAF medium. Scale bar, 400 μm. g, Growth curves of co-cultured (blue) and separately cultured (red) H9-hES cells and J1 mouse ES cells in PXGL medium. n = 3, biological replicates. h, Growth curves of co-cultured (blue) and separately cultured (red) H9-hES cells and mouse ES cells in NHSM medium. n = 3, biological replicates. i, Growth curves of co-cultured (blue) and separately cultured (red) human iPS-EPS (extended pluripotent stem) cells and mouse EPS cells in LCDM medium. n = 3, biological replicates. j, Representative fluorescence images of day-5 co-cultured and separately cultured H9-hES cells (green) and mEpiSCs (red) under a differentiation culture condition. Scale bar, 400 μm. k, l, Representative immunofluorescence images showing H9-hES cells and mEpiSCs under the differentiation culture condition lost expression of pluripotency transcription factors SOX2 (purple) and OCT4 (purple) on day 5. Blue, DAPI. Scale bars, 200 μm. Images in a, df and jl are representative of three independent experiments. All data are mean ± s.e.m.
Extended Data Fig. 4 |
Extended Data Fig. 4 |. Human–mouse primed PSC competition depends on cell–cell contact.
a, Growth curves of H9-hES cells (left) and mEpiSCs (right) plated at different ratios (mouse:human = 1:1, 1:2, 1:4 and 1:8) in separate and co-cultures. The seeding cell number of H9-hES cells was fixed at 1 × 104 cm−2, whereas seeding cell numbers of mEpiSCs were adjusted according to different seeding ratios. n = 3, biological replicates. b, Growth curves of H9-hES cells (left) and mEpiSCs (right) plated at high and low densities (high, 1.25 × 104 cm−2; and low, 0.625 × 104 cm−2; 4:1 ratio) in separate and co-cultures. n = 3, biological replicates. c, Quantification of AC3+ cells in day-3 co-cultured and separately cultured H9-hES cells (blue) and mEpiSCs (red), plating ratio of 1:1 (human:mouse), n = 10, randomly selected 318.2 × 318.2 μm2 fields examined over three independent experiments. d, Representative fluorescence images of day-5 co-cultured and separately cultured H9-hES cells (green) and mEpiSCs (red) in transwell. Scale bar, 400 μm. Images are representative of three independent experiments. e, Live H9-hES cells (cell numbers per cm2) at day 5 after treatments with different dosages (50%, 33% and 10%) of conditioned medium (CM) collected from co-cultures of H9-hES cells and mEpiSCs (cCM), or separate cultures of mEpiSCs (mCM). n = 3, biological replicates. P values (co-cultures compared with separate cultures), unpaired two-tailed t-test (a, b), or one-way ANOVA with Tukey’s multiple comparison (c). All data are mean ± s.e.m.
Extended Data Fig. 5 |
Extended Data Fig. 5 |. Overcoming human–mouse primed PSC competition by blocking human cell apoptosis.
a, Western blot analysis confirmed the overexpression of BCL-2 in BCL2OE hiPS cells. GAPDH was used as a loading control. b, Representative brightfield and immunofluorescence images showing long-term cultured BCL2OE hiPS cells expressed core (SOX2, green; OCT4, red) and primed (CD24, green) pluripotency markers. Blue, DAPI. Scale bars, 200 μm. c, Representative fluorescence images of day-5 co-cultured and separately cultured BCL2OE hiPS cells (green) and mEpiSCs (red). Scale bar, 400 μm. d, Dot plot showing the RT–qPCR results confirming knockdown of TP53 transcript in TP53KD hiPS cells. n = 3, biological replicates. e, Representative brightfield and immunofluorescence images showing longterm cultured TP53KD hiPS cells expressed core (SOX2, green; OCT4, red) and primed (CD24, green) pluripotency markers. Blue, DAPI. Scale bars, 200 μm. f, Growth curves of co-cultured (blue) and separately cultured (red) TP53KD hiPS cells and mEpiSCs. n = 3, biological replicates. g, Representative fluorescence images of day-5 co-cultured and separately cultured TP53KD hiPS cells (green) and mEpiSCs (red). Scale bar, 400 μm. h, Sanger sequencing result showing out-of-frame homozygous 65-bp deletion in TP53KO hiPS cells. Bold, PAM sequence. i, Representative brightfield and immunofluorescence images showing long-term cultured TP53KO hiPS cells expressed core (SOX2, green; OCT4, red) and primed (CD24, green) pluripotency markers. Blue, DAPI. Scale bars, 200 μm. j, Representative fluorescence images of day-5 co-cultured and separately cultured TP53KO hiPS cells (green) and mEpiSCs (red). Scale bar, 400 μm. k, Western blot analysis confirmed the lack of TSC1 protein expression and activation of mTOR pathway (S6K phosphorylation, pS6K) in TSC1KO hiPS cells. GAPDH was used as a loading control. l, Growth curves of co-cultured (blue) and separately cultured (red) TSC1KO hiPS cells and mEpiSCs. n = 3, biological replicates. m, Representative fluorescence images of day-5 cocultured and separately cultured TSC1KO hiPS cells (green) and mEpiSCs (red). Scale bar, 400 μm. Experiments in a and k were repeated independently three times with similar results. For gel source data, see Supplementary Fig. 1. Images in b, c, e, g, i, j and m are representative of three independent experiments. P values determined by unpaired two-tailed t-test (d, l).
Extended Data Fig. 6 |
Extended Data Fig. 6 |. Comparative RNA-seq analysis between co-cultured and separately cultured H9-hES cells.
a, b, KEGG pathways enriched in all (days 1, 2 and 3 combined) (a) and common (commonly shared among days 1, 2 and 3) (b) co-URGs in H9-hES cells. ce, Volcano plots showing significantly upregulated (red) and downregulated (blue) genes in co-cultured versus separately cultured H9-hES cells on days 1 (c), 2 (d) and 3 (e). NF-κB pathway-related genes are highlighted in the volcano plots. P values determined by a modified one-sided Fisher’s exact test (EASE score) (a, b) or Wald test (ce).
Extended Data Fig. 7 |
Extended Data Fig. 7 |. Genetic inactivation of P65 and MYD88 in human PSCs overcome human–mouse primed PSC competition.
a, Sanger sequencing results showing out-of-frame homozygous 1-bp insertion in two independent P65KO hiPS cell clones: 1A3 and 1B1. Bold, PAM sequence. b, Western blot analysis confirmed the lack of P65 protein expression in several independent P65KO hiPS cell clones. GAPDH was used as a loading control. c, P65KO hiPS cells (clone 1A3) maintained normal karyotype after long-term passaging (passage 10). d, Representative brightfield and immunofluorescence images showing long-term F/R1-cultured P65KO hiPS cells maintained stable colony morphology and expressed core (SOX2, green; OCT4, red) and primed (CD24, green) pluripotency markers. Blue, DAPI. Scale bars, 200 μm. e, Representative haematoxylin and eosin staining images of a teratoma generated by P65KO hiPS cells (clone 1A3) showing lineage differentiation towards three germ layers. Scale bar, 200 μm. f, Representative fluorescence images of day-5 co-cultured and separately cultured P65KO hiPS cells (green, clone 1A3) and mEpiSCs (red). Scale bar, 400 μm. g, Growth curves of co-cultured (blue) and separately cultured (red) P65KO hiPS cells (clone 1B1) and mEpiSCs. n = 3, biological replicates. Data are mean ± s.e.m. h, Representative fluorescence images of day-5 co-cultured and separately cultured P65KO hiPS cells (clone 1B1, green) and mEpiSCs (red). Scale bar, 400 μm. i, Sanger sequencing result showing out-of-frame homozygous 13-bp deletion in MYD88KO hiPS cells. Bold, PAM sequence. j, Western blot analysis confirmed the lack of MYD88 protein expression in MYD88KO hiPS cells. k, Representative brightfield and immunofluorescence images showing longterm F/R1-cultured MYD88KO hiPS cells maintained stable colony morphology and expressed core (SOX2, green; OCT4, red) and primed (CD24, green) pluripotency markers. Blue, DAPI. Scale bars, 200 μm. l, Representative haematoxylin and eosin staining images of a teratoma generated by MYD88KO hiPS cells showing lineage differentiation towards three germ layers. Scale bar, 200 μm. m, Representative fluorescence images of day-5 co-cultured and separately cultured MYD88KO hiPS cells (green) and mEpiSCs (red). Scale bar, 400 μm. n, Western blot analyses of IKBA, P65, phospho-P65 (s468), P53 protein expression levels in co-cultured and separately cultured wild-type and mutant (P65KO, TP53KO and MYD88KO) HFF-hiPS cells. Vinculin was used as a loading control. Boxed areas were from separate blots. o, Bar graphs showing the fold changes of protein expression levels (shown in n) in co-cultured versus separately cultured wild-type and mutant HFF-hiPS cells. n = 1, biological replicate. Experiments in b, j and n were repeated independently three times with similar results. For gel source data, see Supplementary Fig. 1. Images in df, h and km are representative of three independent experiments.
Extended Data Fig. 8 |
Extended Data Fig. 8 |. Overcoming interspecies PSC competition enhances survival and chimerism of human primed PSCs in early mouse embryos.
a, Representative brightfield and fluorescence merged images of mouse embryos cultured for 1 day (d1), 3 days (d3) and 5 days (d5) after blastocyst injection with wild-type, MYD88KO, P65KO, TP53KO and BCL2OE hiPS cells. Scale bars, 100 μm. b, Representative immunofluorescence images of day-5 mouse embryos co-stained with OCT4 (red), eGFP (green) and AC3 (purple) after blastocyst injection with wild-type, MYD88KO, P65KO, TP53KO and BCL2OE hiPS cells. Top, eGFP and OCT4 merged images with DAPI; bottom, eGFP and AC3 merged images with DAPI. Scale bars, 100 μm and 50 μm (insets). c, Dot plot showing the percentages of eGFP+ E8–E9 mouse embryos derived from wild-type, MYD88KO, P65KO and TP53KO hiPS cells. Each blue dot represents one embryo transfer experiment. n = 2 (WT), n = 11 (MYD88KO), n = 5 (P65KO) and n = 7 (TP53KO), independent experiments (Supplementary Table 2). d, Genomic PCR analysis of E8–E9 mouse embryos derived from blastocyst injection of wild-type hiPS cells. TPA25-Alu denotes a human-specific primer. PTGER2 was used as a loading control. HFF, HFF-hiPS cells. NTC, non-template control. The experiment was repeated independently three times with similar results. For gel source data, see Supplementary Fig. 1. e, f, Representative immunofluorescence images showing contribution and differentiation of eGFP-labelled P65KO (e) and TP53KO (f) hiPS cells in E8–E9 mouse embryos. Embryo sections were stained with antibodies against eGFP and lineage markers including CNN1 (mesoderm, top), PAX6 (ectoderm, middle) and SOX17 (endoderm, bottom). Scale bars, 100 μm and 50 μm (insets). Images in a, b, e and f are representative of three independent experiments.
Extended Data Fig. 9 |
Extended Data Fig. 9 |. Primed PSC competition among different species.
a, Representative brightfield images showing the derivation of rat EpiSCs cultured in F/R1 medium. Left, an isolated E7.5 Sprague Dawley (SD) rat epiblast; middle, day-2 rat epiblast outgrowth; right, rat EpiSCs at passage 11 (P11). Scale bars, 200 μm (left); 100 μm (middle and right). b, Representative brightfield images showing typical colony morphologies of rat EpiSCs, rhesus ES cells (ORMES23) and bovine ES cells grown in F/R1 medium, Scale bar, 200 μm. c, Representative immunofluorescence images showing long-term F/R1-cultured rat EpiSCs, ORMES23 rhesus ES cells and bovine ES cells expressed pluripotency transcription factors SOX2 (green) and OCT4 (red/green). Blue, DAPI. Scale bars, 200 μm. d, Growth curves of co-cultured (blue) and separately cultured (red) H1-hES cells and rat EpiSCs. Plating ratio of 4:1 (human:rat). n = 3, biological replicates. e, Growth curves of co-cultured (blue) and separately cultured (red) ORMES23 rhesus ES cells and rat EpiSCs. Plating ratio of 4:1 (rhesus:rat). n = 6, biological replicates. f, Quantification of AC3+ cells in day-3 co-cultured and separately cultured ORMES23 rhesus ES cells (blue) and mEpiSCs (red), n = 10, randomly selected 318.2 × 318.2 μm2 fields examined over three independent experiments. g, Growth curves of co-cultured (blue) and separately cultured (red) P65KO hiPS cells (clone 1B1) and rat EpiSCs. n = 3, biological replicates. h, Growth curves of co-cultured (blue) and separately cultured (red) MYD88KO hiPS cells and rat EpiSCs. n = 3, biological replicates. i, Growth curves of co-cultured (blue) and separately cultured (red) H1-hES cells and ORMES23 rhesus ES cells. Plating ratio of 1:1 (rhesus:human). n = 3, biological replicates. j, Growth curves of co-cultured (blue) and separately cultured (red) mEpiSCs and rat EpiSCs. Plating ratio of 1:1 (mouse:rat). n = 3, biological replicates. k, Growth curves of co-cultured (blue) and separately cultured (red) bovine ES cells and ORMES23 rhesus ES cells. Plating ratio of 1:1 (cow:rhesus). n = 3, biological replicates. l, Growth curves of co-cultured (blue) and separately cultured (red) bovine ES cells and rat EpiSCs. Plating ratio of 4:1 (cow:rat). n = 3, biological replicates. Images in ac are representative of three independent experiments. P values determined by unpaired two-tailed t-test (d, e, k, l) or one-way ANOVA with Tukey’s multiple comparison (f). All data are mean ± s.e.m.
Extended Data Fig. 10 |
Extended Data Fig. 10 |. Effects of suppressing MYD88–P53–P65 signalling on human–human/monkey primed PSC co-culture and rat cell chimerism in mouse embryos.
a, Growth curves of co-cultured (blue) and separately cultured (red) wild-type and BCL2OE hiPS cells. n = 3, biological replicates. b, Growth curves of co-cultured (blue) and separately cultured (red) wild-type and TP53KO hiPS cells. n = 3, biological replicates. c, Growth curves of co-cultured (blue) and separately cultured (red) wild-type and P65KO hiPS cells. n = 3, biological replicates. d, Growth curves of co-cultured (blue) and separately cultured (red) wild-type and MYD88KO hiPS cells. n = 3, biological replicates. e, Growth curves of co-cultured (blue) and separately cultured (red) BCL2OE hiPS cells and ORMES23 rhesus ES cells. n = 3, biological replicates. f, Growth curves of co-cultured (blue) and separately cultured (red) TP53KO hiPS cells and ORMES23 rhesus ES cells. n = 3, biological replicates. g, Growth curves of co-cultured (blue) and separately cultured (red) P65KO hiPS cells and ORMES23 rhesus ES cells. n = 3, biological replicates. h, Growth curves of co-cultured (blue) and separately cultured (red) MYD88KO hiPS cells and ORMES23 rhesus ES cells. n = 3, biological replicates. i, Sanger sequencing result showing out-of-frame homozygous 22-bp deletion in Myd88KO rat ES cells. Bold, PAM sequence. j, Sanger sequencing result showing out-of-frame homozygous 1-bp deletion in Tp53KO rat ES cells. k, Dot plot showing the chimeric contribution levels of wild-type, Myd88KO and Tp53KO rat ES cells in E10.5 mouse embryos. Each blue dot indicates one E10.5 embryo. n = 13 (WT), n = 14 (Myd88KO), and n = 17 (Tp53KO), independent embryos. P values determined by one-way ANOVA with LSD multiple comparison. All data are mean ± s.e.m.
Fig. 1 |
Fig. 1 |. Cell competition between human and mouse primed PSCs.
a, A schematic of human and mouse PSC co-culture. b, Growth curves of co-cultured (blue) and separately cultured (red) H9-hES cells (left) and mEpiSCs (right) grown in the F/R1 culture condition. n = 8, biological replicates. c, Representative fluorescence images of day-5 co-cultured and separately cultured H9-hES cells (green) and mEpiSCs (red). Scale bar, 400 μm. d, Quantification of AC3+ cells in day-3 co-cultured and separately cultured H9-hES cells (blue) and mEpiSCs (red). n = 10, randomly selected 318.2 × 318.2 μm2 fields examined over three independent experiments. e, Growth curves of co-cultured (blue) and separately cultured (red) human and mouse naive PSCs, grown in 5iLAF medium. n = 3, biological replicates. f, Growth curves of co-differentiation (blue) and separate differentiation (red) cultures of H9-hES cells and mEpiSCs. n = 3, biological replicates. g, Ratios (co-culture versus separate culture) of day-5 live human cell numbers in naïve (n = 3), primed (n = 8) and differentiation (n = 3) cell culture conditions. n, biological replicates. h, Schematic summary of human and mouse PSC competition. Plating ratio was 4:1 (human:mouse) for all co-cultures shown. P values determined by unpaired two-tailed t-test (b) or one-way analysis of variance (ANOVA) with Tukey’s multiple comparison (d). All data are mean ± s.e.m.
Fig. 2 |
Fig. 2 |. Mechanisms underlying human–mouse primed PSC competition.
a, Growth curves of co-cultured (blue) and separately cultured (red) H9-hES cells (left) and mEpiSCs (right) in transwell culture conditions. n = 3, biological replicates. b, Growth curves of H9-hES cells treated with different types of concentrated conditioned medium (CM). n = 3, biological replicates. c, Growth curves of co-cultured (blue) and separately cultured (red) BCL2OE hiPS cells (left) and mEpiSCs (right). n = 4, biological replicates. d, Growth curves of co-cultured (blue) and separately cultured (red) TP53KO hiPS cells (left) and mEpiSCs (mouse). n = 3, biological replicates. e, Schematic of the RNA-seq experimental setup. f, Left, Venn diagram showing the numbers of co-URGs in H9-hES cells. Right, top five KEGG pathways enriched in day-1-only co-URGs in H9-hES cells. n = 2, biological replicates. P values determined by a modified one-sided Fisher’s exact test (EASE score). g, Growth curves of co-cultured (blue) and separately cultured (red) P65KO hiPS cells (clone 1A3) (left) and mEpiSCs (right). n = 3, biological replicates. h, Growth curves of co-cultured (blue) and separately cultured (red) MYD88KO hiPS cells (left) and mEpiSCs (right). n = 3, biological replicates. All data are mean ± s.e.m.
Fig. 3 |
Fig. 3 |. Overcoming interspecies PSC competition enhances human primed PSCs survival and chimerism in early mouse embryos.
a, Schematic showing the generation of ex vivo and in vivo human–mouse chimeric embryos. b, Line graphs showing the percentages of eGFP+ mouse embryos at indicated time points during ex vivo culture after blastocyst injection of wild-type (control), MYD88KO, P65KO, TP53KO and BCL2OE hiPS cells. n = 3 (control), n = 4 (MYD88KO), n = 6 (P65KO), n = 6 (TP53KO) and n = 3 (BCL2OE) independent injection experiments. Data are mean ± s.e.m. P values (versus control) determined by one-way ANOVA with least significant difference (LSD) multiple comparison. c, Genomic PCR analysis of E8–E9 mouse embryos derived from blastocyst injection of MYD88KO, P65KO and TP53KO hiPS cells, and non-injected control blastocysts. TPA25-Alu denotes a human-specific primer; PTGER2 was used as a loading control. HFF, HFF-hiPS cells. NTC, non-template control. This experiment was repeated independently three times with similar results. For gel source data, see Supplementary Fig. 1. d, Sanger sequencing results of representative PCR products generated by human-specific TPA25-Alu primers. A stretch of TPA25-Alu DNA sequences derived from HFF, MYD88KO (#2), P65KO (#3) and TP53KO (#1) from c are shown. e, Representative immunofluorescence images showing contribution and differentiation of eGFP-labelled MYD88KO hiPS cells in E8–E9 mouse embryos. Embryo sections were stained with antibodies against eGFP and lineage markers including CNN1 (mesoderm, top), PAX6 (ectoderm, middle) and SOX17 (endoderm, bottom). Scale bars, 100 μm and 50 μm (insets). Images are representative of three independent experiments.
Fig. 4 |
Fig. 4 |. Primed PSC competition among different species.
a, Growth curves of co-cultured (blue) and separately cultured (red) H9-hES cells and rat EpiSCs. Plating ratio of 4:1 (human:rat). n = 3, biological replicates. b, Growth curves of co-cultured (blue) and separately cultured (red) ORMES23 rhesus ES cells and mEpiSCs. Plating ratio of 4:1 (rhesus:mouse). n = 6, biological replicates. c, Growth curves of co-cultured (blue) and separately cultured (red) H9-hES cells and ORMES23 rhesus ES cells. Plating ratio of 1:1 (human:rhesus). n = 3, biological replicates. d, Growth curves of co-cultured (blue) and separately cultured (red) bovine ES cells and H9-hES cells. Plating ratio of 1:1 (cow:human). n = 3, biological replicates. e, Growth curves of co-cultured (blue) and separately cultured (red) bovine ES cells and mEpiSCs. Plating ratio of 4:1 (cow:mouse). n = 3, biological replicates. f, A schematic summary showing the hierarchy of ‘winner’ and ‘loser’ species during interspecies primed PSC competition. Animal silhouettes are from BioRender.com. P values determined by unpaired two-tailed t-test (a, b, d, e). All data are mean ± s.e.m.

References

    1. Amoyel M & Bach EA Cell competition: how to eliminate your neighbours. Development 141, 988–1000 (2014). - PMC - PubMed
    1. Wu J. & Izpisua Belmonte JC Dynamic pluripotent stem cell states and their applications. Cell Stem Cell 17, 509–525 (2015). - PubMed
    1. Hackett JA & Surani MA Regulatory principles of pluripotency: from the ground state up. Cell Stem Cell 15, 416–430 (2014). - PubMed
    1. Kobayashi T. et al. Generation of rat pancreas in mouse by interspecific blastocyst injection of pluripotent stem cells. Cell 142, 787–799 (2010). - PubMed
    1. Wu J. et al. Interspecies chimerism with mammalian pluripotent stem cells. Cell 168, 473–486.e15 (2017). - PMC - PubMed

Publication types