. 2021 Mar 5;128(5):e84-e101.
doi: 10.1161/CIRCRESAHA.120.317581. Epub 2021 Jan 28.

Chromatin Accessibility of Human Mitral Valves and Functional Assessment of MVP Risk Loci

Affiliations

Chromatin Accessibility of Human Mitral Valves and Functional Assessment of MVP Risk Loci

Sergiy Kyryachenko et al. Circ Res. .

Abstract

Rationale: Mitral valve prolapse (MVP) is a common valvopathy that leads to mitral insufficiency, heart failure, and sudden death. Functional genomic studies in mitral valves are needed to better characterize MVP-associated variants and target genes.

Objective: To establish the chromatin accessibility profiles and assess functionality of variants and narrow down target genes at MVP loci.

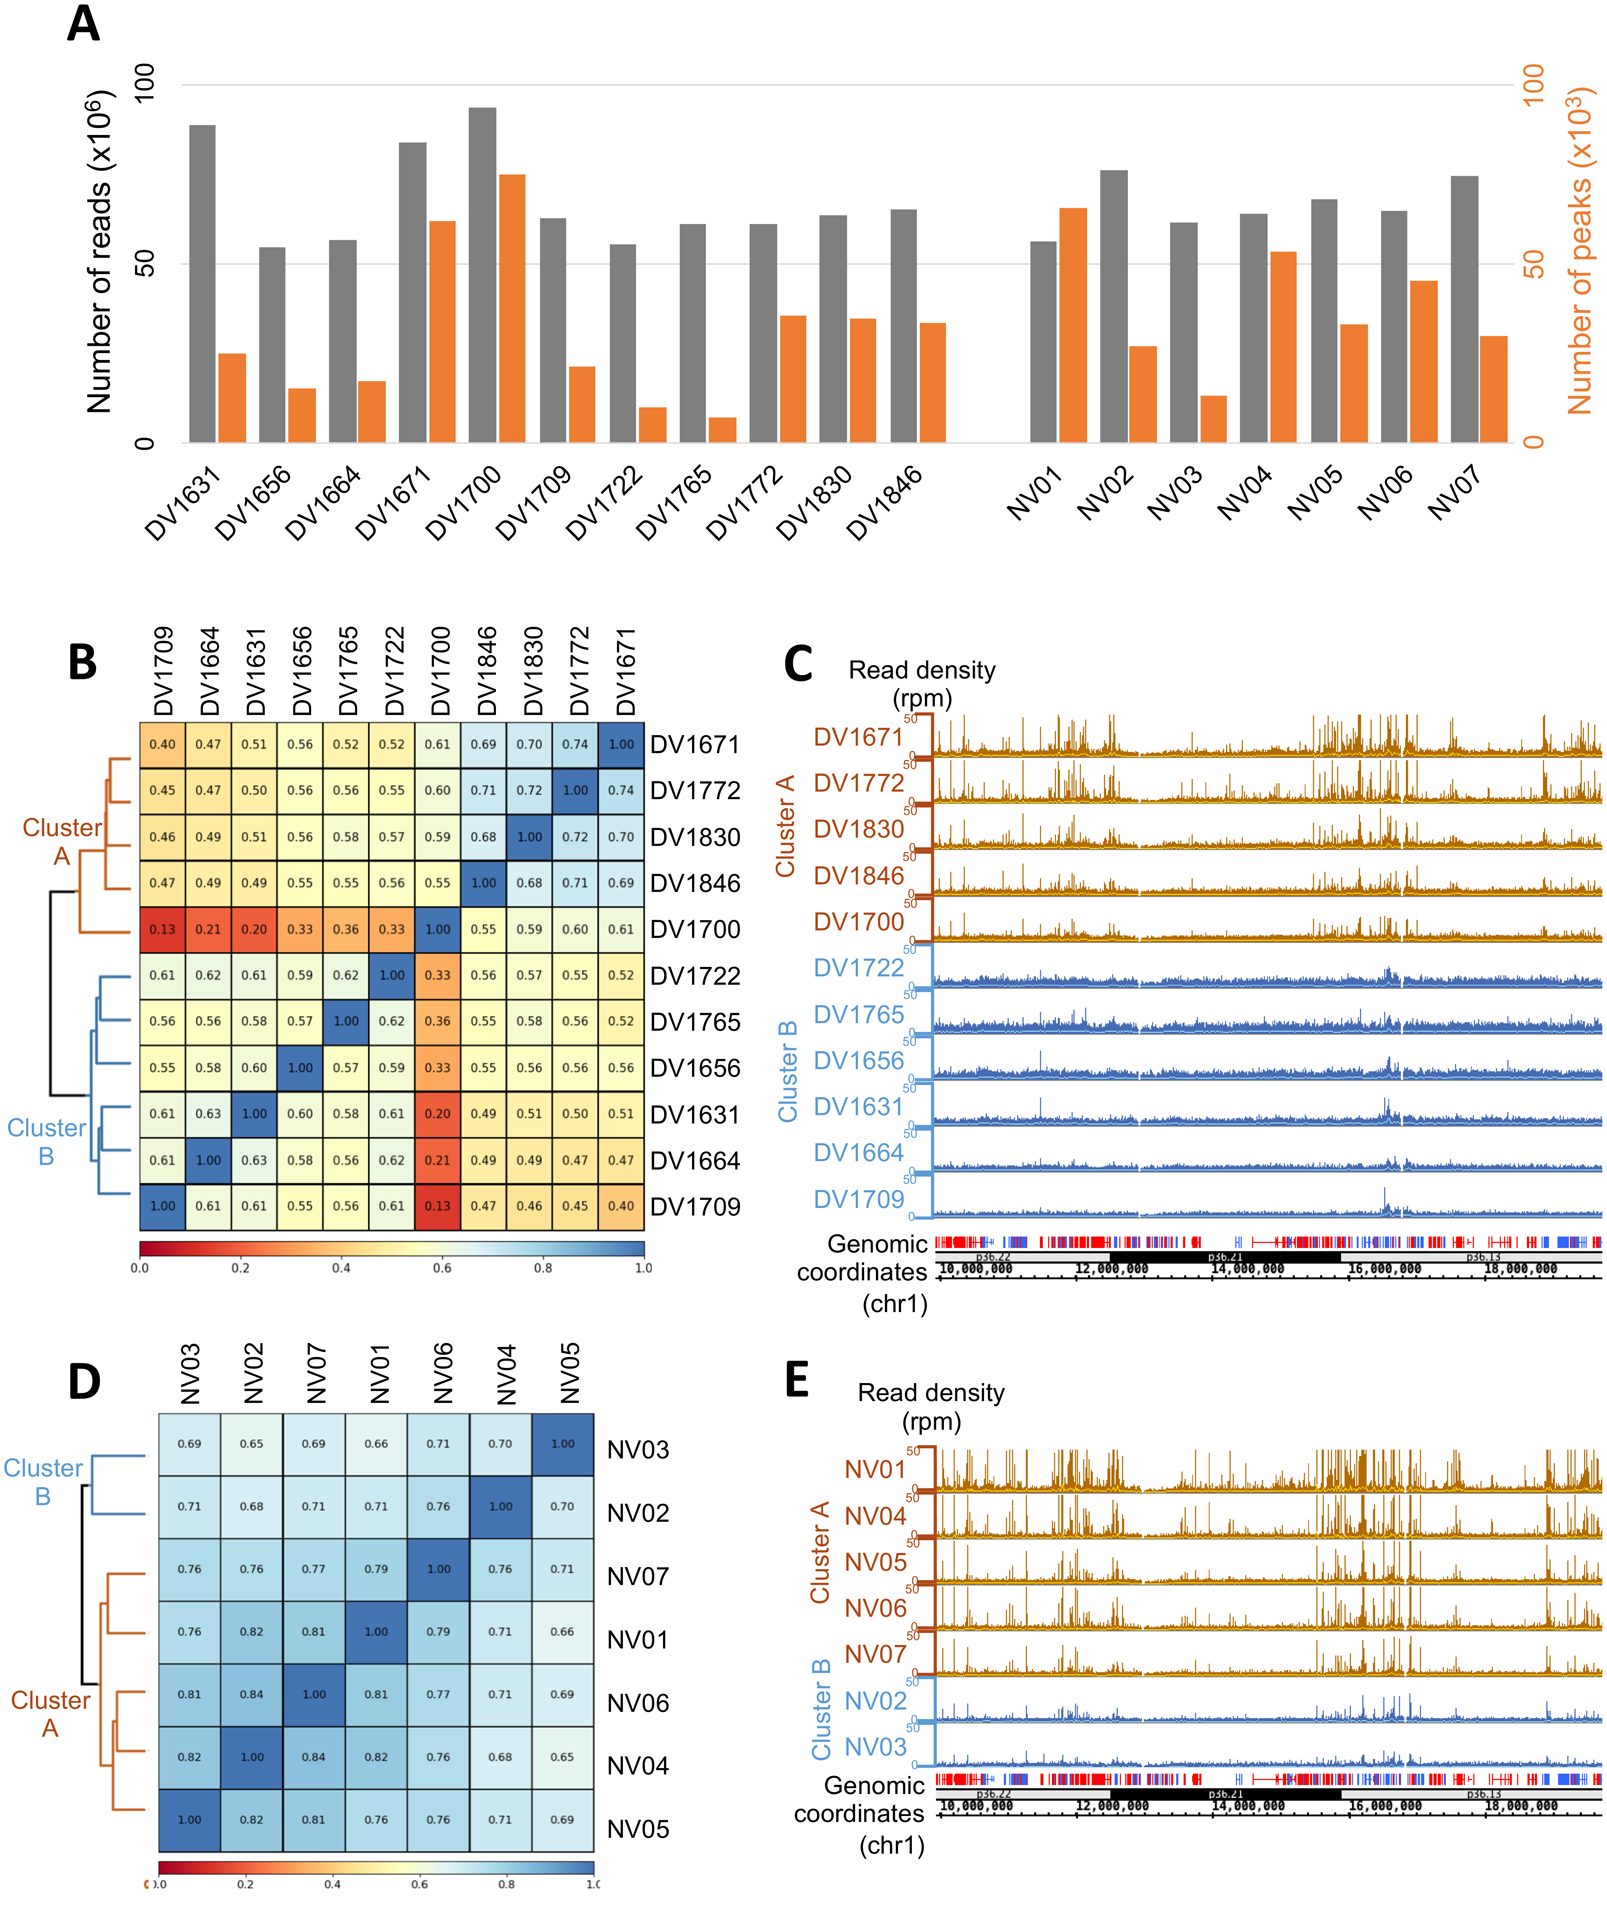
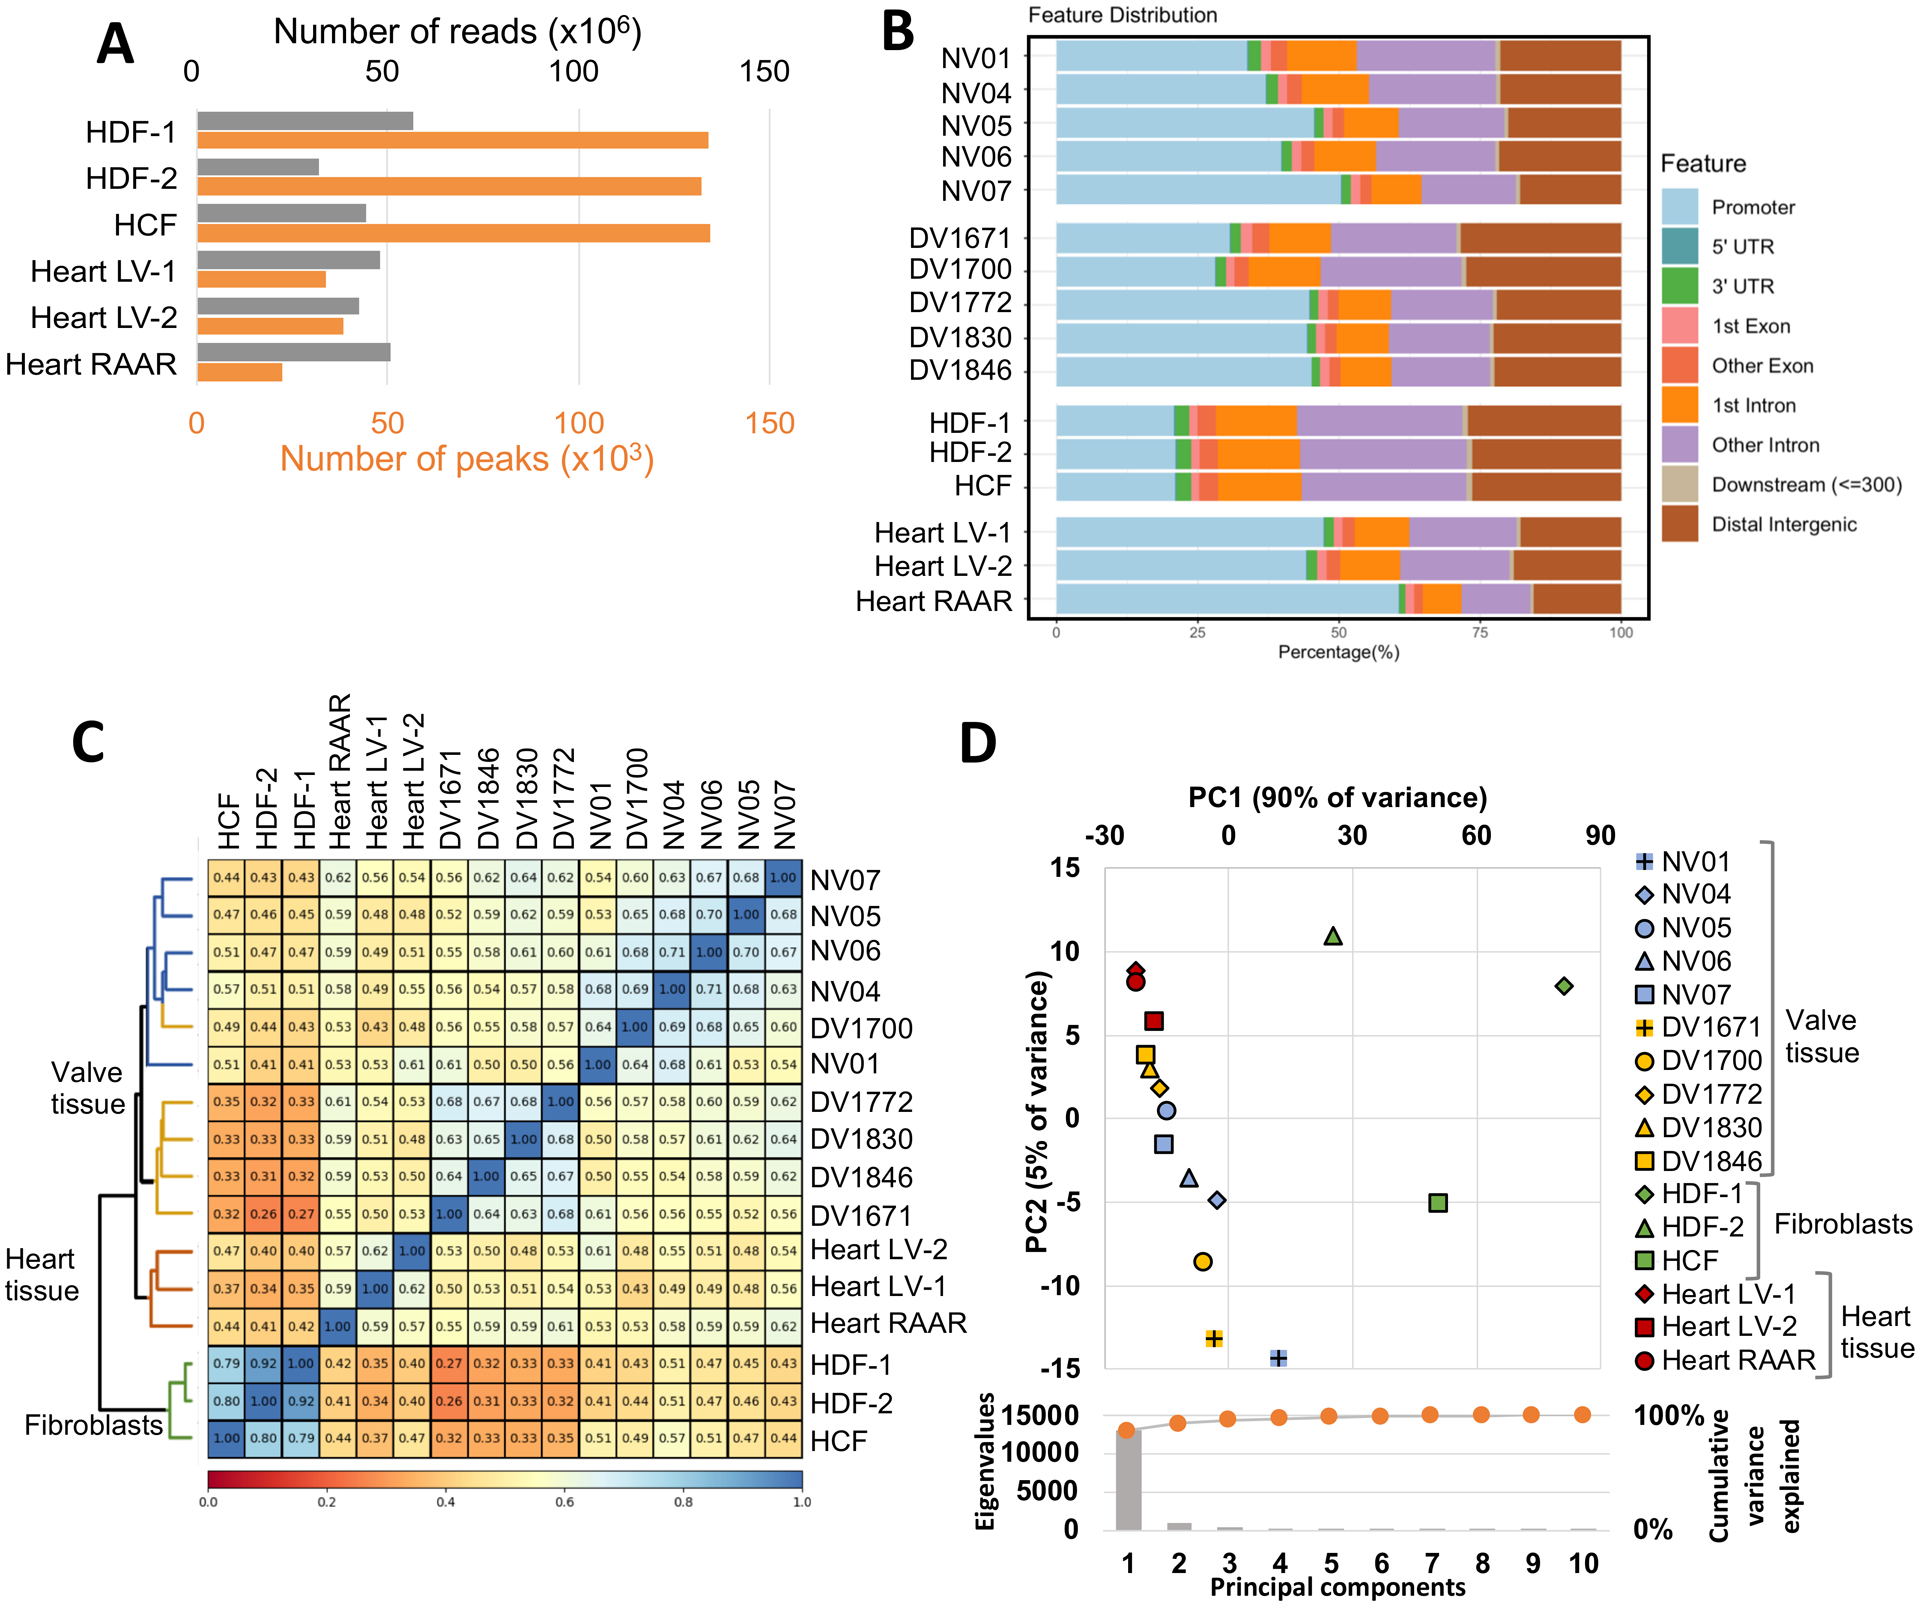
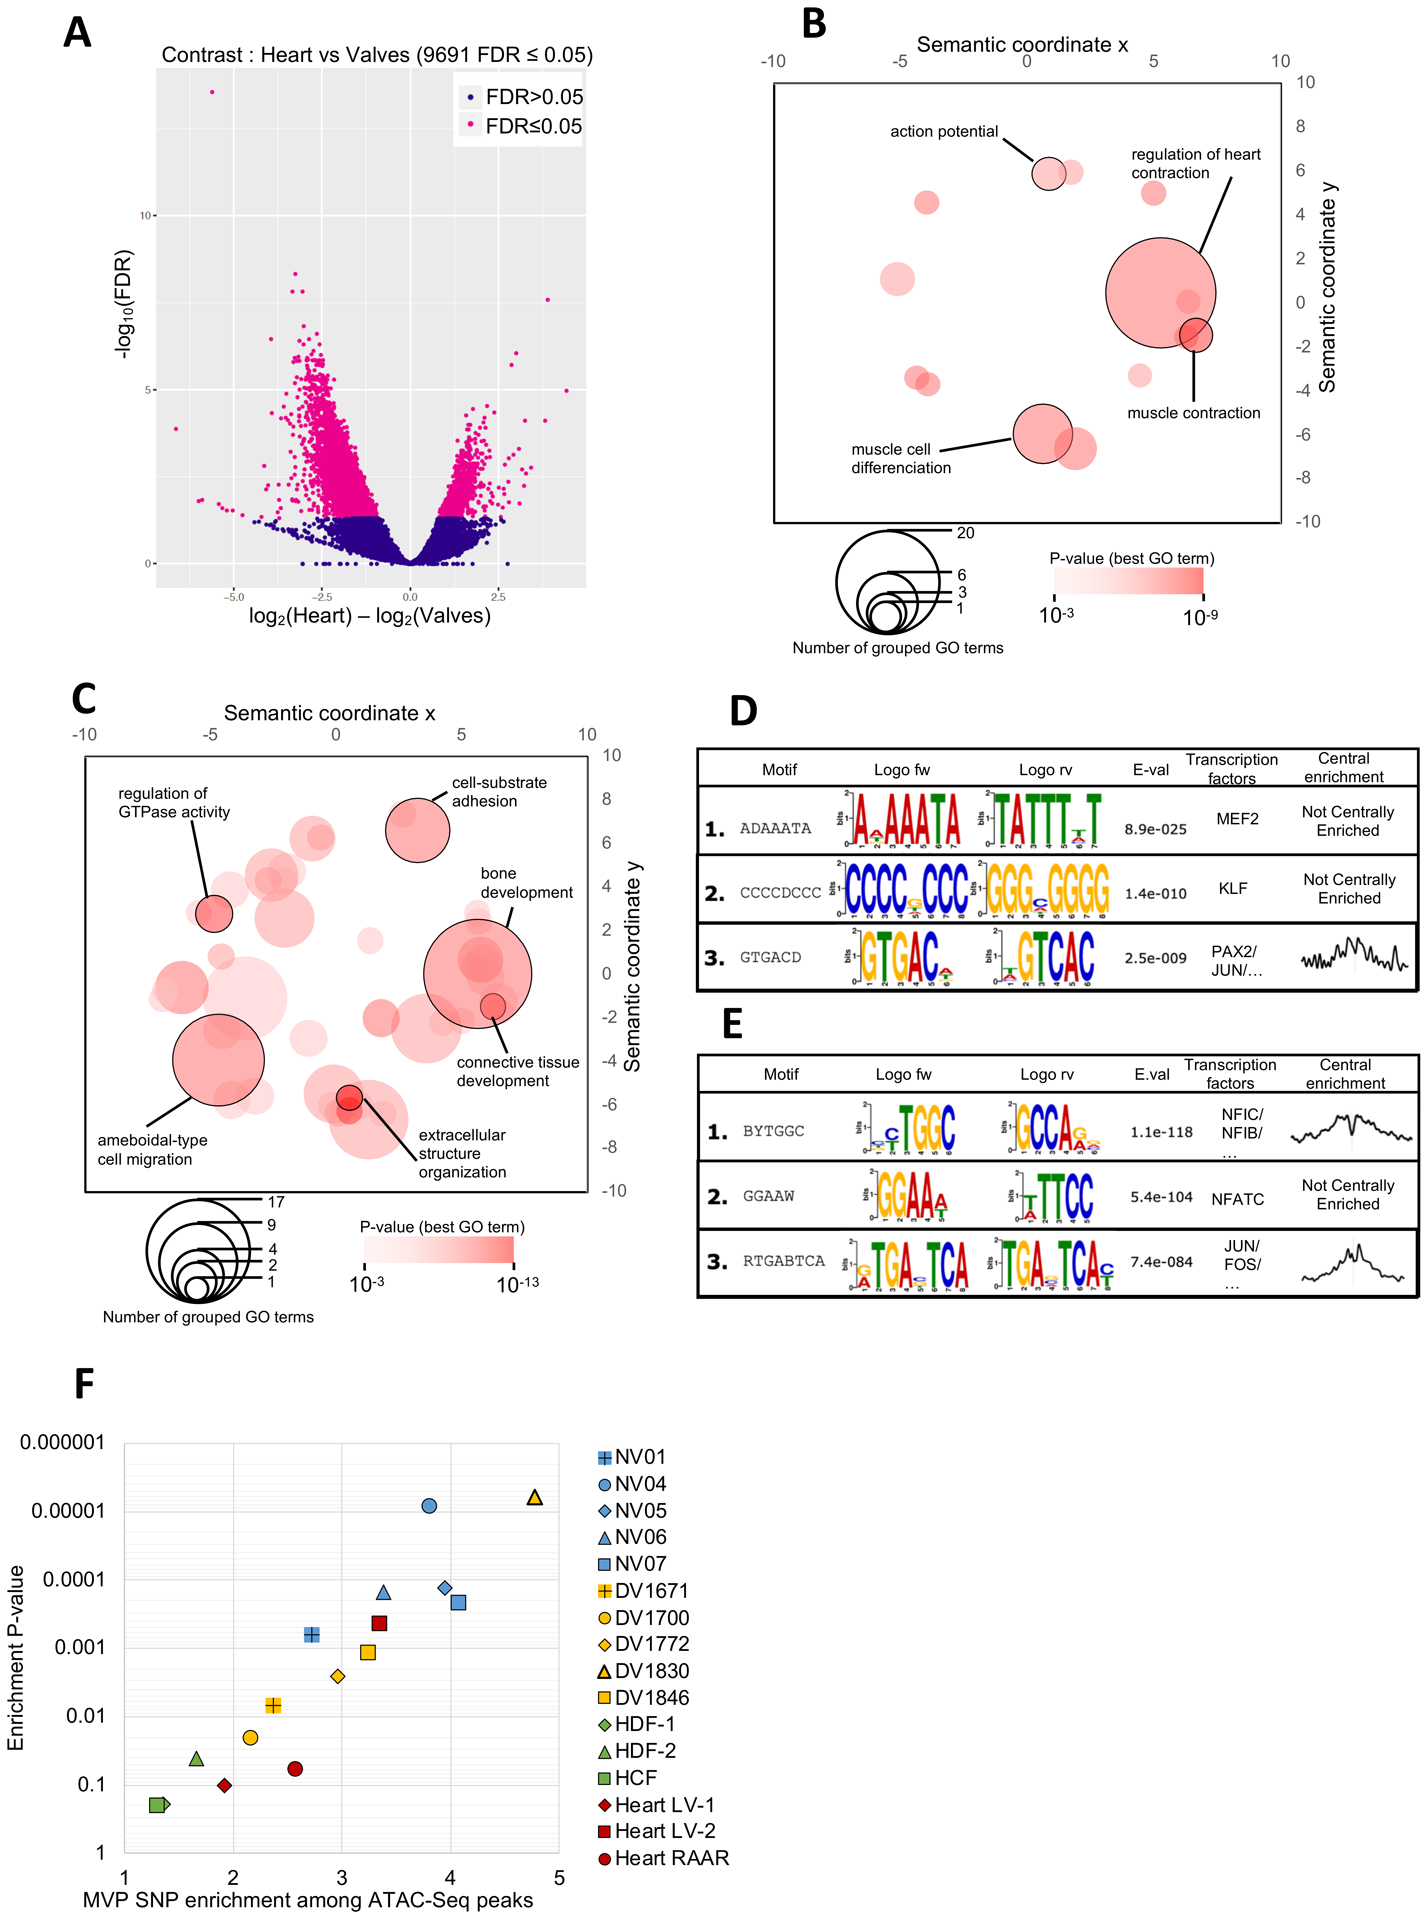
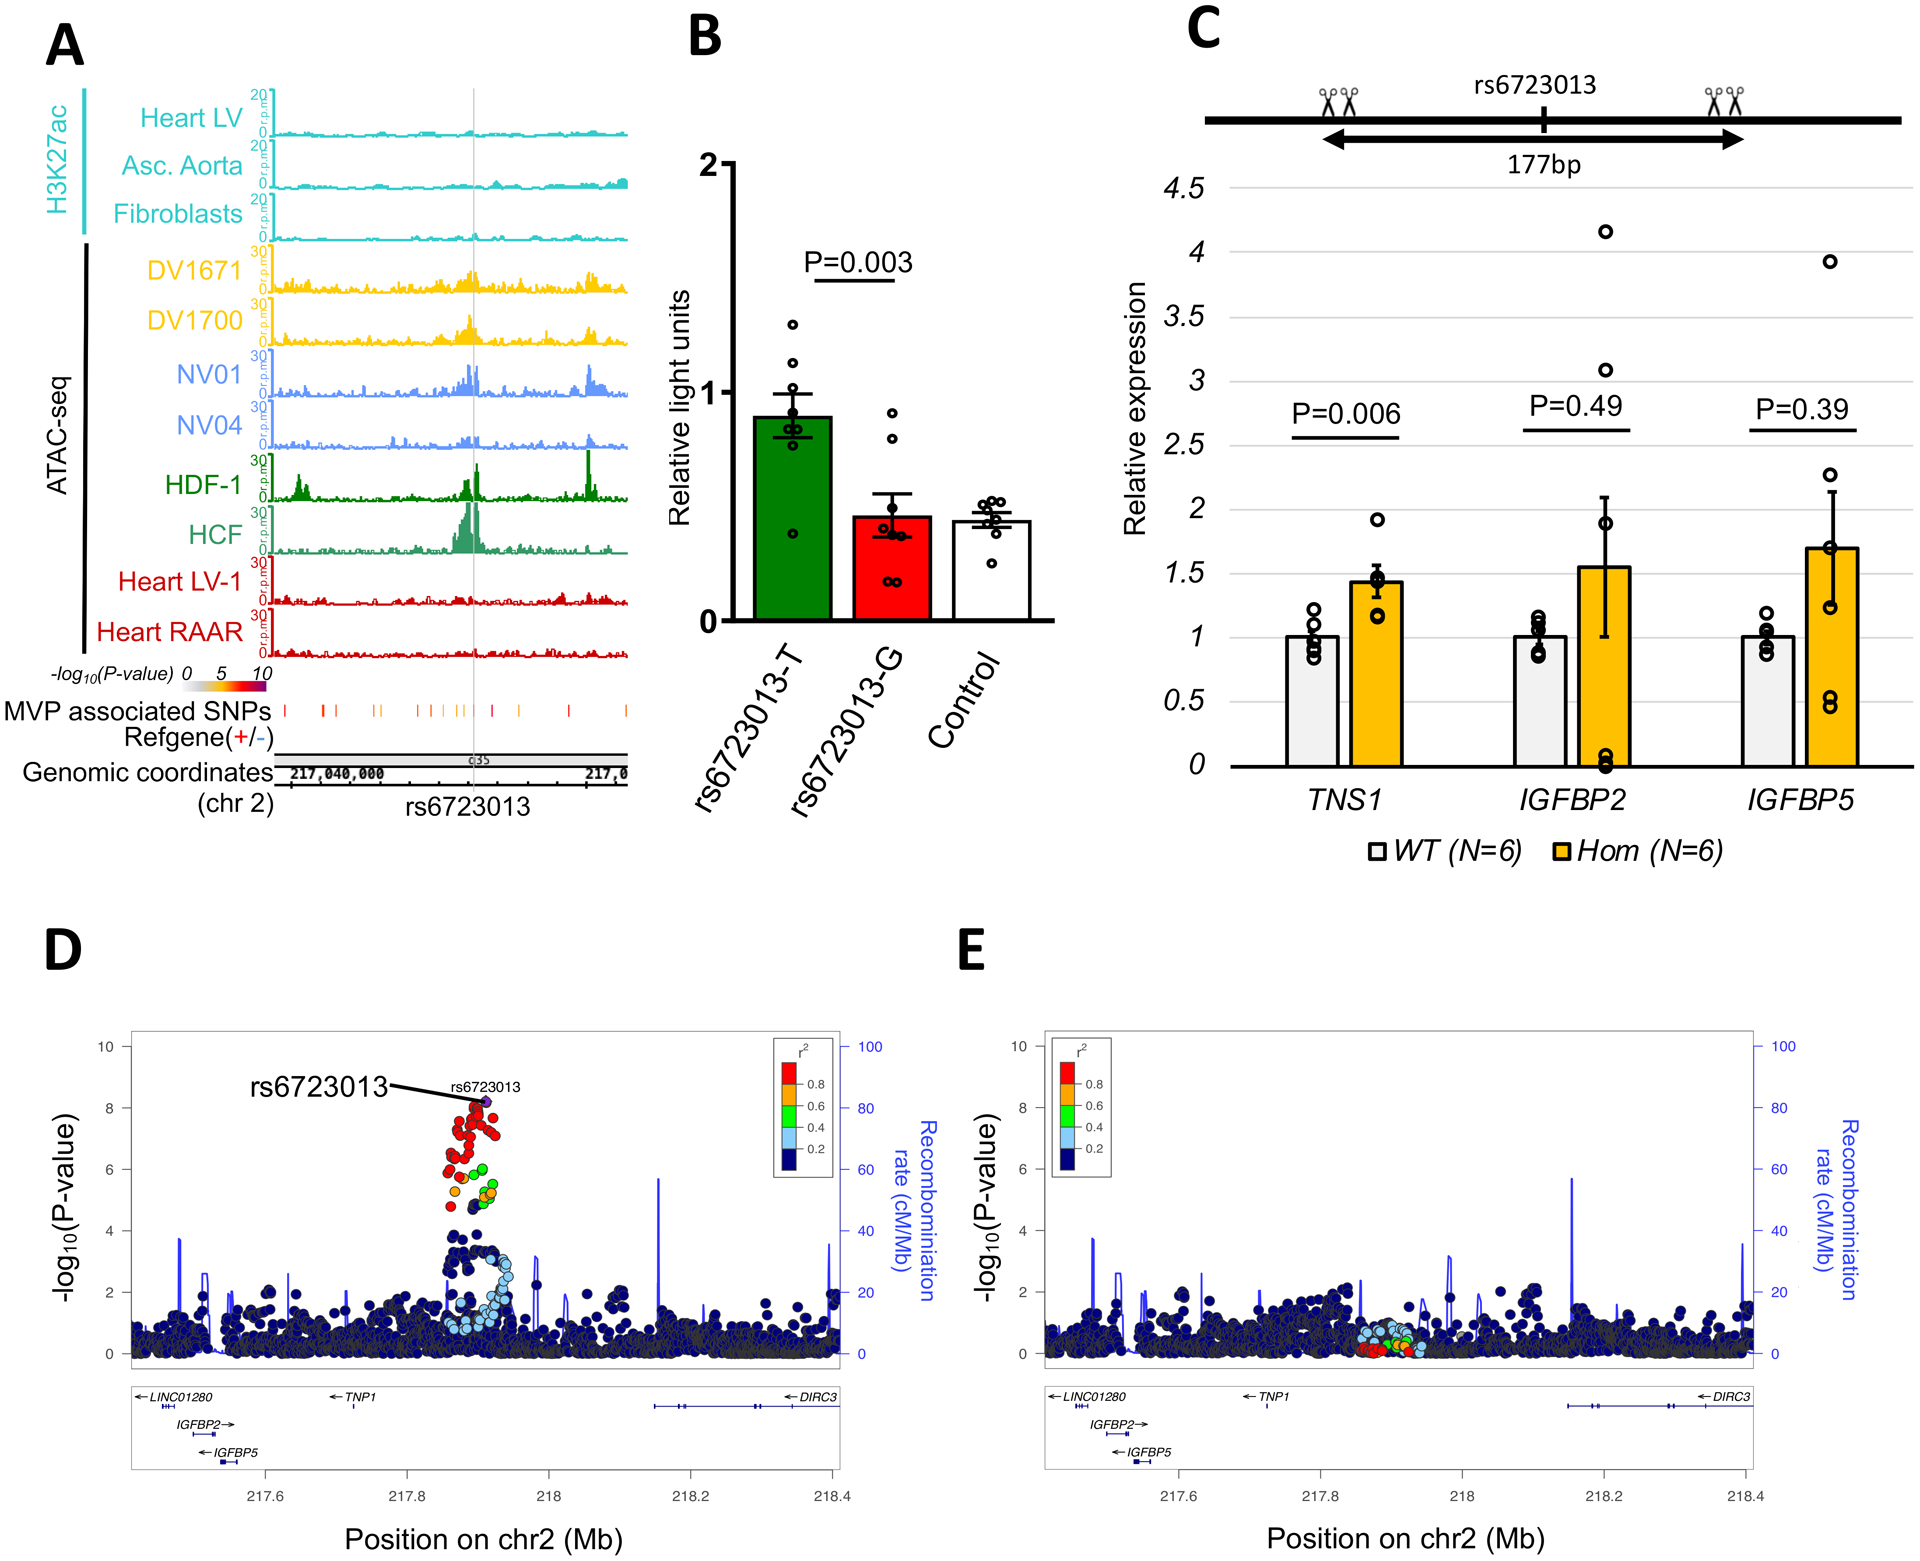
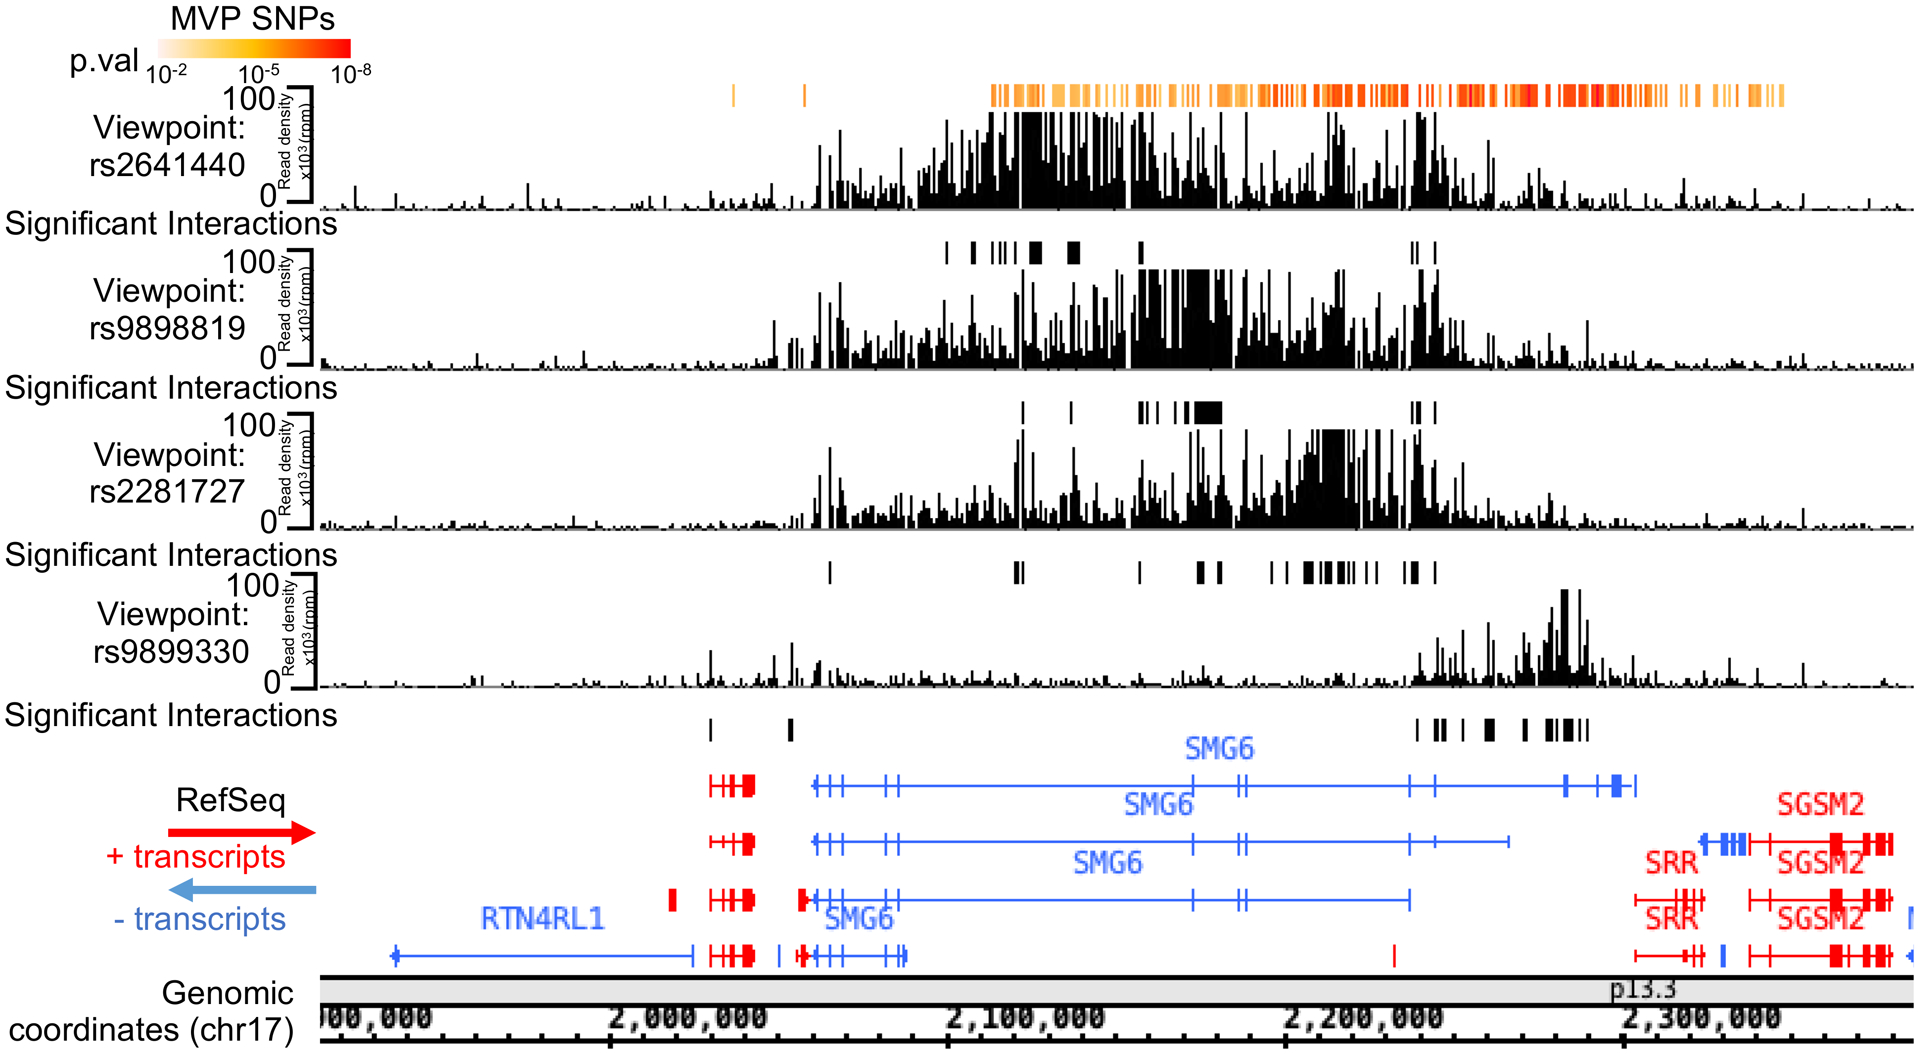
Methods and results: We mapped the open chromatin regions in nuclei from 11 human pathogenic and 7 nonpathogenic mitral valves by an assay for transposase-accessible chromatin with high-throughput sequencing. Open chromatin peaks were globally similar between pathogenic and nonpathogenic valves. Compared with the heart tissue and cardiac fibroblasts, we found that MV-specific assay for transposase-accessible chromatin with high-throughput sequencing peaks are enriched near genes involved in extracellular matrix organization, chondrocyte differentiation, and connective tissue development. One of the most enriched motifs in MV-specific open chromatin peaks was for the nuclear factor of activated T cells family of TFs (transcription factors) involved in valve endocardial and interstitial cell formation. We also found that MVP-associated variants were significantly enriched (P<0.05) in mitral valve open chromatin peaks. Integration of the assay for transposase-accessible chromatin with high-throughput sequencing data with risk loci, extensive functional annotation, and gene reporter assay suggest plausible causal variants for rs2641440 at the SMG6/SRR locus and rs6723013 at the IGFBP2/IGFBP5/TNS1 locus. CRISPR-Cas9 deletion of the sequence including rs6723013 in human fibroblasts correlated with increased expression only for TNS1. Circular chromatin conformation capture followed by high-throughput sequencing experiments provided evidence for several target genes, including SRR, HIC1, and DPH1 at the SMG6/SRR locus and further supported TNS1 as the most likely target gene on chromosome 2.

Conclusions: Here, we describe unprecedented genome-wide open chromatin profiles from human pathogenic and nonpathogenic MVs and report specific gene regulation profiles, compared with the heart. We also report in vitro functional evidence for potential causal variants and target genes at MVP risk loci involving established and new biological mechanisms. Graphic Abstract: A graphic abstract is available for this article.

Keywords: chromatin; extracellular matrix; fibroblast; genome wide association studies; mitral valve prolapse; single nucleotide polymorphism.


Figures

Figure 1.
Figure 1.. Quality controls of mitral valve ATAC-Seq experiments.
A: Number of reads (grey) and number of peaks (orange) obtained for mitral valve ATAC-Seq libraries. B: Spearman correlation and hierarchical clustering of diseased mitral valve ATAC-Seq datasets. C: Representative read density profile of diseased mitral valve ATAC-Seq datasets on a gene rich portion of chr1 (10,000,000 to 20,000,000, hg38 coordinates). E: Spearman correlation and hierarchical clustering of normal mitral valve ATAC-Seq datasets. F: Representative read density profile of normal mitral valve ATAC-Seq datasets on a gene rich portion of chr1 (10,000,000 to 20,000,000, hg38 coordinates).
Figure 2.
Figure 2.. Comparison of mitral valve, heart, and fibroblast cells ATAC-Seq datasets.
A: Number of reads (grey) and number of peaks (orange) obtained for HDF and HCF ATAC-Seq libraries as well as heart tissues: left ventricle (Heart LV) and right atrium auricular region (Heart RAAR) raw reads obtained from ENCODE database. B: Proportion of ATAC-Seq peaks located to different genomic regions. C: Spearman correlation and hierarchical clustering of ATAC-Seq datasets from 10 mitral valve samples, 3 fibroblasts samples, and 3 heart tissue samples from left ventricle (Heart LV) or right atrium auricular region (Heart RAAR). D: Principal Component Analysis of 10 mitral valve, 3 fibroblast, and 3 heart ATAC-Seq datasets. Upper panel shows the position of samples with respect to first 2 principal components. Lower panel indicates the eigenvalues and explained variance of the first 10 principal components.
Figure 3.
Figure 3.. Analysis of ATAC-Seq identifies mitral valve-specific regulatory elements and pathways.
A: Volcano plot representing negative logarithm of enrichment false discovery rate (FDR) on the Y axis and logarithm of enrichment in heart samples over mitral valve samples on the X axis. Each dot represents an ATAC-Seq peak in the mitral valve or heart sample. Pink dots represent significantly enriched regions in mitral valve or heart ATAC-Seq experiments (FDR≤0.05). B-C: Bubble graphs represent GOBP terms enriched among genes at proximity (distance to TSS≤10kb) of heart- (B) and mitral valve- (C) specific peaks. X and Y axes are in arbitrary semantic coordinates. Bubble size represents number of semantically similar terms aggregated under the same index GO term. Bubble color represents the p-value of GO term enrichment for the index GO term. D-E: Motif sequence and logo of most enriched motifs in heart- (D) and mitral valve- (E) specific peaks. Motifs were detected de novo using DREME algorithm (v5.2.0), embedded in MEME-ChIP tool. Top 3 motifs are represented. E-val indicates the erased expected value (E-value) calculated by DREME. “Transcription factors” indicate the top transcription factor or transcription factor family detected by TOMTOM algorithm as possible factors binding the detected motif. “Central enrichment” represents the enrichment of motifs with respect to ATAC-Seq peak summits. F: Representation of MVP SNPs fold-enrichment (X-axis) and enrichment p-value (log scale, Y-axis) among indicated ATAC-Seq samples. MVP SNPs overlap with ATAC-Seq peaks was compared to 500 pools of randomized matched SNPs to calculate the indicated enrichments
Figure 4.
Figure 4.. rs6723013 is a potential causal variant at the IGFBP5/TNS1 MVP-associated locus.
A: Genome browser visualization of ATAC-Seq/Histone ChIP read densities (in reads/million, r.p.m.) in the regions surrounding rs6723013 on chromosome 2. Position of MVP associated variants is indicated below the graph, with color scale representing MVP-association P-value. Asc. Aorta: Ascending Aorta B: Luciferase reporter gene assay comparing the regulatory activity of constructs containing rs6723013-region (T and G alleles) and a control region. ANOVA P-value: 8×10⁻⁴. The p-value of a pairwise t-test, adjusted for multiple testing, comparing luciferase values of rs6723013 alleles is indicated on the graph. C: Relative expression of TNS1, IGFBP2 and IGFBP5 in WT BJ Fibroblast cells (WT, 6 biological replicates) and BJ cells bearing homozygous rs6723013 deletion (Hom, 6 independent clones). mRNA expression was measured using reverse transcription followed by quantitative PCR and normalized to the expression of three housekeeping genes (GAPDH, ACTB and SDHA). P-value indicates the results of a t-test for TNS1, non-parametric test for IGFBP2 and 5, as the distribution of values was not normal. D-E: Conditional analysis at IGFBP5/TNS1 locus. LocusZoom plots represent MVP association before (D) and after (E) conditioning on rs6723013.
Figure 5.
Figure 5.. 4C-Seq analysis of the SMG6/SRR MVP-associated locus.
Interacting fragment density profiles from SNP rs2641440, rs9898819, rs2281727, and rs9899330 viewpoints using 4C-Seq. Fragments in significant interaction with the viewpoint are indicated by black bars under the interaction plot. Genomic coordinates, GRCh38.

Similar articles

Cited by

References

    1. Huk DJ, Austin BF, Horne TE, Hinton RB, Ray WC, Heistad DD, Lincoln J. Valve endothelial cell-derived tgfbeta1 signaling promotes nuclear localization of sox9 in interstitial cells associated with attenuated calcification. Arteriosclerosis, thrombosis, and vascular biology. 2016;36:328–338 - PMC - PubMed
    1. Menon V, Lincoln J. The genetic regulation of aortic valve development and calcific disease. Frontiers in cardiovascular medicine. 2018;5:162. - PMC - PubMed
    1. Shapero K, Wylie-Sears J, Levine RA, Mayer JE Jr., Bischoff J Reciprocal interactions between mitral valve endothelial and interstitial cells reduce endothelial-to-mesenchymal transition and myofibroblastic activation. Journal of molecular and cellular cardiology. 2015;80:175–185 - PMC - PubMed
    1. Hinton RB, Yutzey KE. Heart valve structure and function in development and disease. Annual review of physiology. 2011;73:29–46 - PMC - PubMed
    1. Rabkin-Aikawa E, Farber M, Aikawa M, Schoen FJ. Dynamic and reversible changes of interstitial cell phenotype during remodeling of cardiac valves. The Journal of heart valve disease. 2004;13:841–847 - PubMed

Publication types

MeSH terms