. 2021 Jan 28;22(1):84.
doi: 10.1186/s12864-021-07373-z.

Inferring time series chromatin states for promoter-enhancer pairs based on Hi-C data

Affiliations

Inferring time series chromatin states for promoter-enhancer pairs based on Hi-C data

Henriette Miko et al. BMC Genomics. .

Abstract

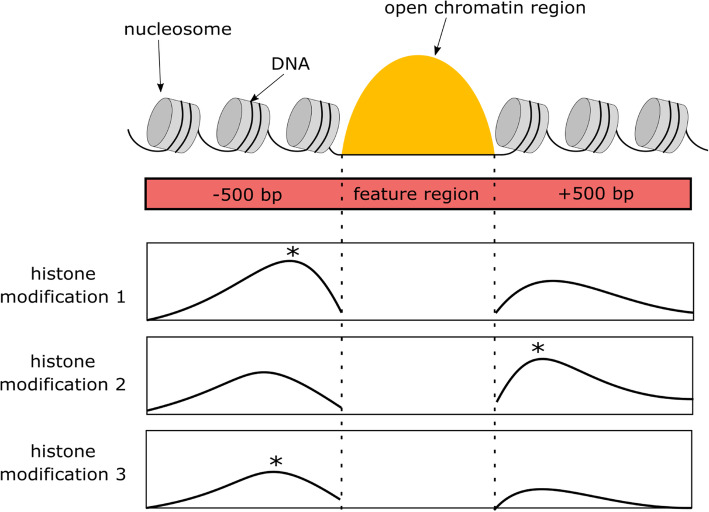
Background: Co-localized combinations of histone modifications ("chromatin states") have been shown to correlate with promoter and enhancer activity. Changes in chromatin states over multiple time points ("chromatin state trajectories") have previously been analyzed at promoter and enhancers separately. With the advent of time series Hi-C data it is now possible to connect promoters and enhancers and to analyze chromatin state trajectories at promoter-enhancer pairs.

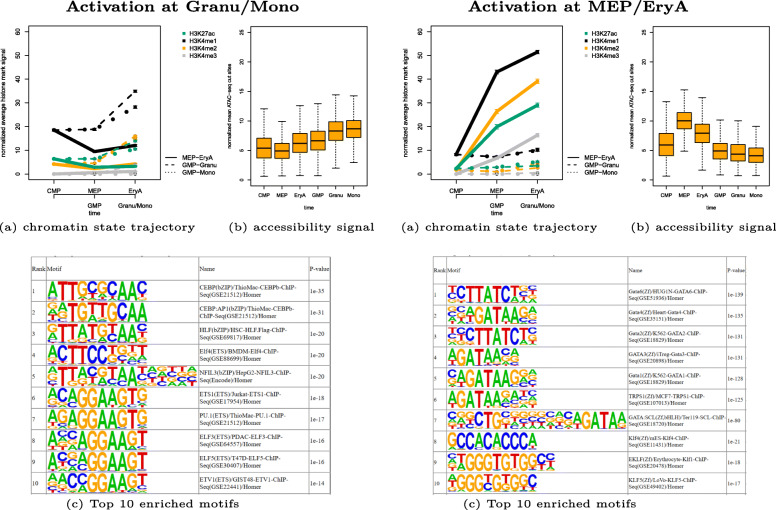
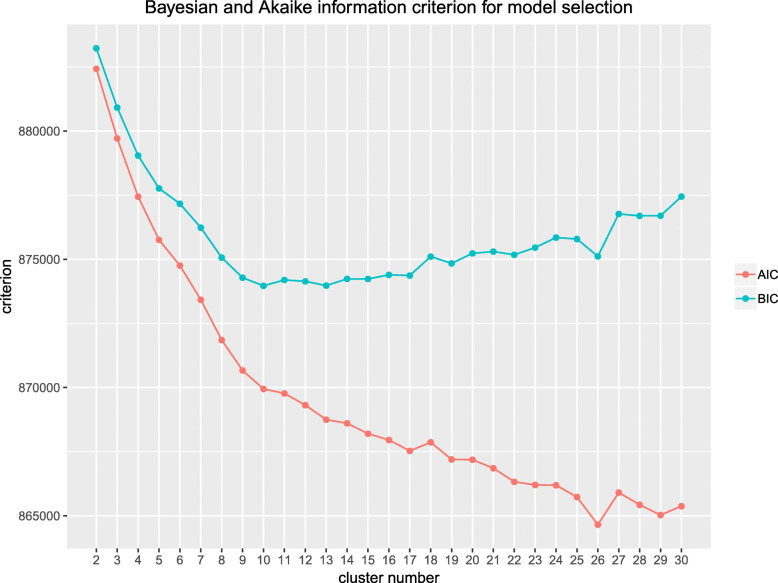
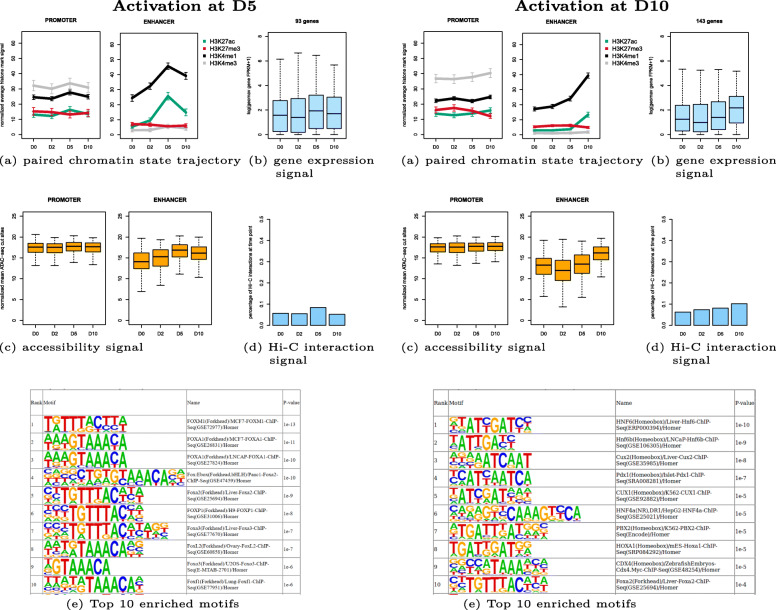
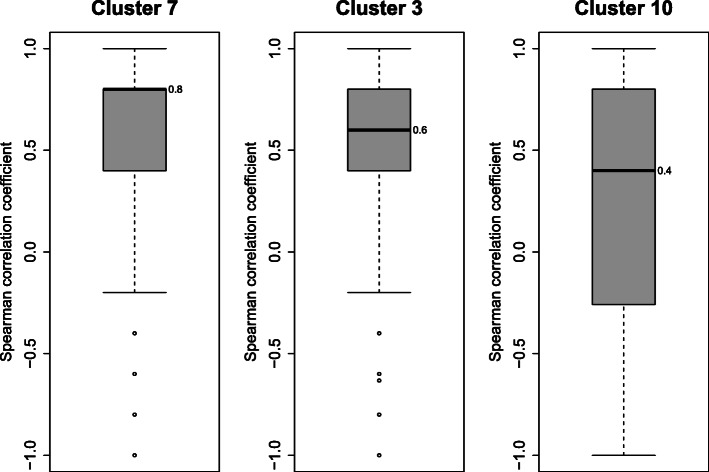
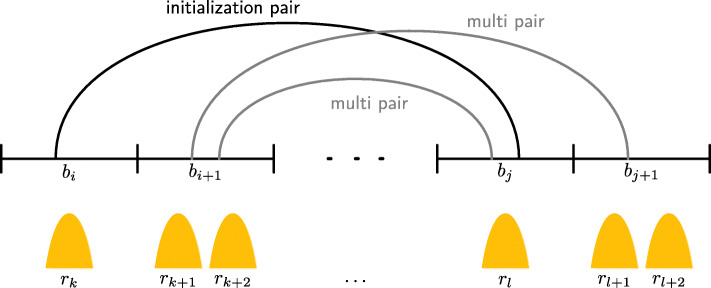
Results: We present TimelessFlex, a framework for investigating chromatin state trajectories at promoters and enhancers and at promoter-enhancer pairs based on Hi-C information. TimelessFlex extends our previous approach Timeless, a Bayesian network for clustering multiple histone modification data sets at promoter and enhancer feature regions. We utilize time series ATAC-seq data measuring open chromatin to define promoters and enhancer candidates. We developed an expectation-maximization algorithm to assign promoters and enhancers to each other based on Hi-C interactions and jointly cluster their feature regions into paired chromatin state trajectories. We find jointly clustered promoter-enhancer pairs showing the same activation patterns on both sides but with a stronger trend at the enhancer side. While the promoter side remains accessible across the time series, the enhancer side becomes dynamically more open towards the gene activation time point. Promoter cluster patterns show strong correlations with gene expression signals, whereas Hi-C signals get only slightly stronger towards activation. The code of the framework is available at https://github.com/henriettemiko/TimelessFlex .

Conclusions: TimelessFlex clusters time series histone modifications at promoter-enhancer pairs based on Hi-C and it can identify distinct chromatin states at promoter and enhancer feature regions and their changes over time.

Keywords: Chromatin immunoprecipitation; Differentiation; Enhancer; Gene regulation; Hi-C; Histone modifications.


Conflict of interest statement

The authors declare that they have no competing interests.

Figures

Fig. 1
Fig. 1
Schematic of mouse hematopoietic differentiation. Six time points of mouse hematopoiesis: common myeloid progenitor (CMP), megakaryocyte erythroid progenitor (MEP), granulocyte macrophage progenitor (GMP), erythrocyte A (EryA), granulocyte (Granu), monocyte (Mono) [19]
Fig. 2
Fig. 2
Toy example of a feature region and histone mark signals over it. Top: A feature region (red) is defined as a window around an open chromatin region with 500 bp extension from the edges. Bottom: Three histone modification signals over the feature region are shown. For each histone modification, the maximum signal (*) is computed
Fig. 3
Fig. 3
Example clusters of enhancer feature regions during mouse hematopoiesis. Left: activation at Granu/Mono (cluster 11 with 2480 feature regions), right: activation at MEP/EryA (cluster 7 with 983 feature regions), a shows chromatin state trajectory, b accessibility signal from ATAC-seq, c Top 10 known enriched motifs by HOMER
Fig. 4
Fig. 4
Schematic of human pancreatic differentiation system. Four time points of human pancreatic differentiation: day 0 (D0) human embryonic stem cells (ES cells), day 2 (D2) definitive endoderm (DE), day 5 (D5) primitive gut tube (GT), day 10 (D10) pancreatic endoderm (PE) [20, 21]
Fig. 5
Fig. 5
Example clusters of enhancer feature regions during human pancreatic differentiation. Left: activation at D5 (cluster 6 with 1431 feature regions), right: activation at D10 (cluster 5 with 1451 feature regions), a shows chromatin state trajectory, b accessibility signal from ATAC-seq, c Top 10 known enriched motifs by HOMER
Fig. 6
Fig. 6
Model selection for clustering of promoter-enhancer initialization feature pairs during human pancreatic differentiation. Bayesian information criterion (BIC) and Akaike information criterion (AIC) are computed in the range of 2 to 30 clusters to decide on the number of clusters for the initialization feature pairs. Cluster number 10 is the minimum of the BIC in the investigated range and therefore chosen as cluster number
Fig. 7
Fig. 7
Example clusters of initialization promoter-enhancer feature pairs during human pancreatic differentiation. Left: activation at D5 (cluster 7 with 226 initialization feature pairs), right: activation at D10 (cluster 3 with 282 initialization feature pairs), a shows paired chromatin state trajectory, b gene expression signal from RNA-seq, c accessibility signal from ATAC-seq, d interaction signal from Hi-C, e Top 10 known enriched motifs by HOMER
Fig. 8
Fig. 8
Spearman correlation of H3K27ac signal and ATAC-seq signal for enhancer clusters. For clusters 7, 3 and noise cluster 10 the Spearman correlation coefficient was computed between H3K27ac signal and ATAC-seq signal for each feature region. For clusters 7 and 3 the correlation is higher than for the noise cluster 10
Fig. 9
Fig. 9
Comparison of gene expression signals for closest TSS and Hi-C supported genes. Gene expression signal from RNA-seq for (a) genes with closest TSSs to enhancers in cluster 7 and 3 from initialization pairs and for (b) Hi-C supported assigned genes
Fig. 10
Fig. 10
Example clusters of multi promoter-enhancer feature pairs during human pancreatic differentiation. Only the selected multi regions are plotted. Left: activation at D5 (cluster 7 with 225 multi feature pairs), right: activation at D10 (cluster 3 with 255 multi feature pairs), a shows paired chromatin state trajectory, b gene expression signal from RNA-seq, c accessibility signal from ATAC-seq, d interaction signal from Hi-C
Fig. 11
Fig. 11
Overview of steps and employed data types in TimelessFlex. The framework TimelessFlex consists of 3 steps (regions definition, clustering and validation step) in which multiple data types are employed
Fig. 12
Fig. 12
Schematic of initialization and multi pairs from Hi-C data. Initialization (black) and multi (gray) pairs are shown with Hi-C bins bs and open chromatin regions rt (yellow). Assignment of pairs leads to initialization pair (bi, bj) and multi pairs (bi+1, bj) and (bi+1, bj+1)
Fig. 13
Fig. 13
DAGs of Bayesian network for clustering feature regions (top) and promoter-enhancer feature pairs (bottom). Colors represent different histone modifications (green: H3K27ac, red: H3K27me3, black: H3K4me1, orange: H3K4me2, gray: H3K4me3). For clustering of feature regions from mouse hematopoiesis data (top) there are 4 histone modifications and 5 time intervals, therefore the DAG consists of 21 nodes. For clustering of promoter-enhancer feature pairs from human pancreatic differentiation (bottom) there are 4 histone modifications and 3 time intervals resulting in 25 nodes. One half of the continuous nodes represents histone mark signals of the promoter side and the other half represents histone mark signals of the enhancer side

Similar articles

Cited by

References

    1. ENCODE Project Consortium An integrated encyclopedia of DNA elements in the human genome. Nature. 2012;489(7414):57. doi: 10.1038/nature11247. - DOI - PMC - PubMed
    1. Ernst J, Kellis M. ChromHMM: automating chromatin-state discovery and characterization. Nat Methods. 2012;9(3):215. doi: 10.1038/nmeth.1906. - DOI - PMC - PubMed
    1. Hoffman MM, Buske OJ, Wang J, Weng Z, Bilmes JA, Noble WS. Unsupervised pattern discovery in human chromatin structure through genomic segmentation. Nat Methods. 2012;9(5):473–476. doi: 10.1038/nmeth.1937. - DOI - PMC - PubMed
    1. Libbrecht MW, Ay F, Hoffman MM, Gilbert DM, Bilmes JA, Noble WS. Joint annotation of chromatin state and chromatin conformation reveals relationships among domain types and identifies domains of cell type-specific expression. Genome Res. 2015;25(4):544–557. doi: 10.1101/gr.184341.114. - DOI - PMC - PubMed
    1. Zeng X, Sanalkumar R, Bresnick EH, Li H, Chang Q, Keleş S. jMOSAiCS: joint analysis of multiple ChIP-seq datasets. Genome Biology. 2013;14(4):38. doi: 10.1186/gb-2013-14-4-r38. - DOI - PMC - PubMed