

Spatial variation in lymphatic filariasis risk factors of hotspot zones in Ghana
- PMID: 33509140
- PMCID: PMC7841995
- DOI: 10.1186/s12889-021-10234-9
Spatial variation in lymphatic filariasis risk factors of hotspot zones in Ghana
Abstract
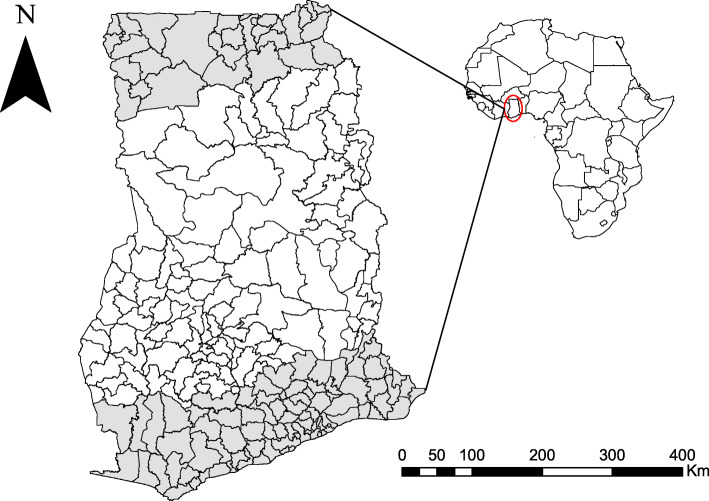
Background: Lymphatic Filariasis (LF), a parasitic nematode infection, poses a huge economic burden to affected countries. LF endemicity is localized and its prevalence is spatially heterogeneous. In Ghana, there exists differences in LF prevalence and multiplicity of symptoms in the country's northern and southern parts. Species distribution models (SDMs) have been utilized to explore the suite of risk factors that influence the transmission of LF in these geographically distinct regions.
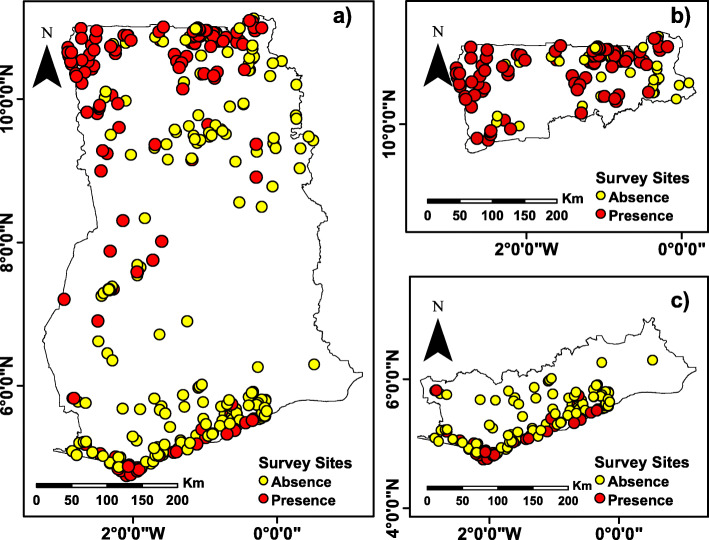
Methods: Presence-absence records of microfilaria (mf) cases were stratified into northern and southern zones and used to run SDMs, while climate, socioeconomic, and land cover variables provided explanatory information. Generalized Linear Model (GLM), Generalized Boosted Model (GBM), Artificial Neural Network (ANN), Surface Range Envelope (SRE), Multivariate Adaptive Regression Splines (MARS), and Random Forests (RF) algorithms were run for both study zones and also for the entire country for comparison.
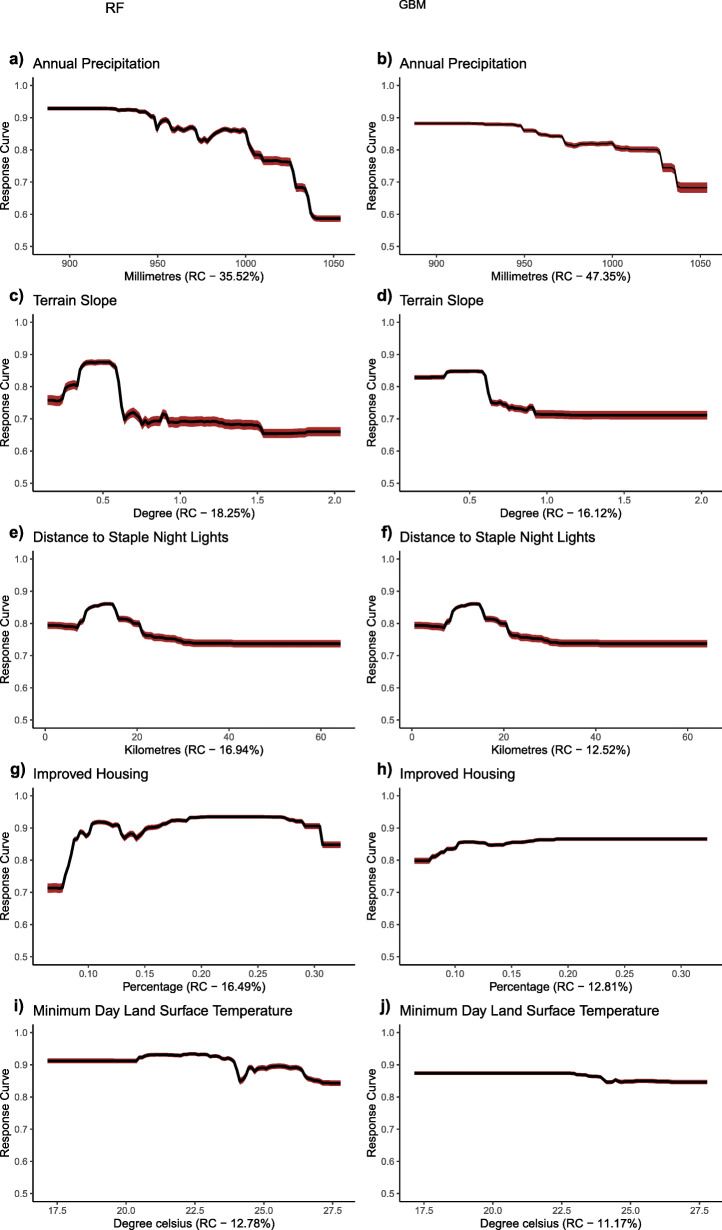
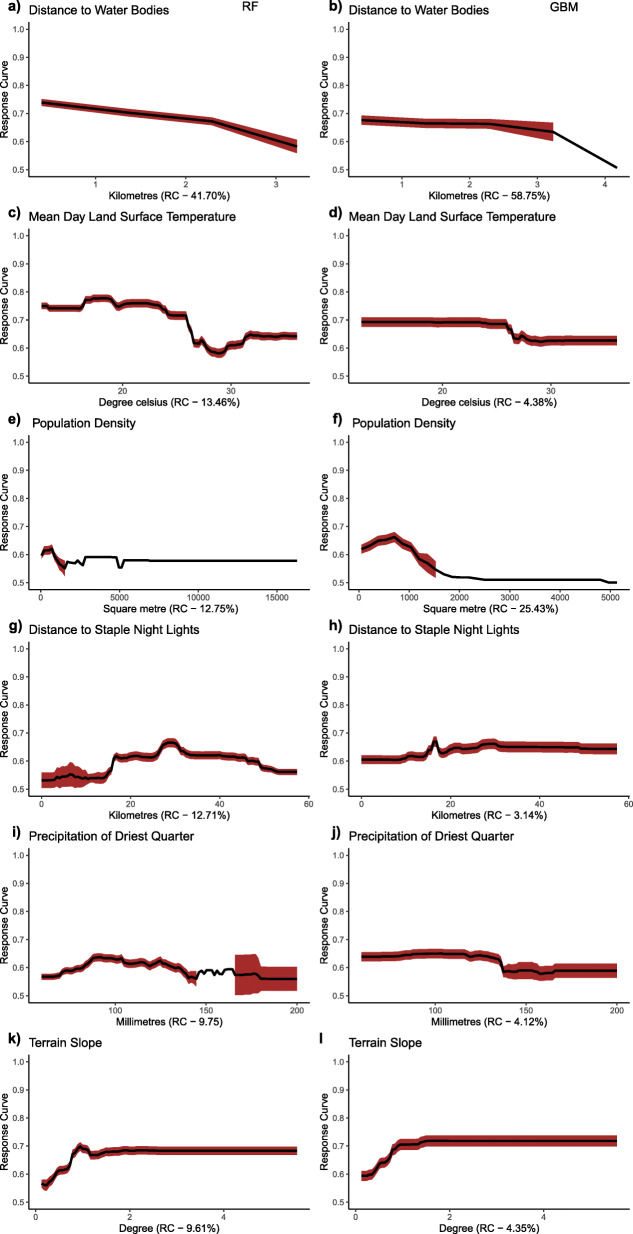
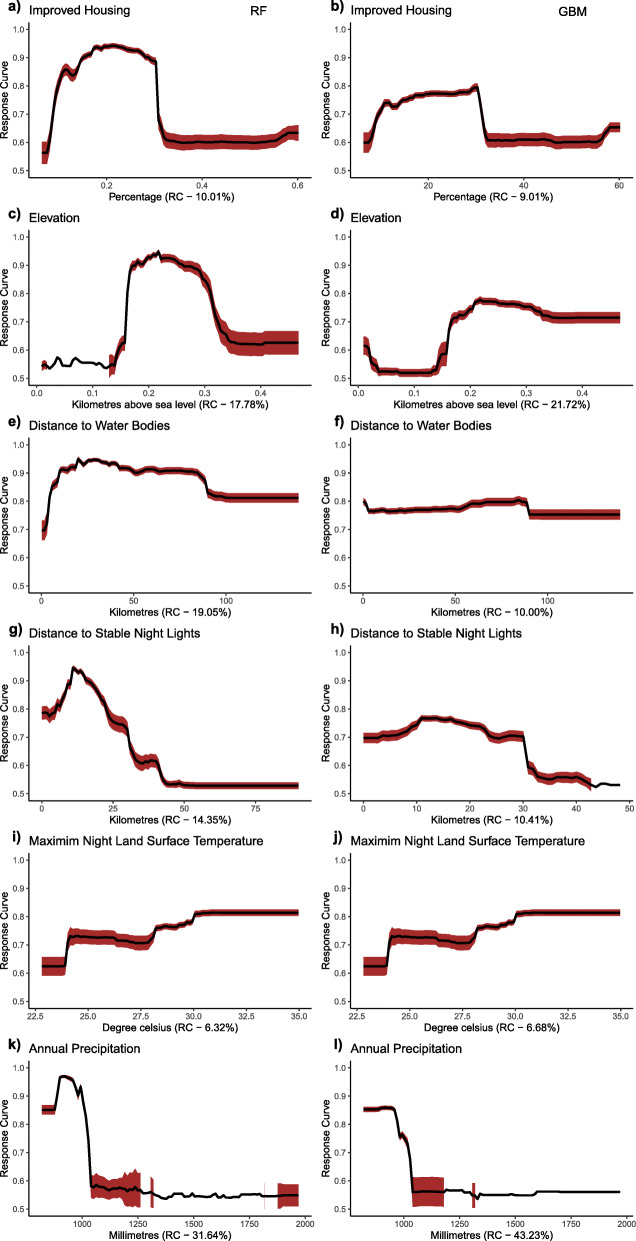
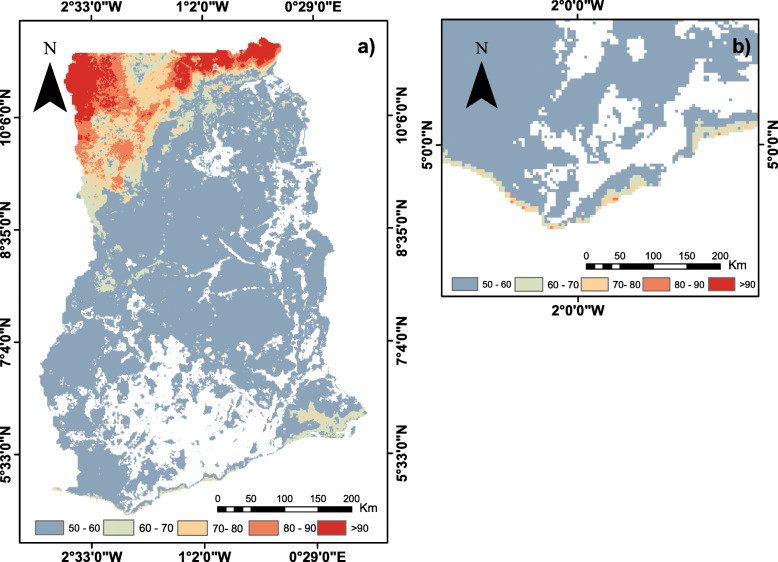
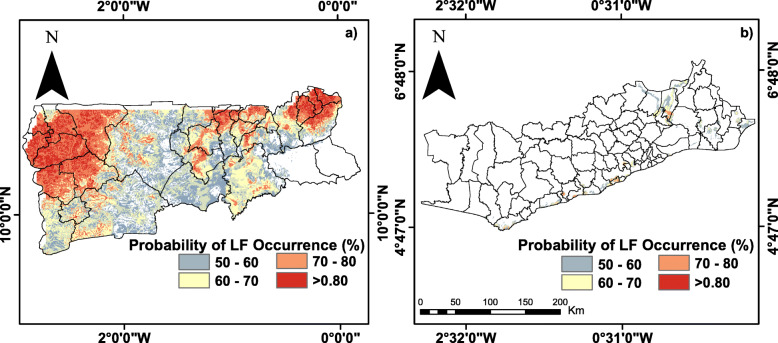
Results: Best model quality was obtained with RF and GBM algorithms with the highest Area under the Curve (AUC) of 0.98 and 0.95, respectively. The models predicted high suitable environments for LF transmission in the short grass savanna (northern) and coastal (southern) areas of Ghana. Mainly, land cover and socioeconomic variables such as proximity to inland water bodies and population density uniquely influenced LF transmission in the south. At the same time, poor housing was a distinctive risk factor in the north. Precipitation, temperature, slope, and poverty were common risk factors but with subtle variations in response values, which were confirmed by the countrywide model.
Conclusions: This study has demonstrated that different variable combinations influence the occurrence of lymphatic filariasis in northern and southern Ghana. Thus, an understanding of the geographic distinctness in risk factors is required to inform on the development of area-specific transmission control systems towards LF elimination in Ghana and internationally.
Keywords: Ecological niche modelling; Ensemble modelling; Generalised boosted model (GBM); Lymphatic filariasis; Machine learning; Random forest (RF).
Conflict of interest statement
The authors declare that they have no competing interests.
Figures
References
-
- Booth, T. H. et al. (2014) ‘BIOCLIM: the first species distribution modelling package, its early applications and relevance to most current MAXENT studies’, Diversity and Distributionsversity, pp 1–9. doi: 10.1111/ddi.12144.
-
- Breiman L. ST4_Method_Random_Forest. Mach Learn. 2001;45(1):5–32. doi: 10.1017/CBO9781107415324.004. - DOI
MeSH terms
LinkOut - more resources
Full Text Sources
Other Literature Sources
Miscellaneous
