

Development and validation of prognostic markers in sarcomas base on a multi-omics analysis
- PMID: 33509178
- PMCID: PMC7841904
- DOI: 10.1186/s12920-021-00876-4
Development and validation of prognostic markers in sarcomas base on a multi-omics analysis
Abstract
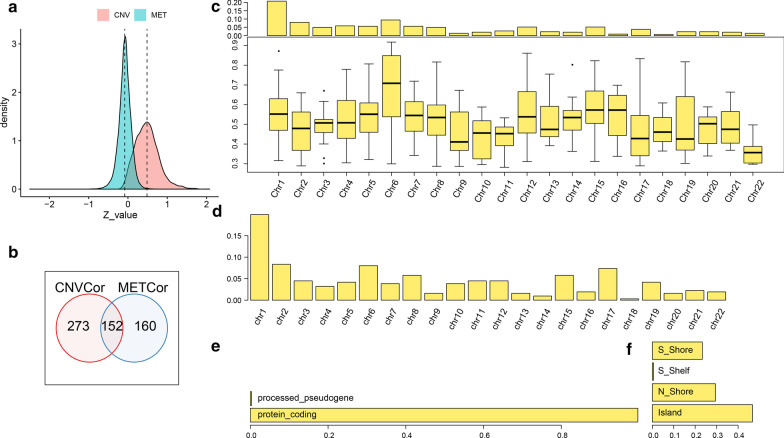
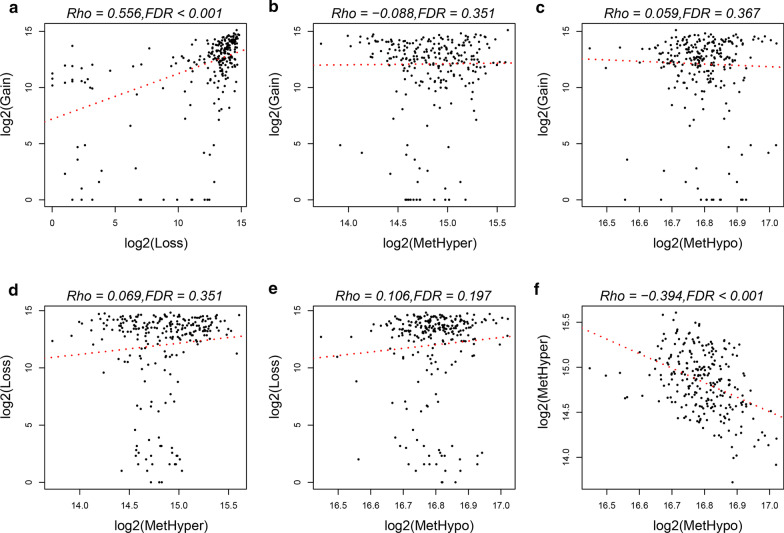
Background: In sarcomas, the DNA copy number and DNA methylation exhibit genomic aberrations. Transcriptome imbalances play a driving role in the heterogeneous progression of sarcomas. However, it is still unclear whether abnormalities of DNA copy numbers are systematically related to epigenetic DNA methylation, thus, a comprehensive analysis of sarcoma occurrence and development from the perspective of epigenetic and genomics is required.
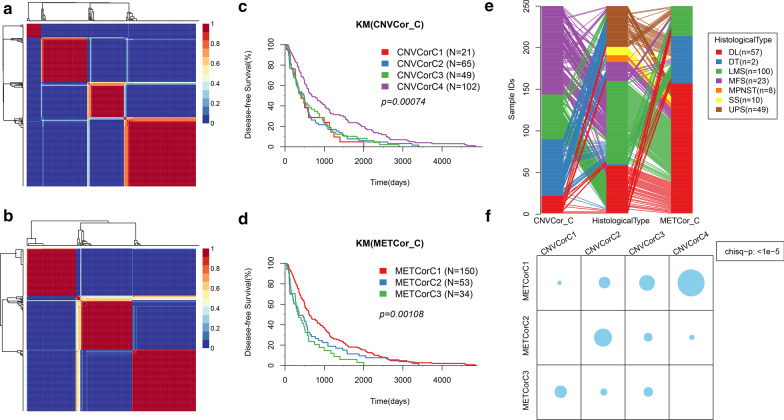
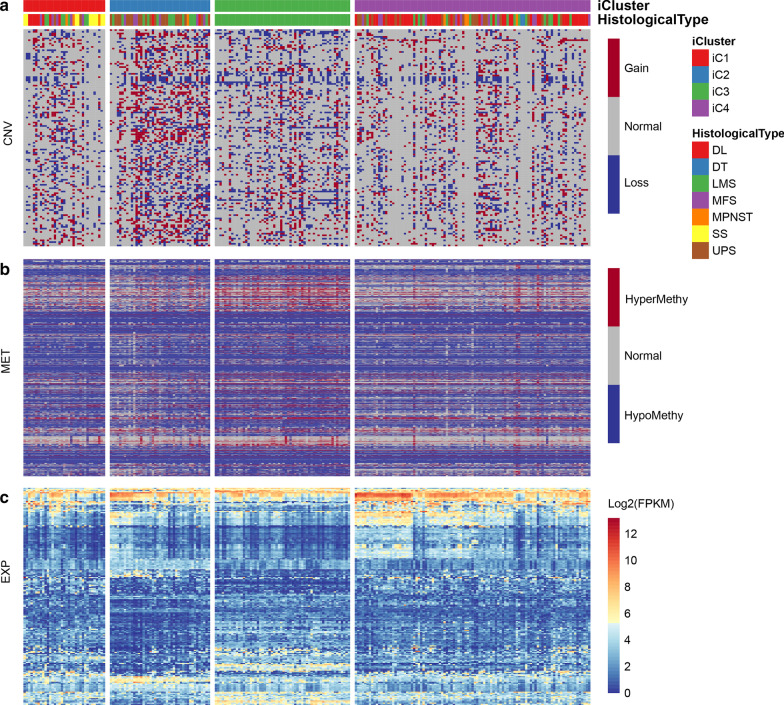
Methods: RNASeq, copy number variation (CNV), methylation data, clinical follow-up information were obtained from The Cancer Genome Atlas (TCGA) and GEO database. The association between methylation and CNV was analyzed to further identify methylation-related genes (MET-Gs) and CNV abnormality-related genes (CNV-Gs). Subsequently DNA copy number, methylation, and gene expression data associated with the MET-Gs and CNV-Gs were integrated to determine molecular subtypes and clinical and molecular characteristics of molecular subtypes. Finally, key biomarkers were determined and validated in independent validation sets.
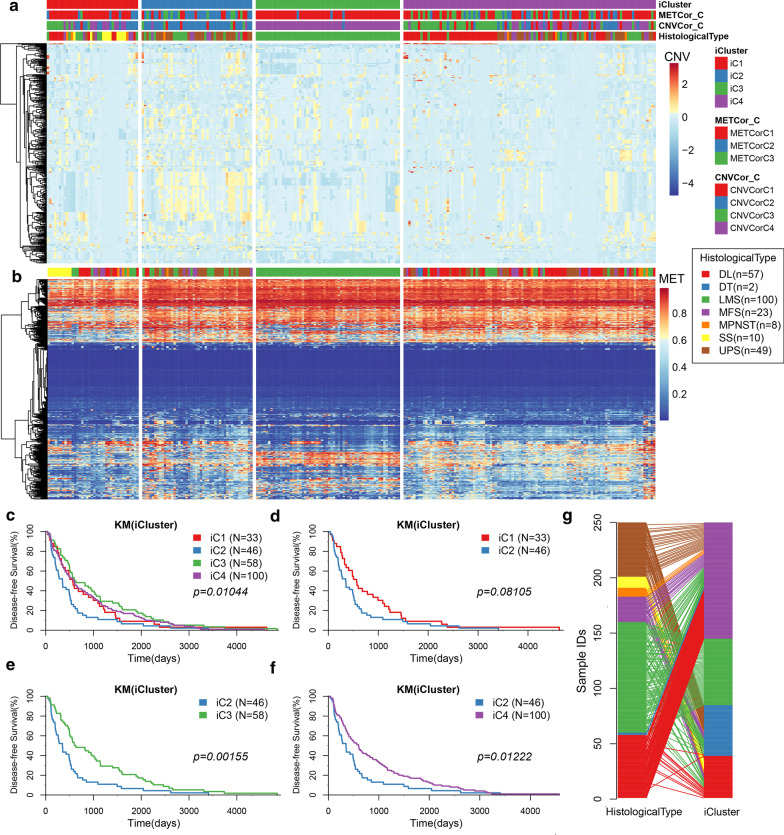
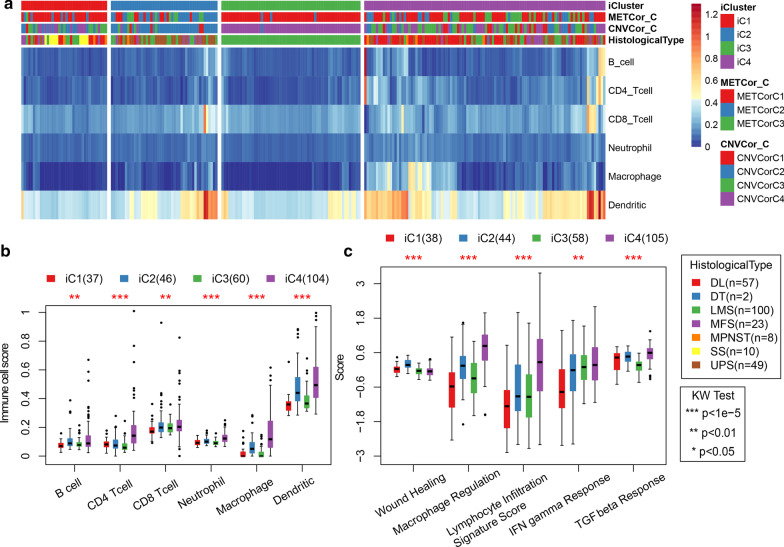
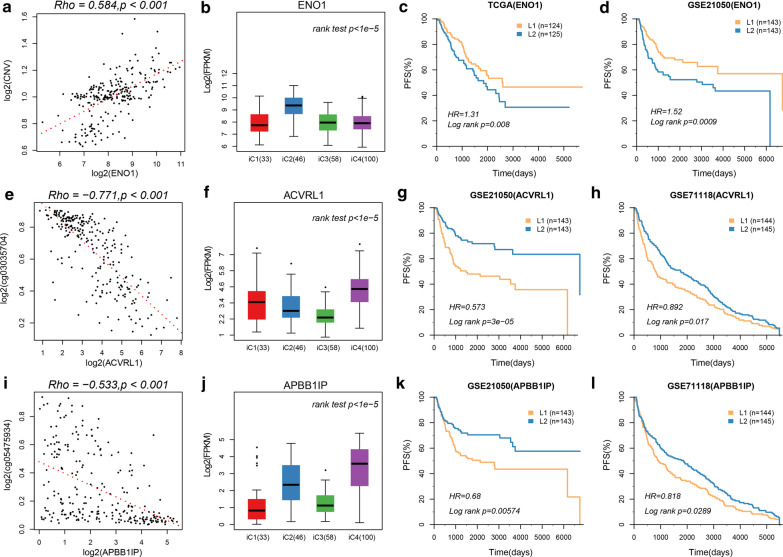
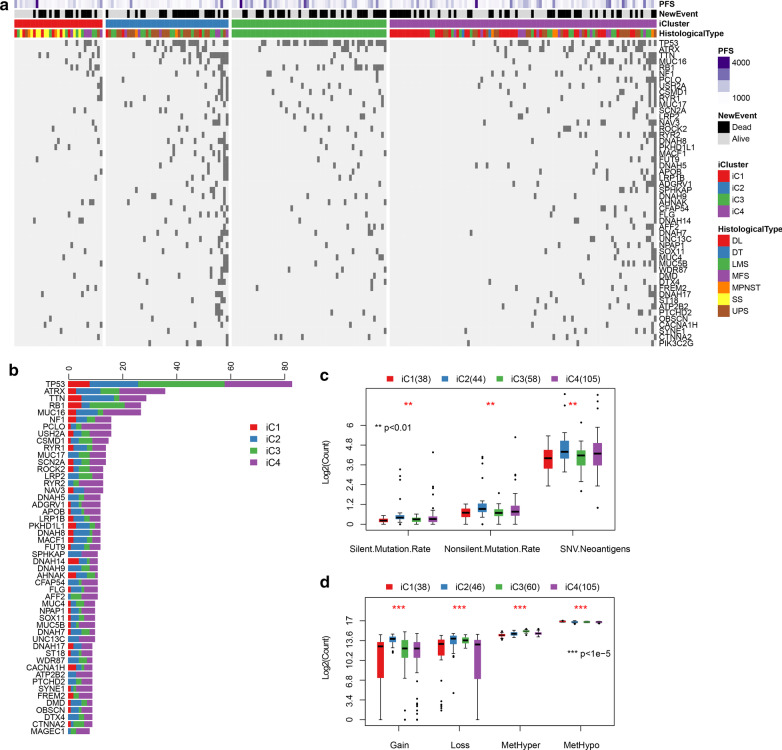
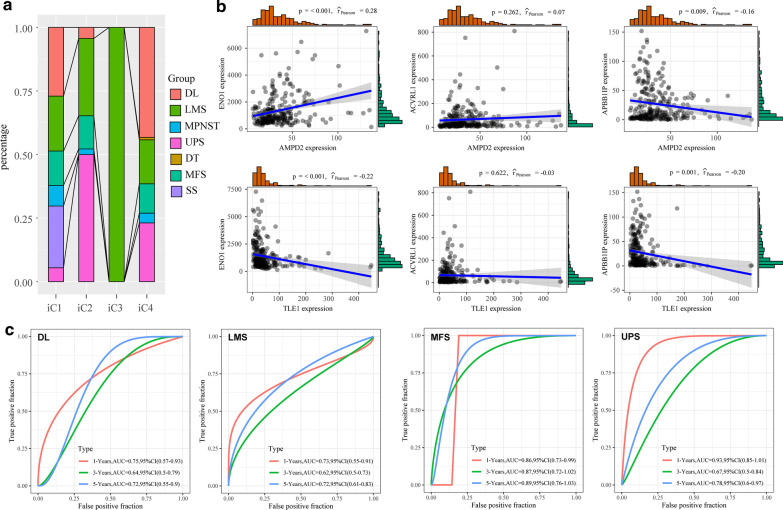
Results: A total of 5354 CNV-Gs and 4042 MET-Gs were screened and showed a high degree of consistency. Four molecular subtypes (iC1, iC2, iC3, and iC4) with different prognostic significances were identified by multiomics cluster analysis, specifically, iC2 had the worst prognosis and iC4 indicated an immune-enhancing state. Three potential prognostic markers (ENO1, ACVRL1 and APBB1IP) were determined after comparing the molecular characteristics of the four molecular subtypes. The expression of ENO1 gene was significantly correlated with CNV, and was noticeably higher in iC2 subtype with the worst prognosis than any other subtypes. The expressions of ACVRL1 and APBB1IP were negatively correlated with methylation, and were high-expressed in the iC4 subtype with the most favorable prognosis. In addition, the number of silent/nonsilent mutations and neoantigens in iC2 subtype were significantly more than those in iC1/iC3/iC4 subtype, and the same trend was also observed in CNV Gain/Loss.
Conclusion: The current comprehensive analysis of genomic and epigenomic regulation provides new insights into multilayered pathobiology of sarcomas. Four molecular subtypes and three prognostic markers developed in this study improve the current understanding of the molecular mechanisms underlying sarcoma.
Keywords: Bioinformatics; CNV; Methylation; Sarcomas; TCGA.
Conflict of interest statement
The authors declare no conflicts of interest.
Figures
Similar articles
-
Multi-omics analysis at epigenomics and transcriptomics levels reveals prognostic subtypes of lung squamous cell carcinoma.Biomed Pharmacother. 2020 May;125:109859. doi: 10.1016/j.biopha.2020.109859. Epub 2020 Feb 7. Biomed Pharmacother. 2020. PMID: 32036209
-
Integrative analysis of genomic, epigenomic and transcriptomic data identified molecular subtypes of esophageal carcinoma.Aging (Albany NY). 2021 Feb 26;13(5):6999-7019. doi: 10.18632/aging.202556. Epub 2021 Feb 26. Aging (Albany NY). 2021. PMID: 33638948 Free PMC article.
-
Integrative analysis of genomic and epigenetic regulation of endometrial cancer.Aging (Albany NY). 2020 May 15;12(10):9260-9274. doi: 10.18632/aging.103202. Epub 2020 May 15. Aging (Albany NY). 2020. PMID: 32412912 Free PMC article.
-
DNA methylation episignatures: insight into copy number variation.Epigenomics. 2022 Nov;14(21):1373-1388. doi: 10.2217/epi-2022-0287. Epub 2022 Dec 20. Epigenomics. 2022. PMID: 36537268 Review.
-
Predictive and prognostic transcriptomic biomarkers in soft tissue sarcomas.NPJ Precis Oncol. 2021 Mar 5;5(1):17. doi: 10.1038/s41698-021-00157-4. NPJ Precis Oncol. 2021. PMID: 33674685 Free PMC article. Review.
Cited by
-
Application of Multi-Omics Approach in Sarcomas: A Tool for Studying Mechanism, Biomarkers, and Therapeutic Targets.Front Oncol. 2022 Jul 8;12:946022. doi: 10.3389/fonc.2022.946022. eCollection 2022. Front Oncol. 2022. PMID: 35875106 Free PMC article. Review.
-
Role of ENO1 and its targeted therapy in tumors.J Transl Med. 2024 Nov 14;22(1):1025. doi: 10.1186/s12967-024-05847-8. J Transl Med. 2024. PMID: 39543641 Free PMC article. Review.
-
Prediction tools for the personalized management of soft-tissue sarcomas of the extremity.Bone Joint J. 2022 Sep;104-B(9):1011-1016. doi: 10.1302/0301-620X.104B9.BJJ-2022-0647. Bone Joint J. 2022. PMID: 36047022 Free PMC article. Review.
-
Multi-omics assessment of dilated cardiomyopathy using non-negative matrix factorization.PLoS One. 2022 Aug 18;17(8):e0272093. doi: 10.1371/journal.pone.0272093. eCollection 2022. PLoS One. 2022. PMID: 35980883 Free PMC article.
-
On the Relevance of Soft Tissue Sarcomas Metabolic Landscape Mapping.Int J Mol Sci. 2022 Sep 28;23(19):11430. doi: 10.3390/ijms231911430. Int J Mol Sci. 2022. PMID: 36232732 Free PMC article. Review.
References
-
- Blay JY, van Glabbeke M, Verweij J, van Oosterom AT, Le Cesne A, Oosterhuis JW, et al. Advanced soft-tissue sarcoma: a disease that is potentially curable for a subset of patients treated with chemotherapy. Eur J Cancer (Oxford, England) 2003;39(1):64–69. doi: 10.1016/S0959-8049(02)00480-X. - DOI - PubMed
MeSH terms
Substances
Grants and funding
LinkOut - more resources
Full Text Sources
Other Literature Sources
Medical
Miscellaneous
