. 2021 Jan 28;13(1):13.
doi: 10.1186/s13073-021-00828-8.

Highly elevated polygenic risk scores are better predictors of myocardial infarction risk early in life than later

Affiliations

Highly elevated polygenic risk scores are better predictors of myocardial infarction risk early in life than later

Monica Isgut et al. Genome Med. .

Abstract

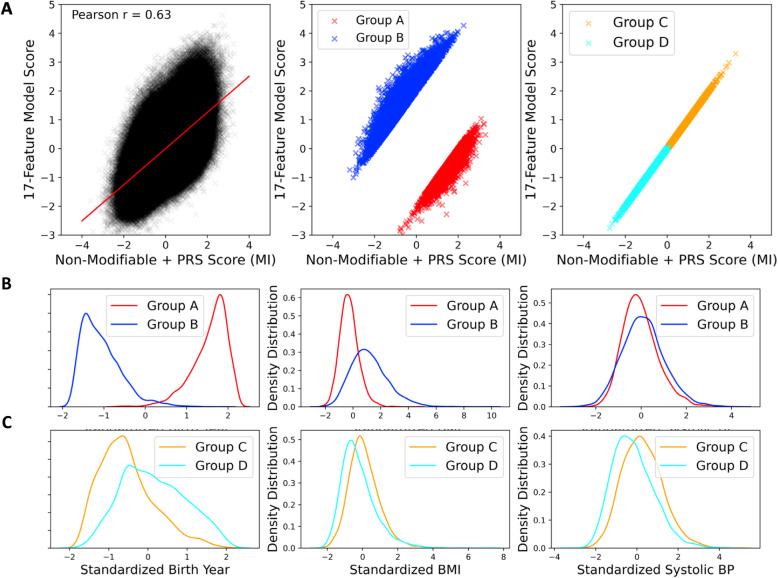
Background: Several polygenic risk scores (PRS) have been developed for cardiovascular risk prediction, but the additive value of including PRS together with conventional risk factors for risk prediction is questionable. This study assesses the clinical utility of including four PRS generated from 194, 46K, 1.5M, and 6M SNPs, along with conventional risk factors, to predict risk of ischemic heart disease (IHD), myocardial infarction (MI), and first MI event on or before age 50 (early MI).

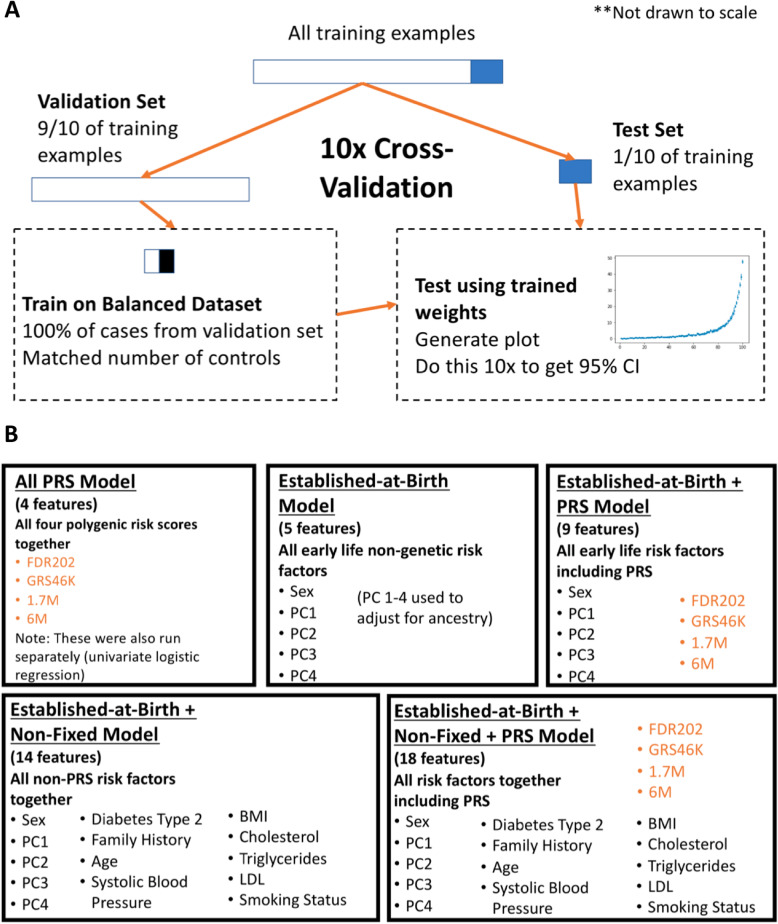
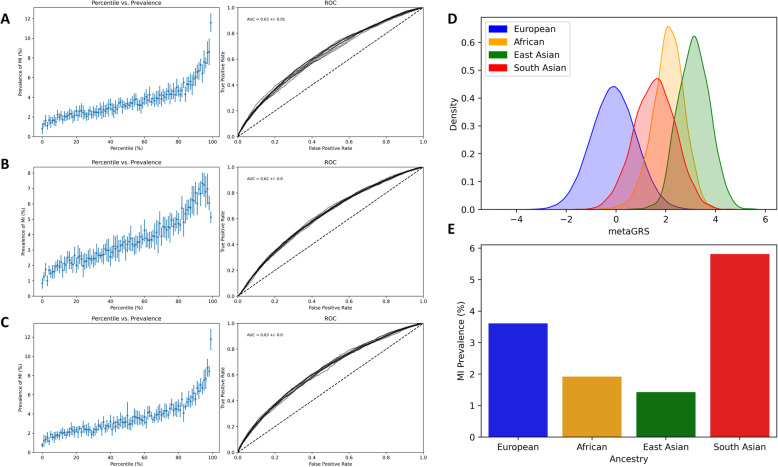
Methods: A cross-validated logistic regression (LR) algorithm was trained either on ~ 440K European ancestry individuals from the UK Biobank (UKB), or the full UKB population, including as features different combinations of conventional established-at-birth risk factors (ancestry, sex) and risk factors that are non-fixed over an individual's lifespan (age, BMI, hypertension, hyperlipidemia, diabetes, smoking, family history), with and without also including PRS. The algorithm was trained separately with IHD, MI, and early MI as prediction labels.

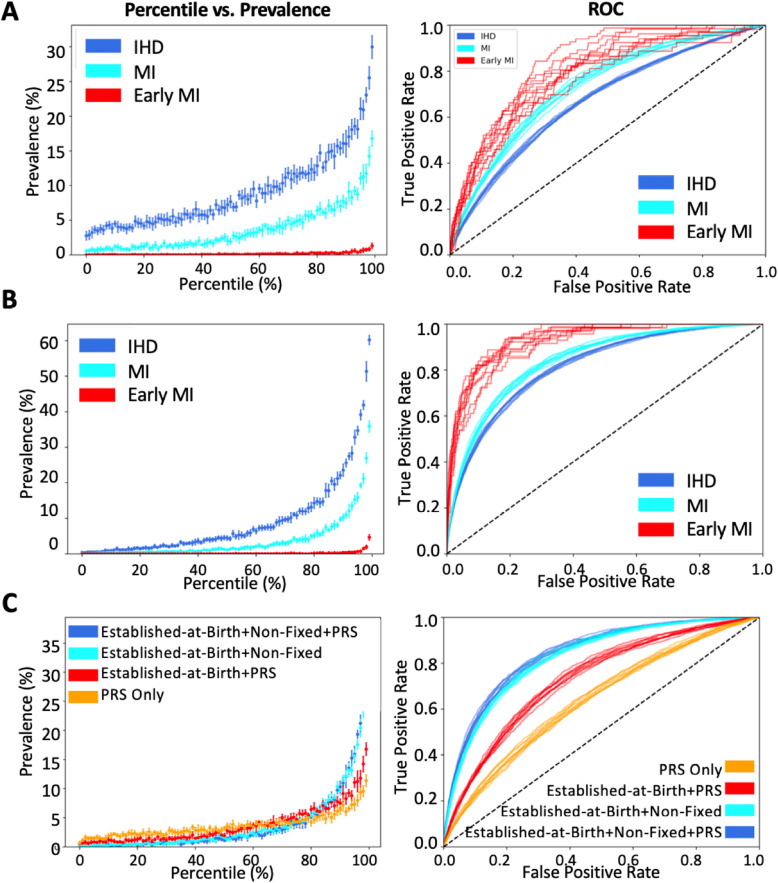
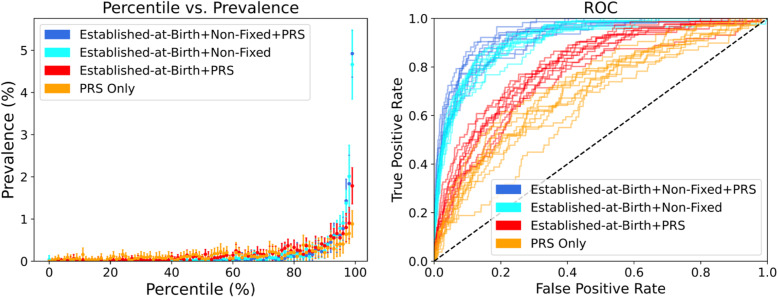
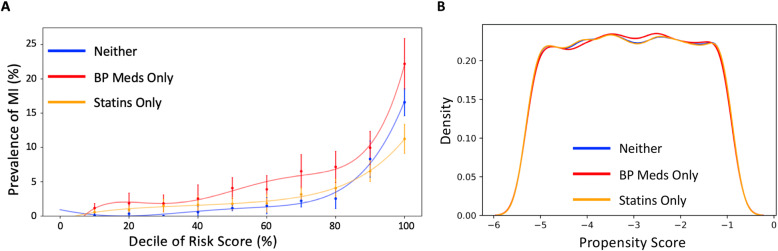
Results: When LR was trained using risk factors established-at-birth, adding the four PRS significantly improved the area under the curve (AUC) for IHD (0.62 to 0.67) and MI (0.67 to 0.73), as well as for early MI (0.70 to 0.79). When LR was trained using all risk factors, adding the four PRS only resulted in a significantly higher disease prevalence in the 98th and 99th percentiles of both the IHD and MI scores.

Conclusions: PRS improve cardiovascular risk stratification early in life when knowledge of later-life risk factors is unavailable. However, by middle age, when many risk factors are known, the improvement attributed to PRS is marginal for the general population.

Keywords: Coronary artery disease; Ischemic heart disease; Myocardial infarction; Polygenic risk scores; Risk assessment.


Conflict of interest statement

The authors declare that they have no competing interests.

Figures

Fig. 1
Fig. 1
Cross-validation scheme for logistic regression training and testing. a Schema indicating how each risk score was generated using a logistic regression algorithm trained with a selection of variable features and a dependent outcome label (IHD, MI, early MI). Ten folds of cross-validation were performed after dividing the full UKB dataset into ten equal subsets, each of which was iteratively used as a test set (1/10 of the data) after training on the others (9/10 of the data). In each iteration of the training, all cases were matched with an equal number of randomly sampled controls. b List of features included in each of five different LR models
Fig. 2
Fig. 2
Modeling cardiovascular risk in the UKB with genetics and non-fixed factors. Panels on the left-hand side show the prevalence in the White British and Irish European UKB sample versus modeled risk percentile, for the 9% with ischemic heart disease (IHD, dark blue), approaching 5% who have had a myocardial infarction (MI, cyan), and 0.15% who had MI before the age of 50 (early MI, red). Panels on the right show receiver-operating curves of sensitivity against specificity. Each curve represents one of 10 cross-validated estimates, with point estimates plus standard deviation on the left. a 9-feature established-at-birth model. b 18-feature full-model. c Effect of adding features for MI prediction alone, yielding 4-feature, 9-feature, 14-feature, and 18-feature models as outlined in Fig. 1a
Fig. 3
Fig. 3
Prevalence vs. risk percentile and ROC plots for four risk models for early MI. Plots show the predictive> performance and accuracy for the polygenic risk scores (PRS) only model (yellow), the 9-feature established-at-birth plus PRS model (red), 14-feature established-at-birth plus non-fixed model without PRS (light blue), and the 18-feature full model (dark blue). Each curve represents one of 10 cross-validated estimates, with point estimates plus standard deviation on the left
Fig. 4
Fig. 4
Adjustment for ancestry by logistic regression. a-c Prevalence vs. Risk percentile plots for MI for the White British and Irish Europeans (a), full UK Biobank (b) and a model including genotypic PC1 and PC2 to control for ancestry (c). d shows frequency distributions of European-derived PRS in each of the indicated ancestry groups, standardized to equivalent size (European n = 441,173; African 7190; East Asian 1471; South Asian 7413). e Prevalence of MI in each ancestry group
Fig. 5
Fig. 5
Comparison of MI Risk Scores with and without non-fixed risk factors. a Scatterplots of the full model (18-feature established-at-birth + non-fixed + PRS score) against the non-modifiable risk model (9-feature established-at-birth + PRS score). Individuals below the regression line (red, Group A in the middle panel) have comparatively lower predicted risk later in life compared to their predicted risk at birth, whereas those above the regression line (blue, Group B) have higher predicted risk of MI later in life; both groups represent the 2% extremes. The right -hand panel highlights individuals with relatively low risk according to both models (Group C, orange) or relatively high risk according to both models (cyan, Group D). b, c Standardized distributions of indicated non-fixed risk factors for the selected subsets of individuals, implying that high risk individuals are older and more overweight
Fig. 6
Fig. 6
Effect of genetics on prevalence as a function of medication. a Prevalence vs. risk decile plots showing overall greater apparent influence of genetics for patients on blood pressure medication. This analysis is based on the 18-feature logistic regression model run for White British and Irish-only patients with MI as the label. b Frequency distributions of propensity scores showing close similarity for the three groups

References

    1. Naldi L, Matzopoulos R, Birbeck G, Pahari B, Adair T, Lipshultz SE, et al. Global and regional mortality from 235 causes of death for 20 age groups in 1990 and 2010: a systematic analysis for the Global Burden of Disease Study 2010. Lancet. 2012;380:2095–2128. doi: 10.1016/S0140-6736(12)61728-0. - DOI - PMC - PubMed
    1. Vos T, Allen C, Arora M, Barber RM, Brown A, Carter A, et al. Global, regional, and national incidence, prevalence, and years lived with disability for 310 diseases and injuries, 1990–2015: a systematic analysis for the Global Burden of Disease Study 2015. Lancet. 2016;388:1545–1602. doi: 10.1016/S0140-6736(16)31678-6. - DOI - PMC - PubMed
    1. Centers for Disease Control and Prevention (CDC) Prevalence of coronary heart disease--United States, 2006–2010. MMWR Morb Mortal Wkly Rep. 2011;60:1377–1381. - PubMed
    1. Damen JAAG, Hooft L, Schuit E, Debray TPA, Collins GS, Tzoulaki I, et al. Prediction models for cardiovascular disease risk in the general population: systematic review. BMJ. 2016;353:i2416. doi: 10.1136/bmj.i2416. - DOI - PMC - PubMed
    1. Alaa AM, Bolton T, Di Angelantonio E, Rudd JHF, van der Schaar M. Cardiovascular disease risk prediction using automated machine learning: a prospective study of 423,604 UK Biobank participants. PLoS One. 2019;14:e0213653. doi: 10.1371/journal.pone.0213653. - DOI - PMC - PubMed

Publication types