. 2021 Jan 28;15(1):7.
doi: 10.1186/s40246-021-00308-5.

High heterogeneity undermines generalization of differential expression results in RNA-Seq analysis

Affiliations

High heterogeneity undermines generalization of differential expression results in RNA-Seq analysis

Weitong Cui et al. Hum Genomics. .

Abstract

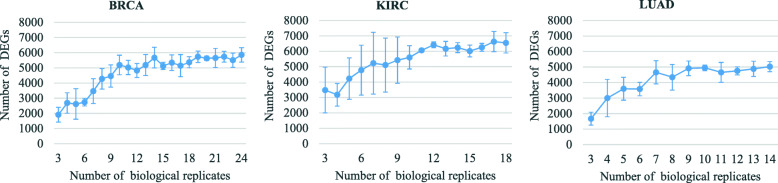
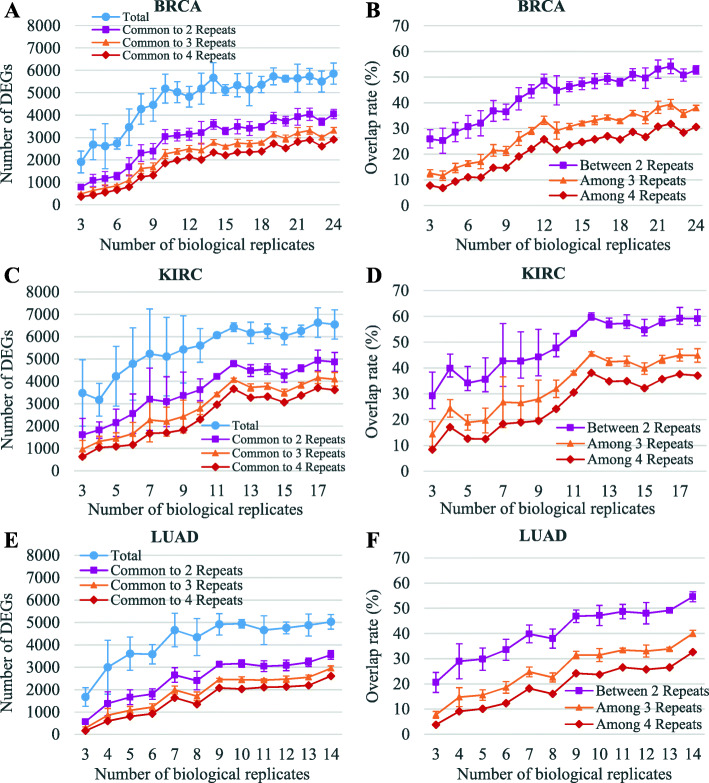
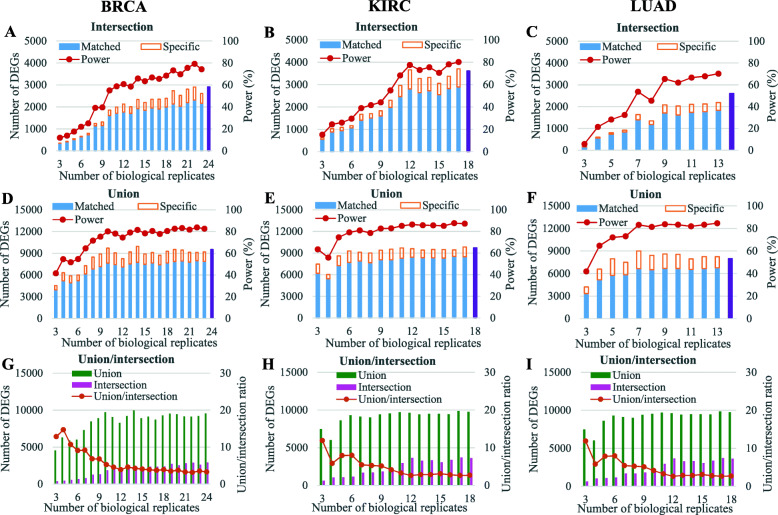
Background: RNA sequencing (RNA-Seq) has been widely applied in oncology for monitoring transcriptome changes. However, the emerging problem that high variation of gene expression levels caused by tumor heterogeneity may affect the reproducibility of differential expression (DE) results has rarely been studied. Here, we investigated the reproducibility of DE results for any given number of biological replicates between 3 and 24 and explored why a great many differentially expressed genes (DEGs) were not reproducible.

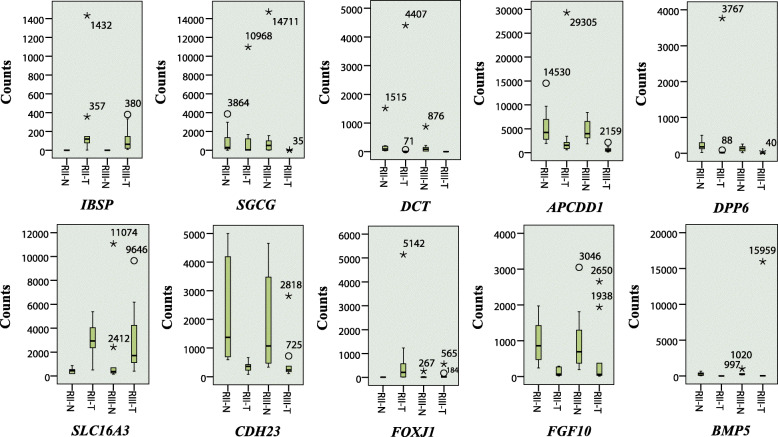
Results: Our findings demonstrate that poor reproducibility of DE results exists not only for small sample sizes, but also for relatively large sample sizes. Quite a few of the DEGs detected are specific to the samples in use, rather than genuinely differentially expressed under different conditions. Poor reproducibility of DE results is mainly caused by high variation of gene expression levels for the same gene in different samples. Even though biological variation may account for much of the high variation of gene expression levels, the effect of outlier count data also needs to be treated seriously, as outlier data severely interfere with DE analysis.

Conclusions: High heterogeneity exists not only in tumor tissue samples of each cancer type studied, but also in normal samples. High heterogeneity leads to poor reproducibility of DEGs, undermining generalization of differential expression results. Therefore, it is necessary to use large sample sizes (at least 10 if possible) in RNA-Seq experimental designs to reduce the impact of biological variability and DE results should be interpreted cautiously unless soundly validated.

Keywords: Differential expression; Heterogeneity; Outlier; RNA sequencing; Reproducibility; Tumor.


Conflict of interest statement

The authors declare that they have no competing interests.

Figures

Fig. 1
Fig. 1
The relationship between the mean number of DEGs and the number of biological replicates. The maximum biological replicate numbers vary depending on the total sample numbers for each cancer type in TCGA. The values represent the M ± SD of the number of DEGs for any given number of biological replicates
Fig. 2
Fig. 2
Reproducibility of DE results among the four repeats for a given number of biological replicates. a, c, e The mean number of common DEGs for any two (purple line), three (orange line), or four (red line) repeats for each cancer type depending on the number of biological replicates, and the mean total number of DEGs for any given number of biological replicates (blue line) is also shown for reference. b, d, f The overlap rate of DE results for any two (purple line), three (orange line), or four (red line) repeats for each cancer type depending on the number of biological replicates
Fig. 3
Fig. 3
Evolution of detection power and union/intersection depending on the number of biological replicates. a–c The number of DEGs and the power of the intersection for a given number of biological replicates for each cancer type. df show the number of DEGs and the power of the union for a given number of biological replicates for each cancer type. For all the stacked bars in charts af, the blue part represents the number of DEGs that match with the corresponding referential intersection or union, while the orange part represents the specific DEGs (not match with the corresponding reference) of the intersection or union. Purple color bars in charts af represent the number of DEGs in the referential intersections or unions for each cancer type. gi The number of DEGs in the union (green bar) and intersection (pink bar), as well as the union/intersection ratio (orange line), for a given number of biological replicates for each cancer type
Fig. 4
Fig. 4
Dispersion of normalized read counts for the 10 non-common genes in BRCA. Mild outliers (more than 1.5 IQR’s from the box, indicated by a circle) and extreme outliers (more than 3 IQR’s from the box, indicated by an asterisk) are shown. The number beside the marker shows the normalized read count value of the point. RII and RIII refer to repeat II and repeat III, respectively. Capital letters “T” and “N” represent the tumor group and the normal group, respectively. IQR indicates the interquartile range

References

    1. Wang E, Zou J, Zaman N, Beitel LK, Trifiro M, Paliouras M. Cancer systems biology in the genome sequencing era: part 1, dissecting and modeling of tumor clones and their networks. Semin Cancer Biol. 2013;23:279–285. doi: 10.1016/j.semcancer.2013.06.002. - DOI - PubMed
    1. Wang E, Zou J, Zaman N, Beitel LK, Trifiro M, Paliouras M. Cancer systems biology in the genome sequencing era: part 2, evolutionary dynamics of tumor clonal networks and drug resistance. Semin Cancer Biol. 2013;23:286–292. doi: 10.1016/j.semcancer.2013.06.001. - DOI - PubMed
    1. Stark R, Grzelak M, Hadfield J. RNA sequencing: the teenage years. Nat Rev Genet. 2019;20:631–656. doi: 10.1038/s41576-019-0150-2. - DOI - PubMed
    1. Hitzemann R, Bottomly D, Darakjian P, Walter N, Iancu O, Searles R, et al. Genes, behavior and next-generation RNA sequencing. Genes Brain Behav. 2013;12:1–12. doi: 10.1111/gbb.12007. - DOI - PMC - PubMed
    1. Marioni JC, Mason CE, Mane SM, Stephens M, Gilad Y. RNA-seq: an assessment of technical reproducibility and comparison with gene expression arrays. Genome Res. 2008;18:1509–1517. doi: 10.1101/gr.079558.108. - DOI - PMC - PubMed

Publication types

Substances