

Linking historical discriminatory housing patterns to the contemporary food environment in Baltimore
- PMID: 33509435
- PMCID: PMC7846820
- DOI: 10.1016/j.sste.2020.100387
Linking historical discriminatory housing patterns to the contemporary food environment in Baltimore
Abstract
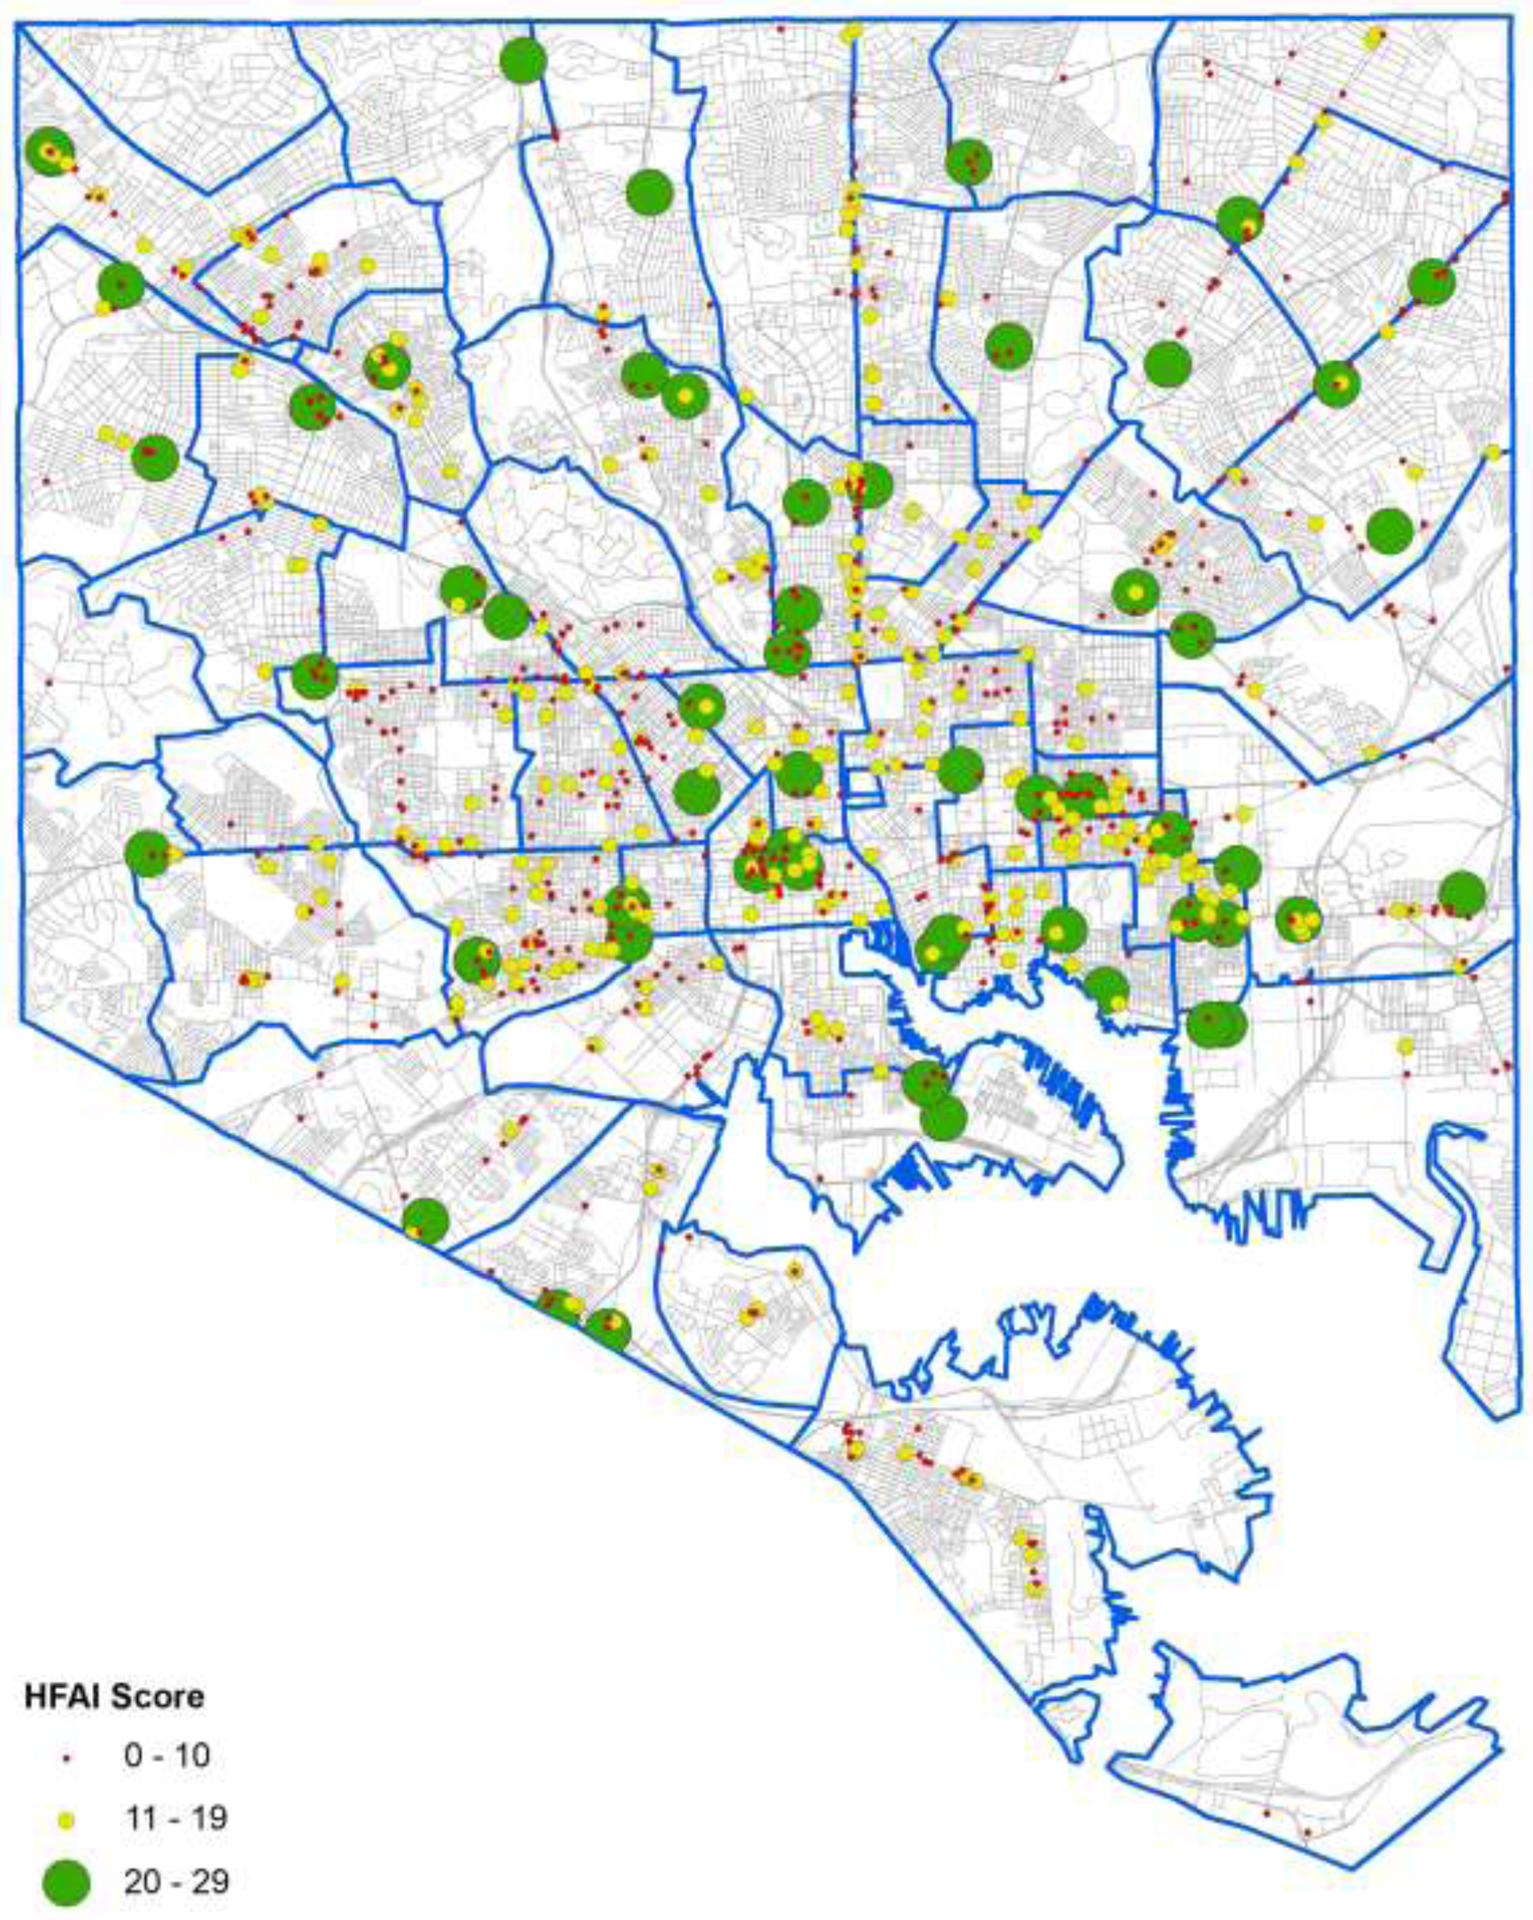
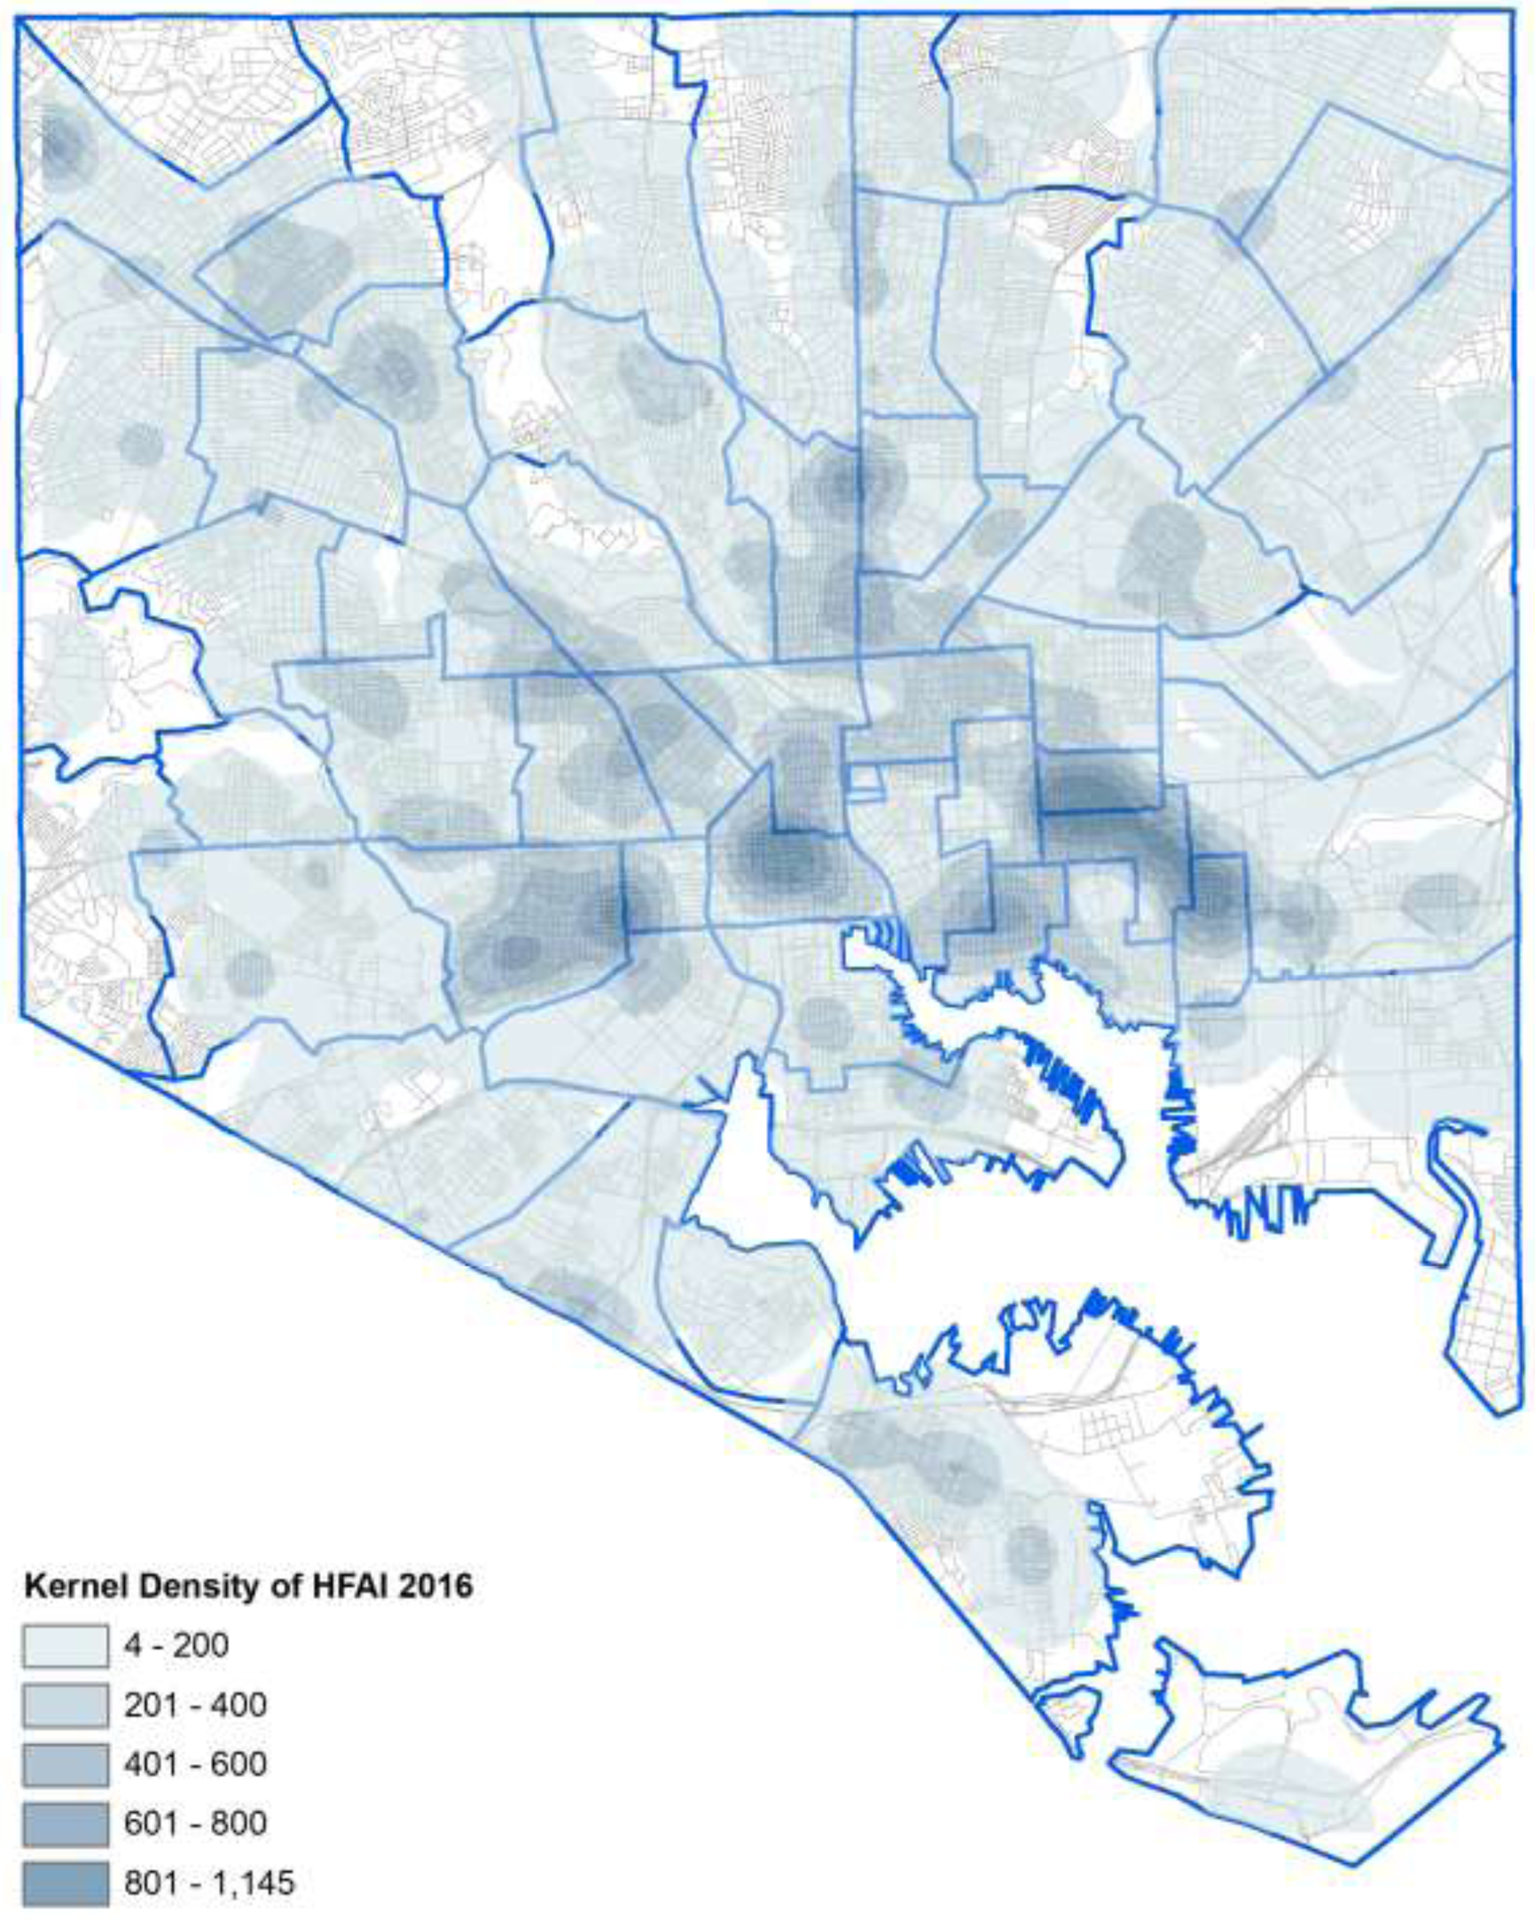
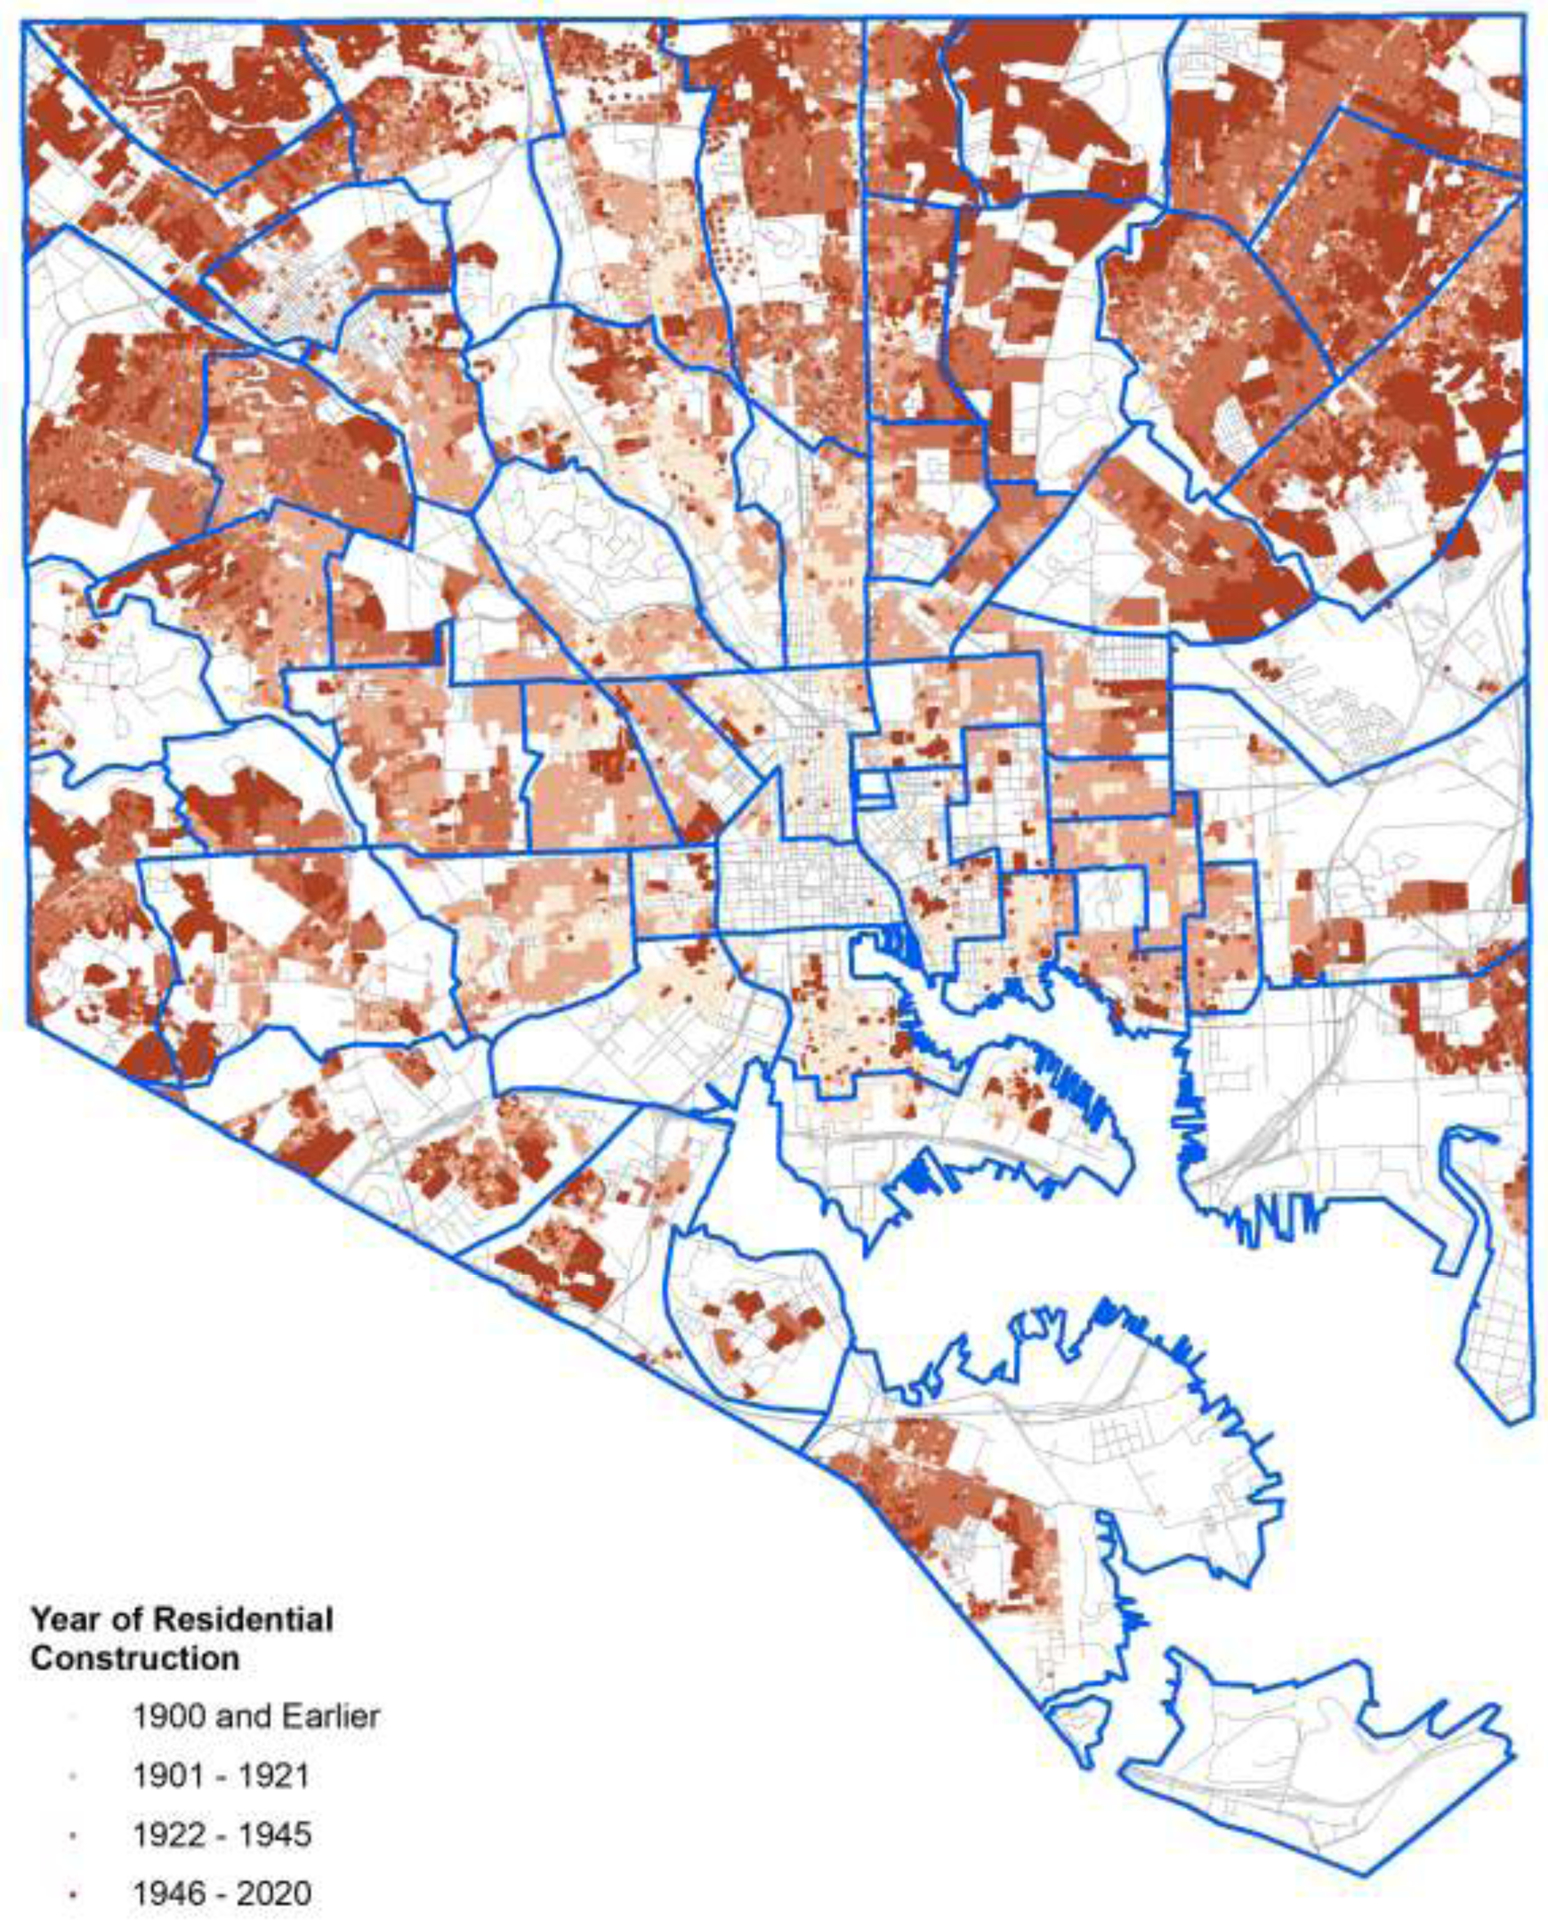
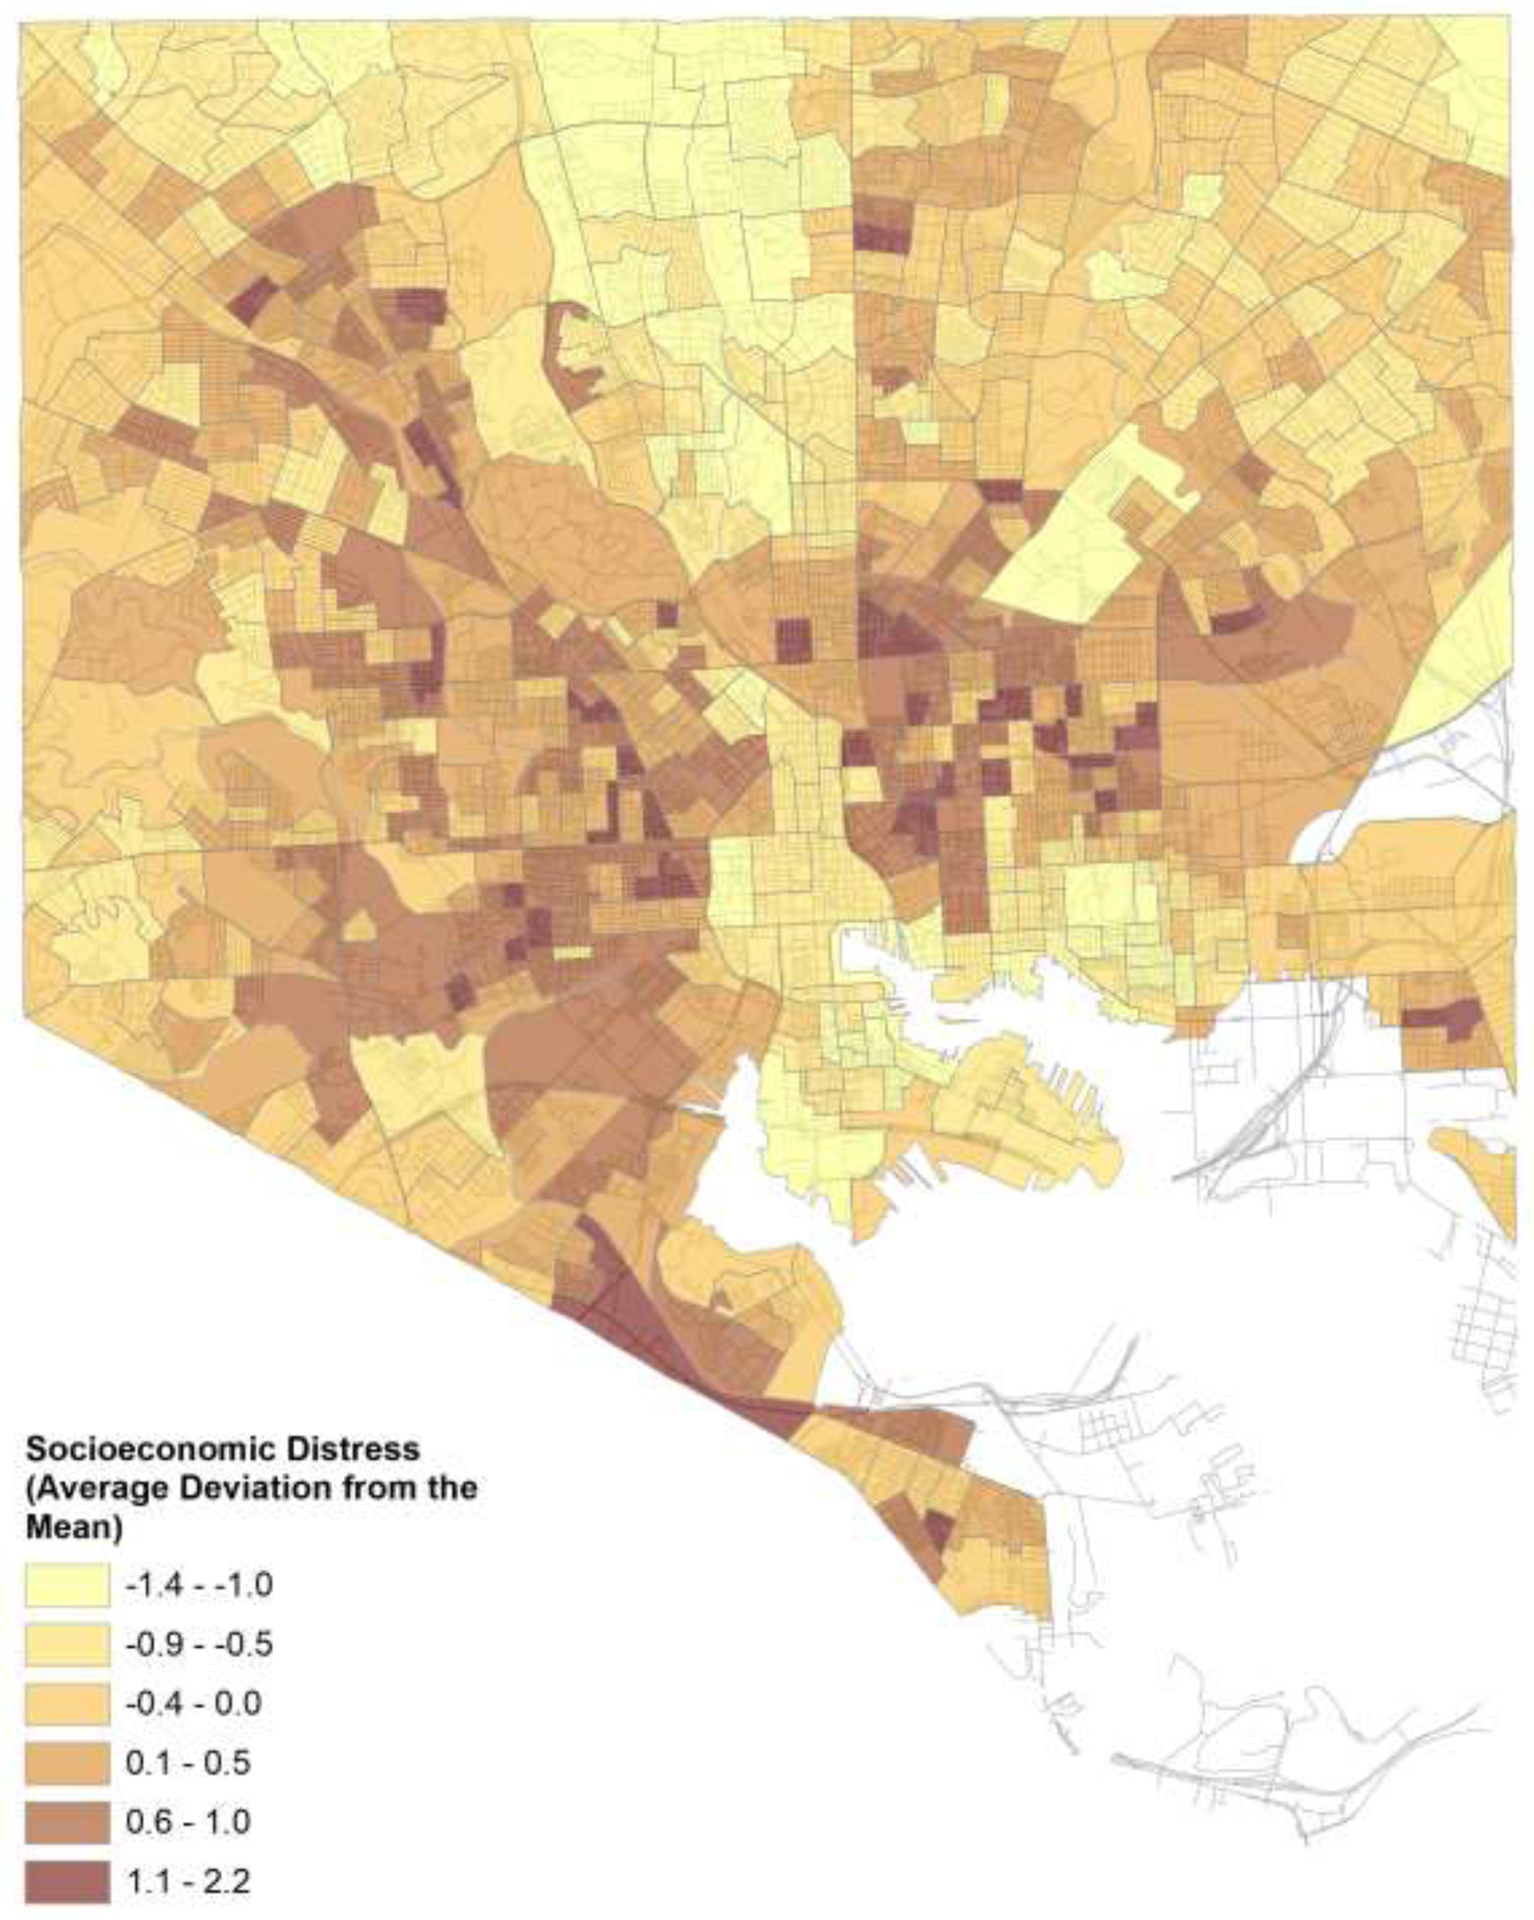
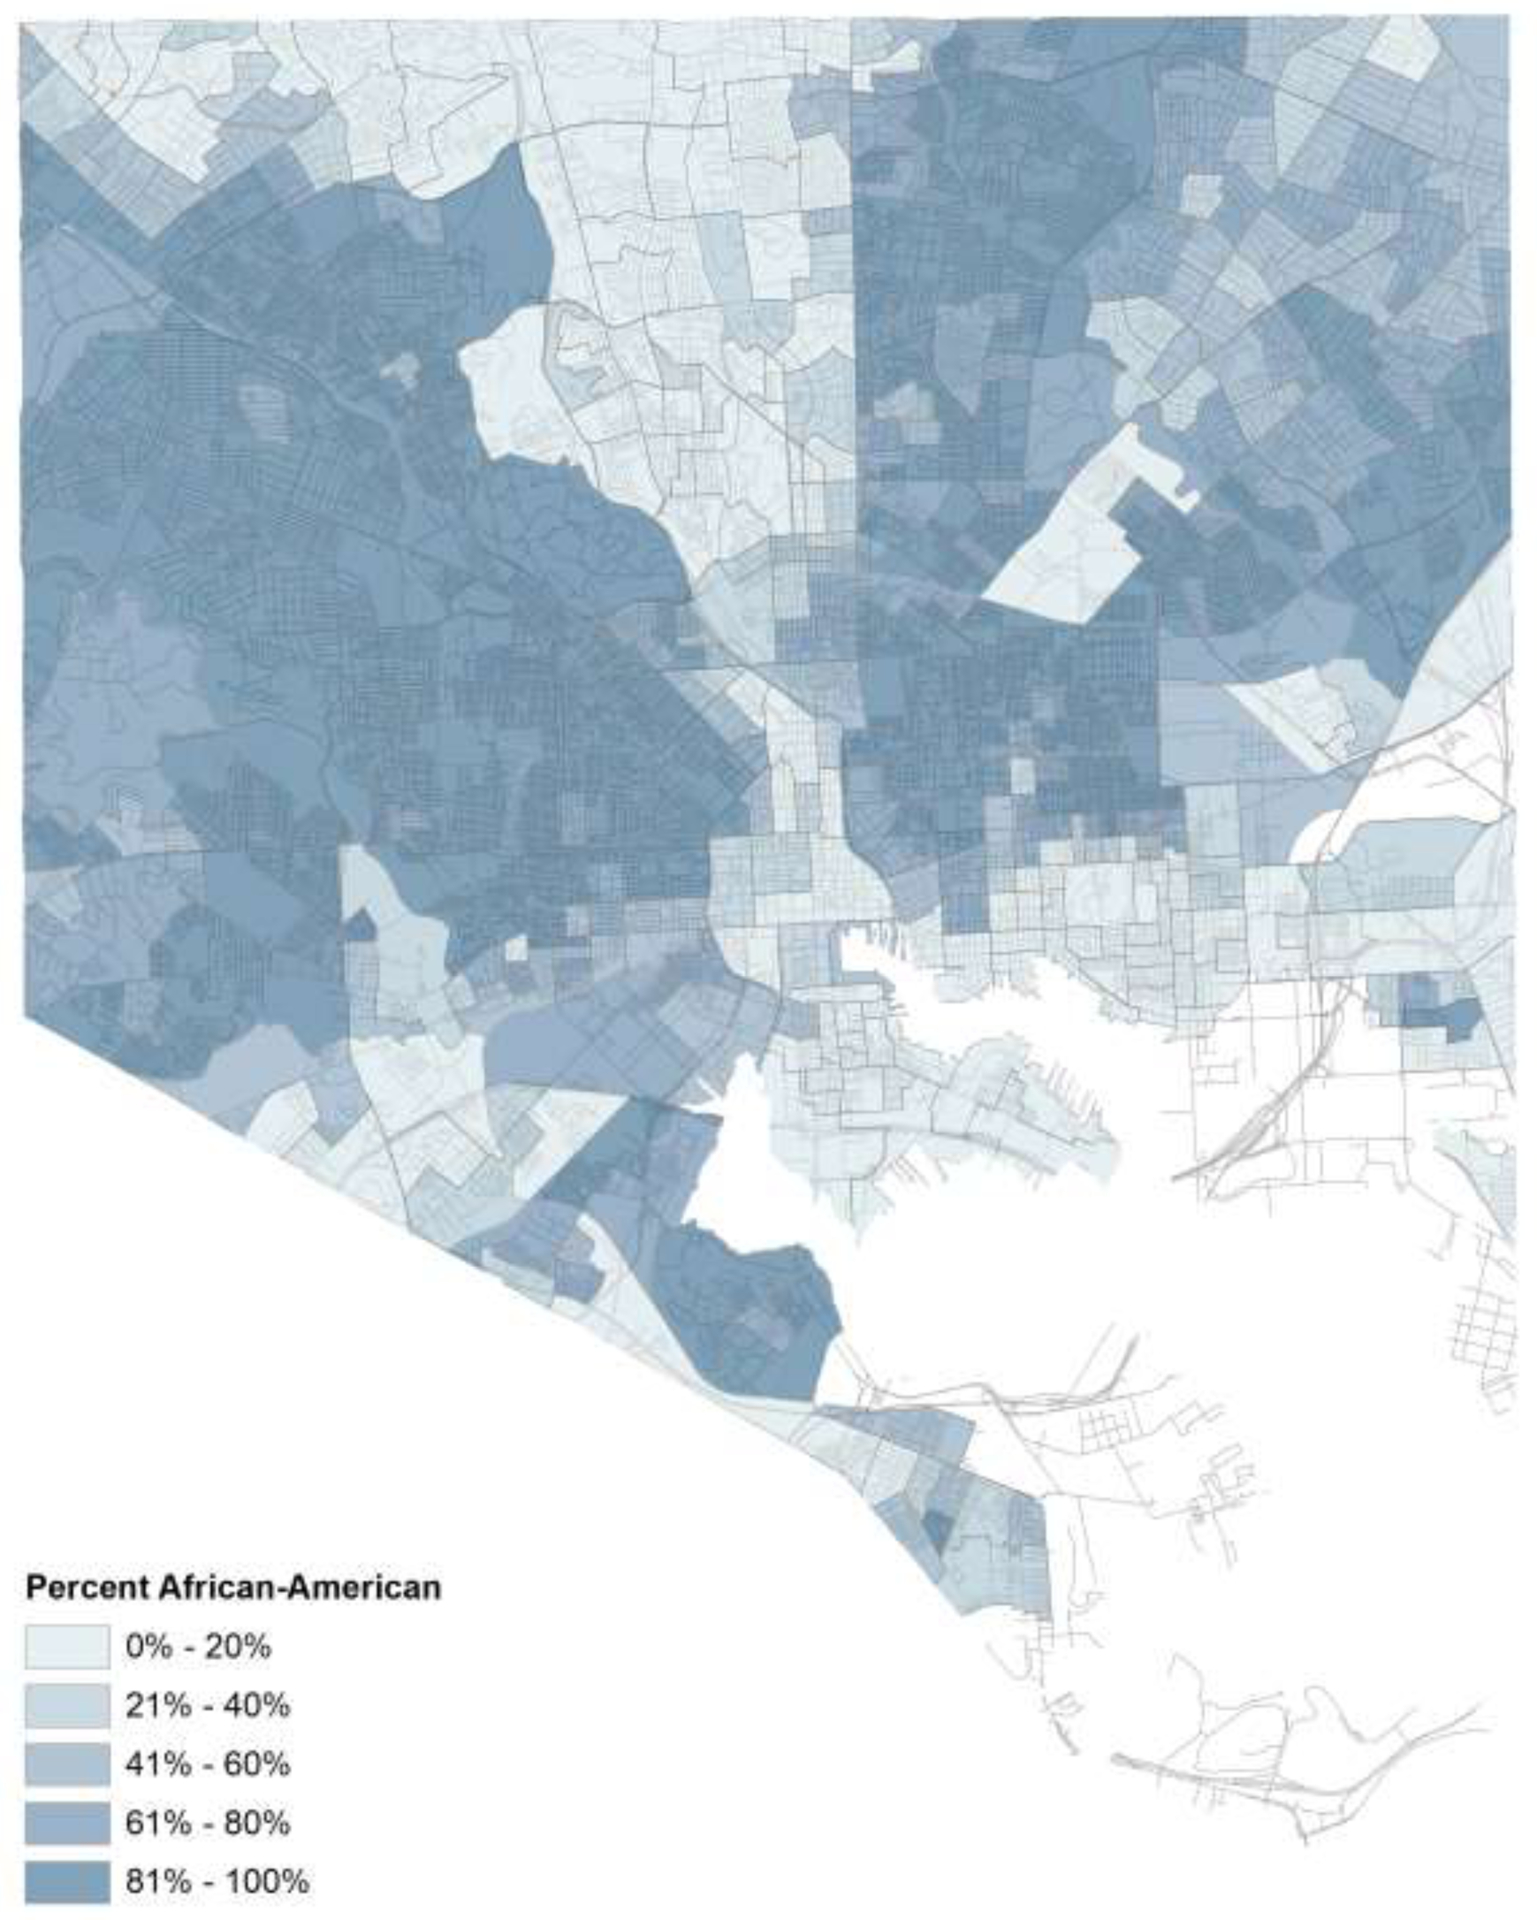
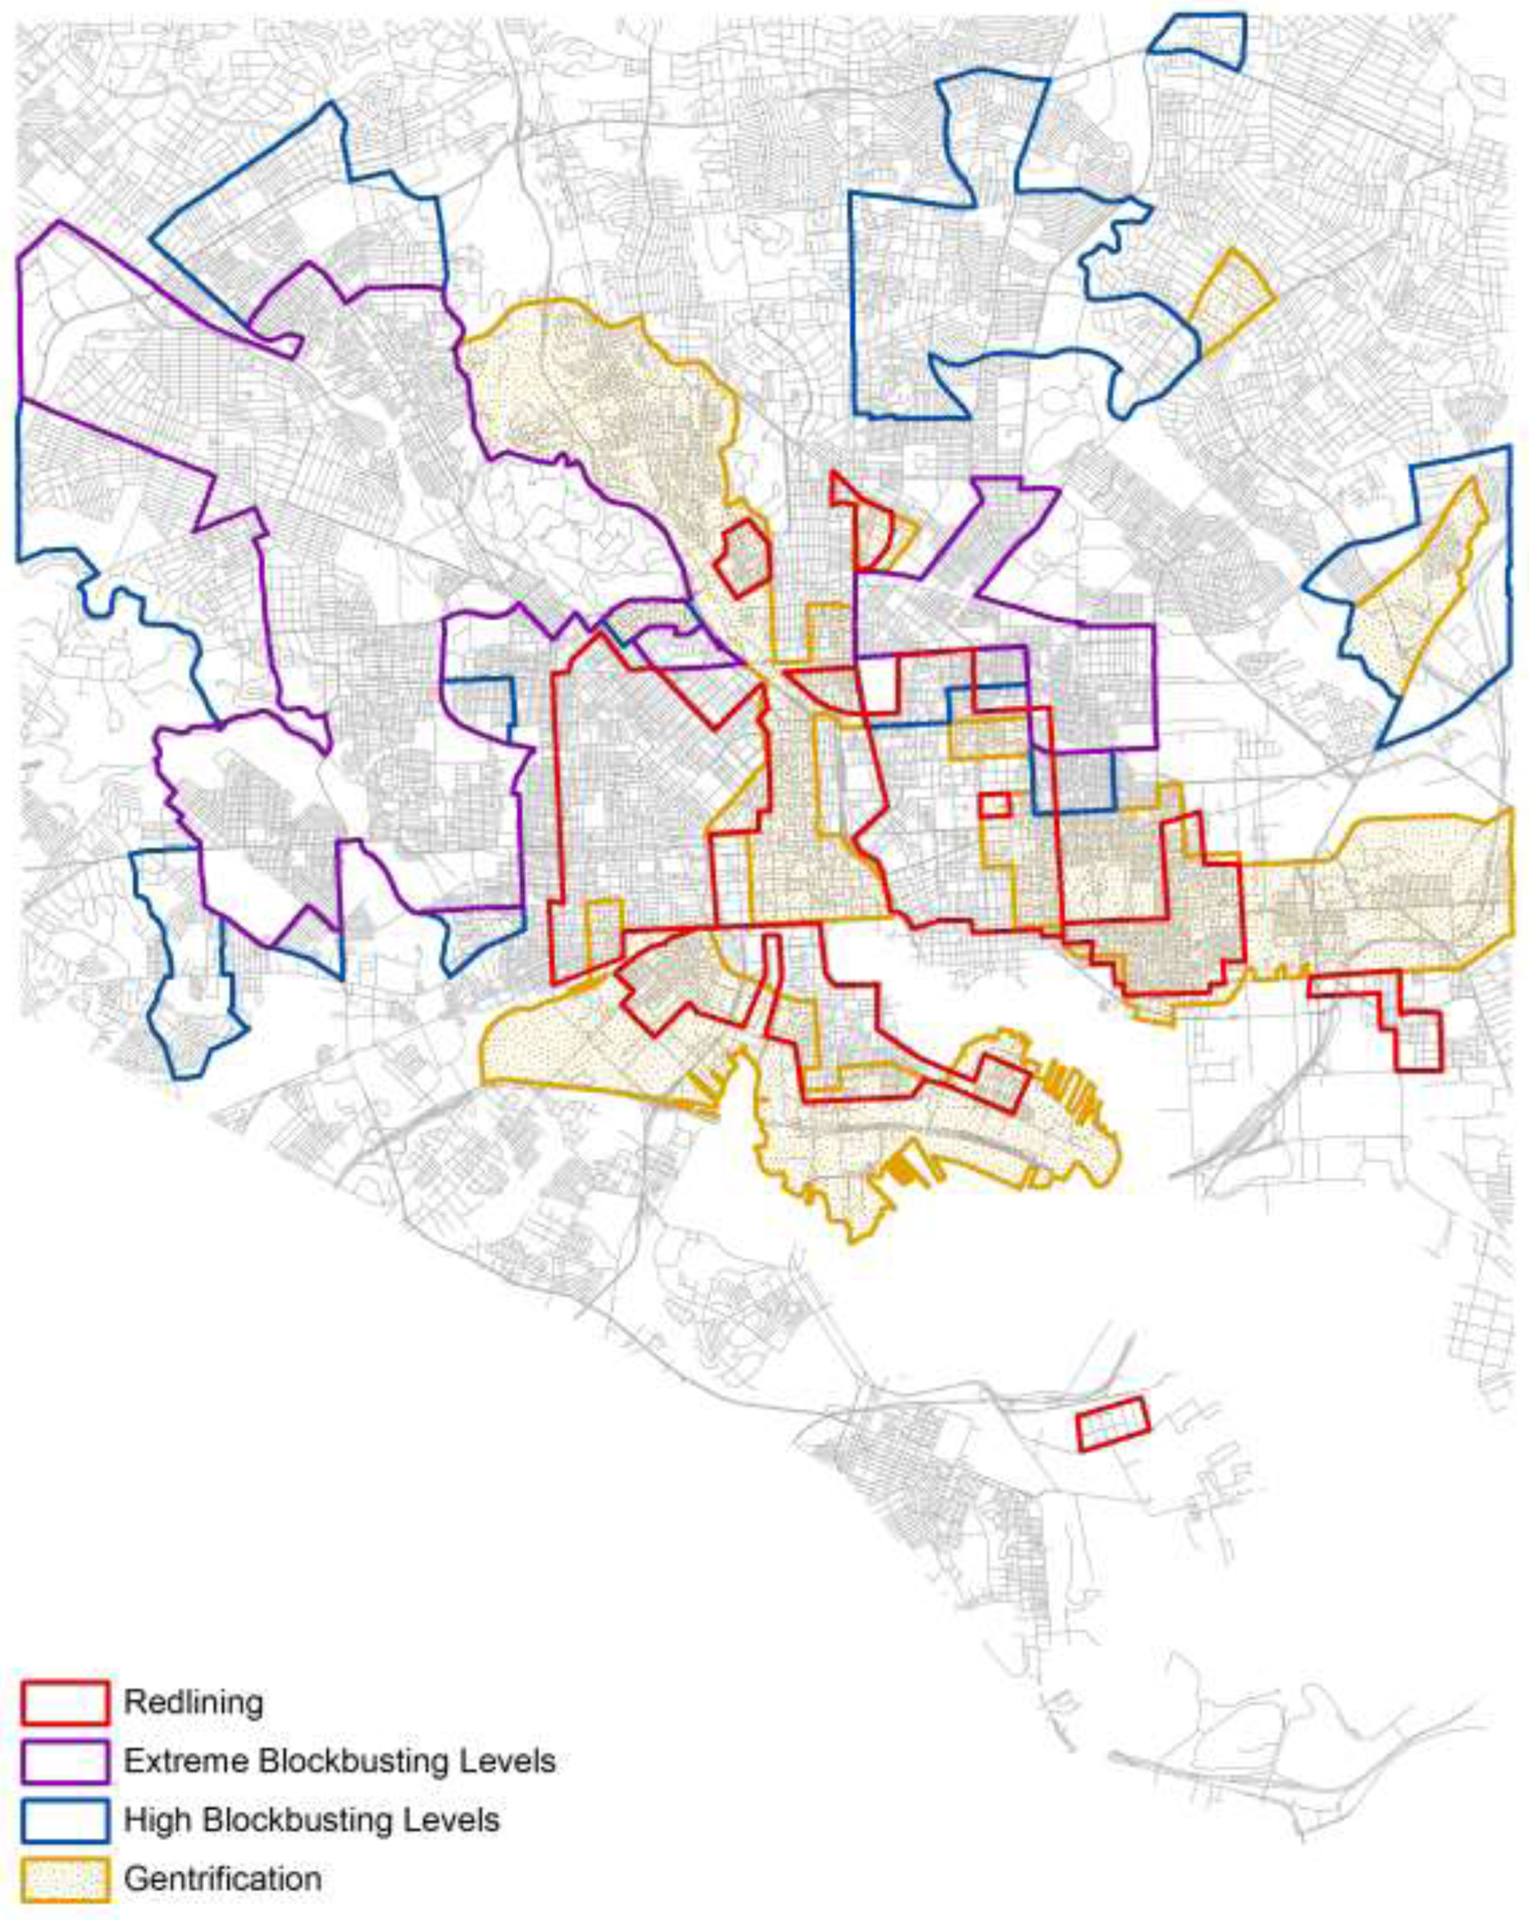
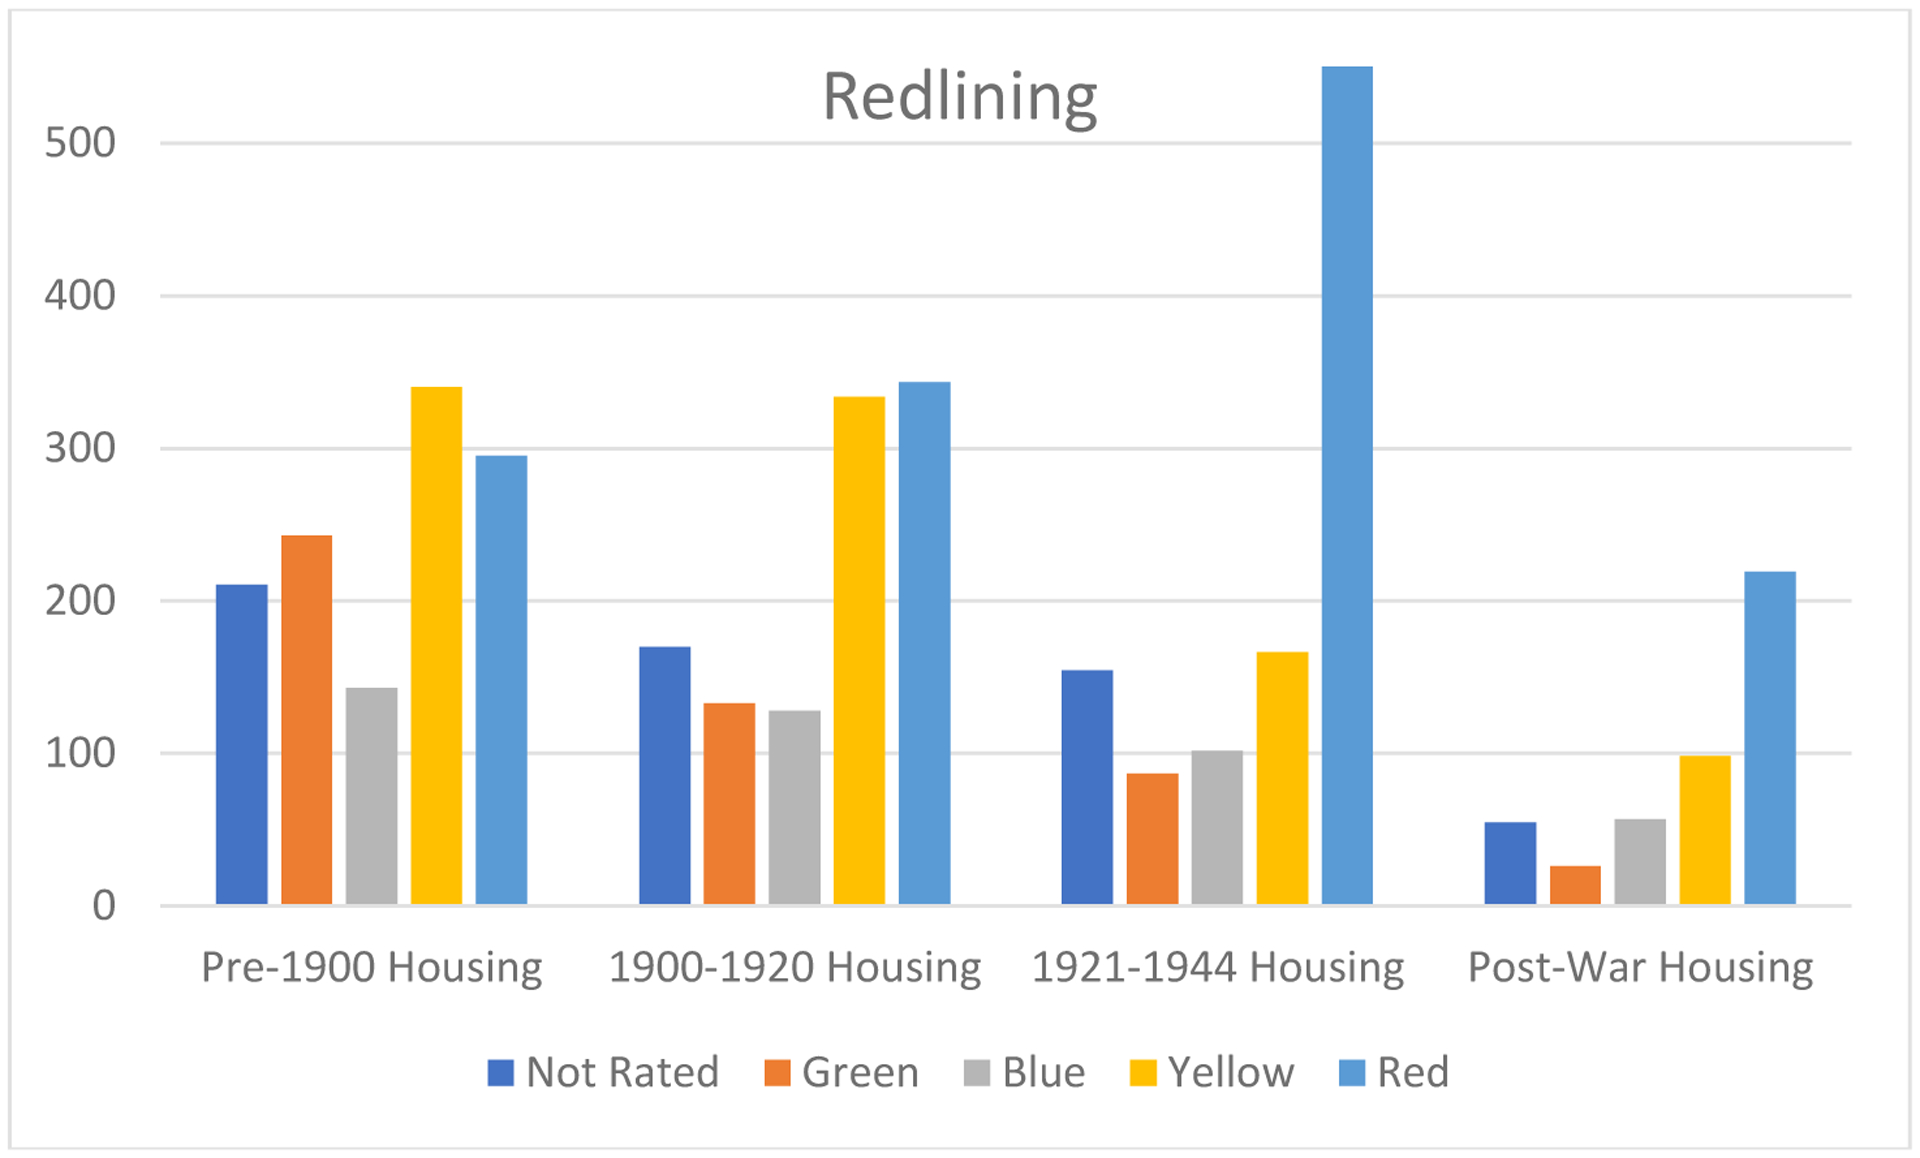
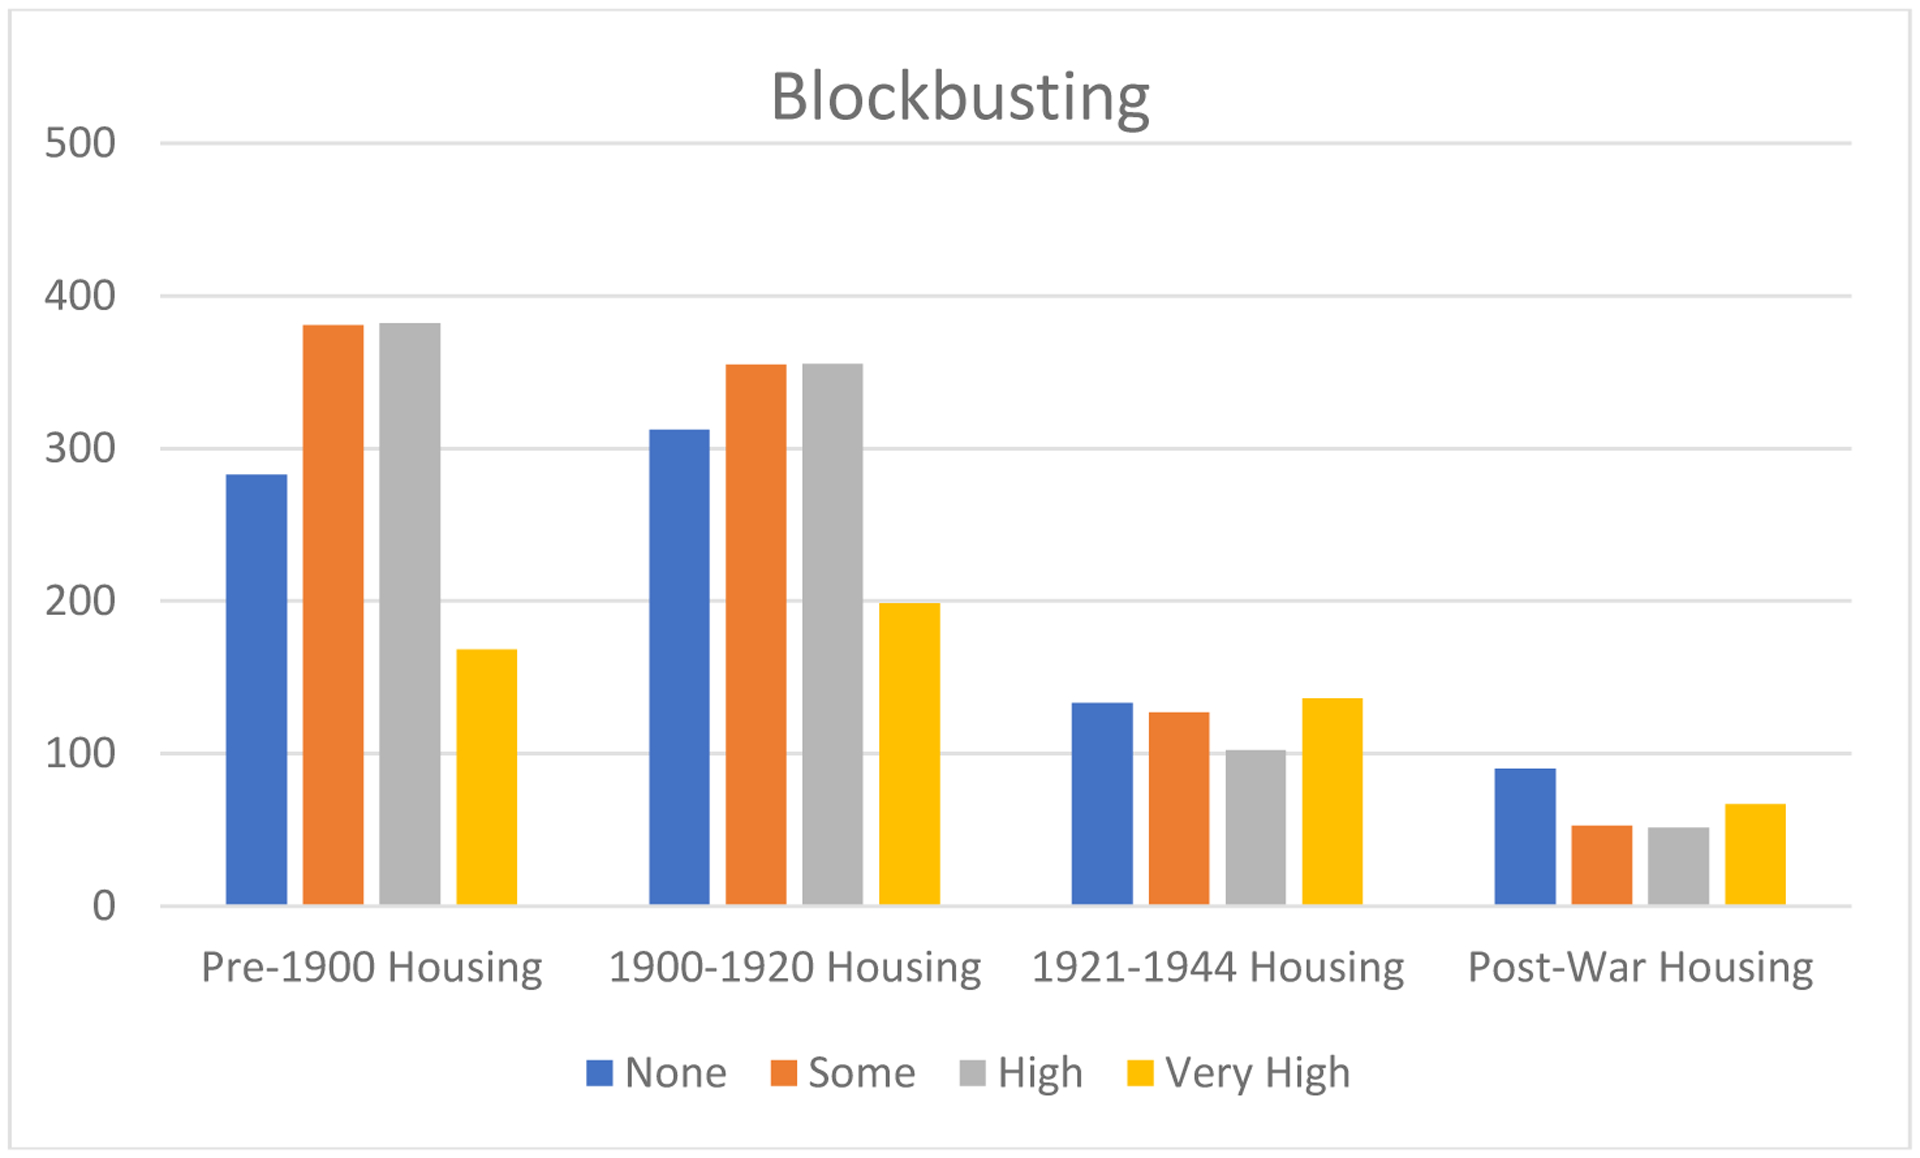
Food access literature links disinvested communities with poor food access. Similarly, links are made between discriminatory housing practices and contemporary investment. Less work has examined the relationship between housing practices and food environment disparities. Our central premise is that these practices create distinctions in food environment quality, and that these disparities may have implications for food system advocacy and policymaking. In this paper, we link an objective food environment assessment with a spatial database highlighting redlining, blockbusting, and gentrification in Baltimore, Maryland, USA. Standard socioeconomic and housing characteristics are used to control for race, income, and housing composition in a multivariate regression analysis. Our findings highlight that blockbusting-rather than redlining-most strongly shapes poor food access. Redlining and gentrification, meanwhile, are associated with better food access. These findings raise important points about future policy discussions, which should instead be focused on ameliorating more contemporary patterns of housing inequality.
Keywords: Blockbusting; Food access; Food environments; GIS; Gentrification; Redlining.
Copyright © 2020. Published by Elsevier Ltd.
Figures
References
-
- Alkon AH, & Cadji J (2020). Sowing seeds of displacement: gentrification and food justice in Oakland, CA. International Journal of Urban and Regional Research, 44(1), 108–123.
-
- Appel I, & Nickerson J (2016). Pockets of poverty: The long-term effects of redlining. Available at SSRN 2852856.
-
- Baltimore City (2020). Baltimore City Open GIS. Retrieved from: http://gis-baltimore.opendata.arcgis.com/.
-
- Baltimore City Health Department (2017). Neighborhood Health Profile Reports. Retrieved from: https://health.baltimorecity.gov/neighborhoods/neighborhood-health-profi....
-
- Biehl E, Buzogany S, Baja K, & Neff RA (2018). Planning for a resilient urban food system: A case study from Baltimore City, Maryland. Journal of Agriculture, Food Systems, and Community Development, 8(B), 39–53.
Publication types
MeSH terms
Grants and funding
LinkOut - more resources
Full Text Sources
Other Literature Sources
